| Param | Original file | Final file |
|---|---|---|
| Filename | modeM0/AS1C05_019T04_9000004074_28227cztM0_level2.evt | modeM0/AS1C05_019T04_9000004074_28227cztM0_level2_quad_clean.evt |
| Size (bytes) | 585,227,520 | 120,000,960 |
| Size | 558.1 MB | 114.4 MB |
| Events in quadrant A | 3,100,381 | 832,374 |
| Events in quadrant B | 4,923,584 | 840,113 |
| Events in quadrant C | 3,116,272 | 796,659 |
| Events in quadrant D | 6,148,246 | 716,961 |
| Mode M9 | |||
|---|---|---|---|
| Quadrant | BADHDUFLAG | Total packets | Discarded packets |
| A | 0 | 16 | 0 |
| B | 0 | 17 | 0 |
| C | 0 | 17 | 0 |
| D | 0 | 17 | 0 |
| Mode M0 | |||
|---|---|---|---|
| Quadrant | BADHDUFLAG | Total packets | Discarded packets |
| A | 0 | 13280 | 0 |
| B | 0 | 18910 | 0 |
| C | 0 | 13384 | 0 |
| D | 0 | 22683 | 0 |
| Quadrant | Total seconds | Saturated seconds | Saturation percentage |
|---|---|---|---|
| A | 6418 | 36 | 0.560922% |
| B | 6417 | 327 | 5.095839% |
| C | 6417 | 60 | 0.935016% |
| D | 6417 | 955 | 14.882344% |
Noise dominated data is calculated using 1-second bins in cleaned event files. If a bin has >2000 counts, and if more than 50% of those come from <1% of pixels, then it is considered to be noise-dominated and hence unusable.
| Quadrant | # 1 sec bins | Bins with >0 counts | Bins with >2000 counts | High rate bins dominated by noise | Noise dominated (total time) | Noise dominated (detector-on time) | Marked lightcurve |
|---|---|---|---|---|---|---|---|
| A | 7703 | 6420 | 1 | 1 | 0.01% | 0.02% | 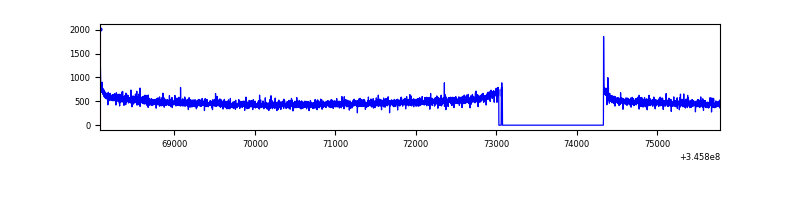 |
| B | 7702 | 6418 | 132 | 132 | 1.71% | 2.06% | 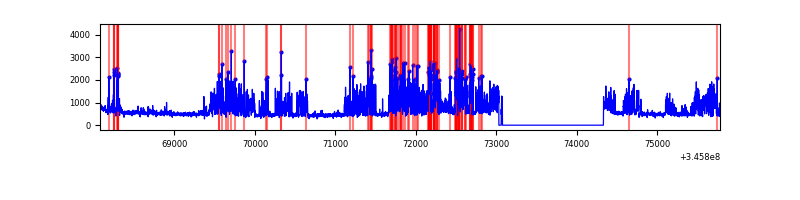 |
| C | 7702 | 6419 | 0 | 0 | 0.00% | 0.00% | 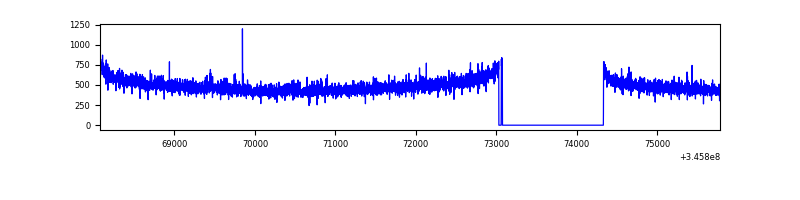 |
| D | 7702 | 6419 | 846 | 846 | 10.98% | 13.18% | 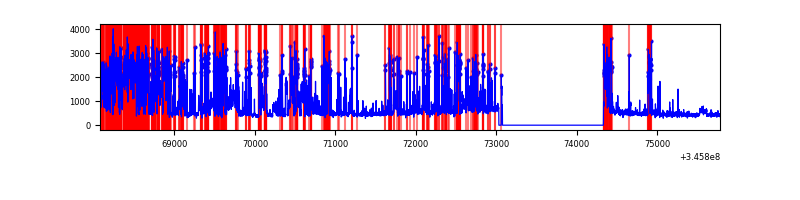 |
Top three noisy pixels from each quadrant. If the there are fewer than three noisy pixels in the level2.evt file, extra rows are filled as -1
| Pixel properties | Quadrant properties | ||||||
|---|---|---|---|---|---|---|---|
| Quadrant | DetID | PixID | Counts | Sigma | Mean | Median | Sigma |
| A | 8 | 192 | 10276 | 59.73 | 801 | 788 | 158.9 |
| A | 13 | 254 | 9422 | 54.35 | 801 | 788 | 158.9 |
| A | 3 | 137 | 7458 | 41.99 | 801 | 788 | 158.9 |
| B | 5 | 255 | 1392491 | 9564.41 | 786 | 768 | 145.5 |
| B | 10 | 245 | 378396 | 2595.19 | 786 | 768 | 145.5 |
| B | 0 | 183 | 47304 | 319.81 | 786 | 768 | 145.5 |
| C | 14 | 238 | 125242 | 712.51 | 758 | 762 | 174.7 |
| C | 3 | 233 | 25496 | 141.58 | 758 | 762 | 174.7 |
| C | 5 | 37 | 14597 | 79.19 | 758 | 762 | 174.7 |
| D | 1 | 52 | 2946517 | 17379.03 | 715 | 695 | 169.5 |
| D | 8 | 195 | 232775 | 1369.16 | 715 | 695 | 169.5 |
| D | 5 | 222 | 211094 | 1241.26 | 715 | 695 | 169.5 |
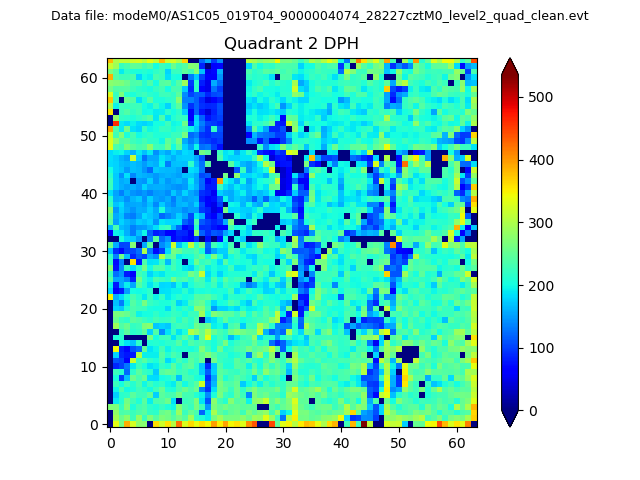
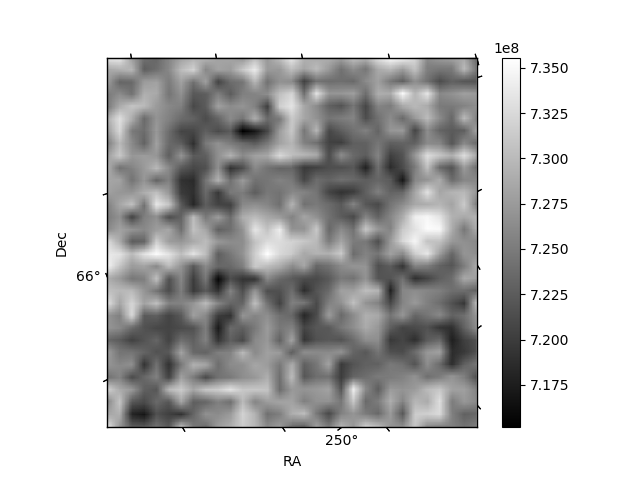
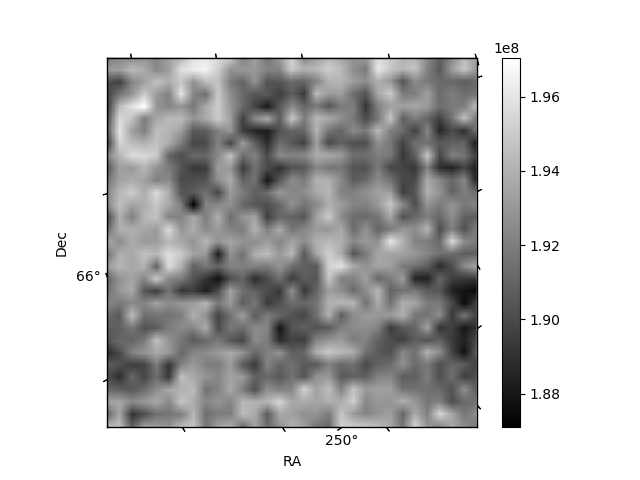
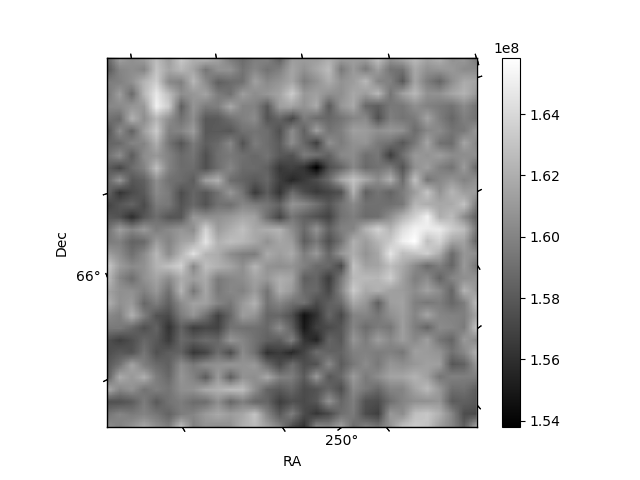
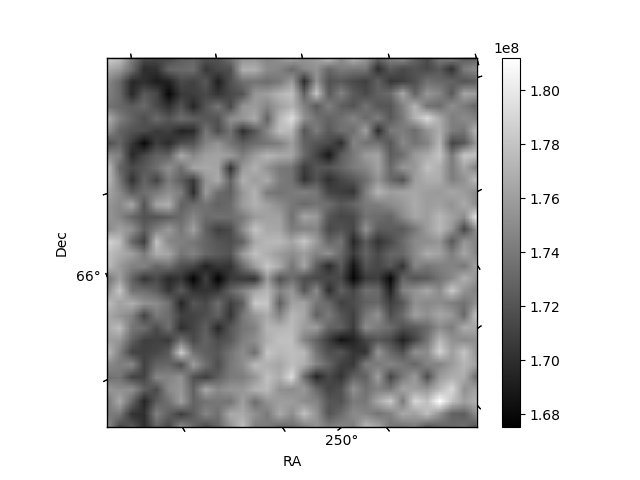
Histogram calculated using DETX and DETY for each event in the final _common_clean file
| Quadrant A | 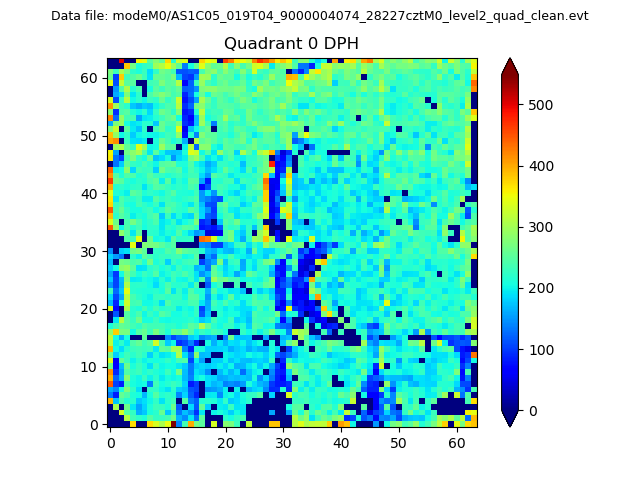 |
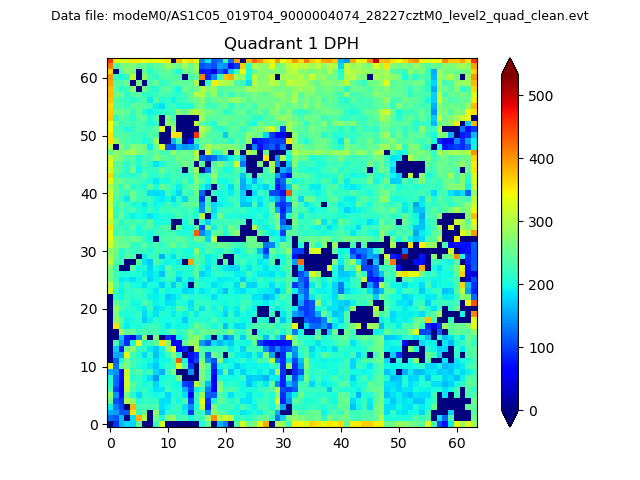 |
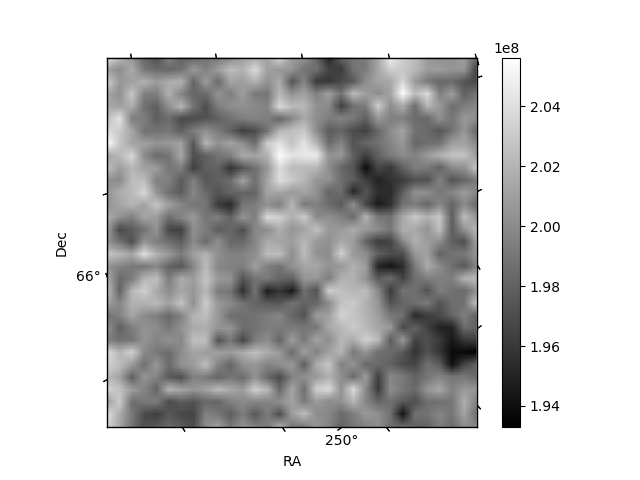
Quadrant B |
|---|---|---|---|
| Quadrant D | 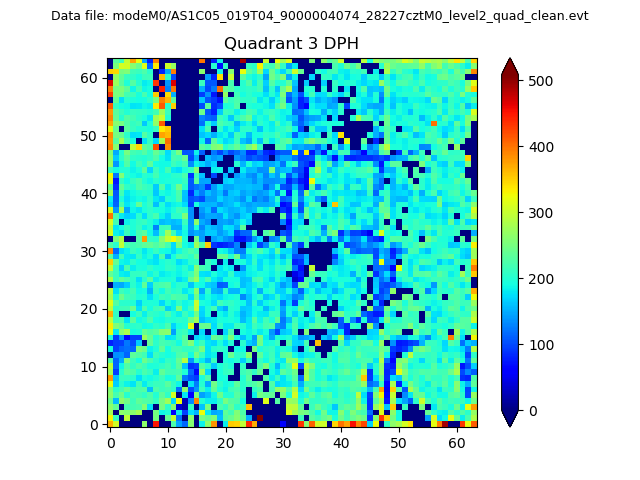 |
 |
Quadrant C |
| Plot type | Count rate plots | Images |
|---|---|---|
| Comparison with Poisson distribution Blue bars denote a histogram of data divided into 1 sec bins. Red curve is a Poisson curve with rate = median count rate of data. |
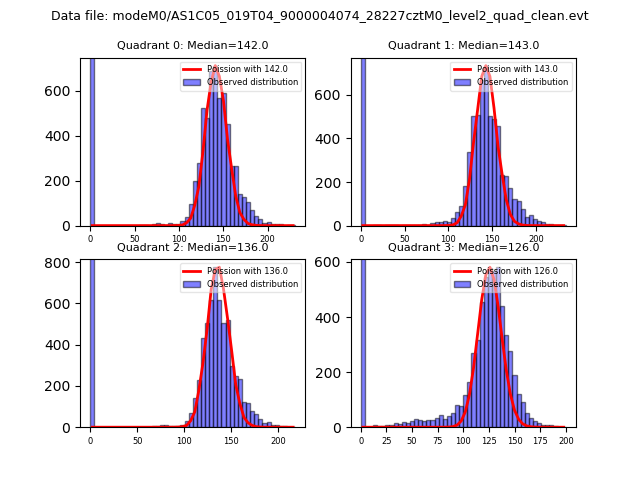 |
 |
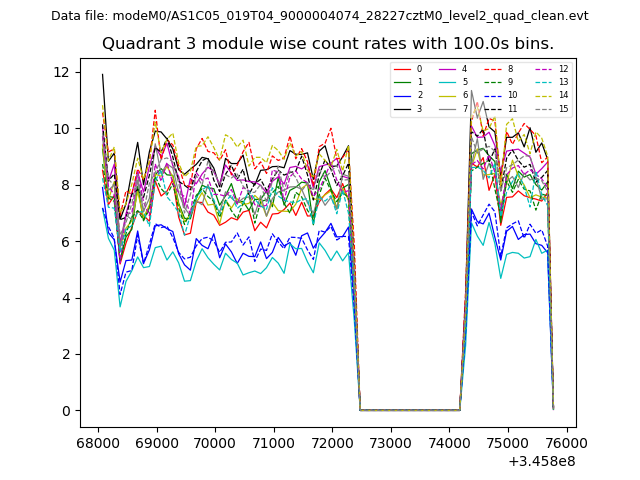
| Quadrant-wise count rates Data is divided into 100 sec bins |
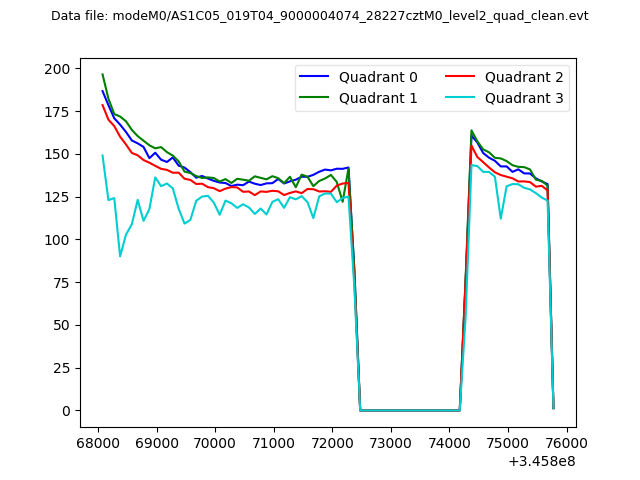 |
|
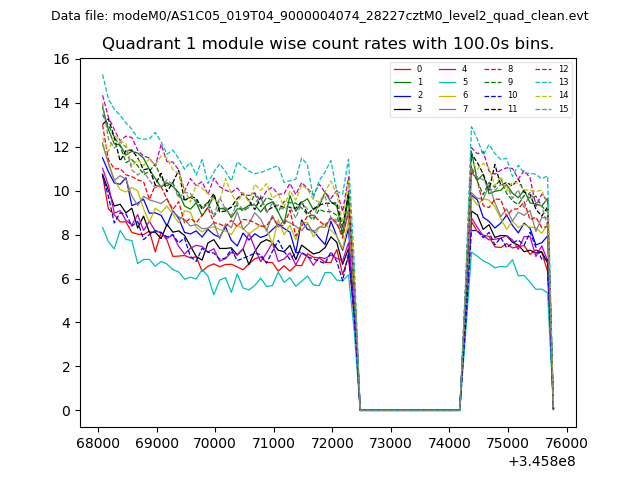
| Module-wise count rates for Quadrant A Data is divided into 100 sec bins |
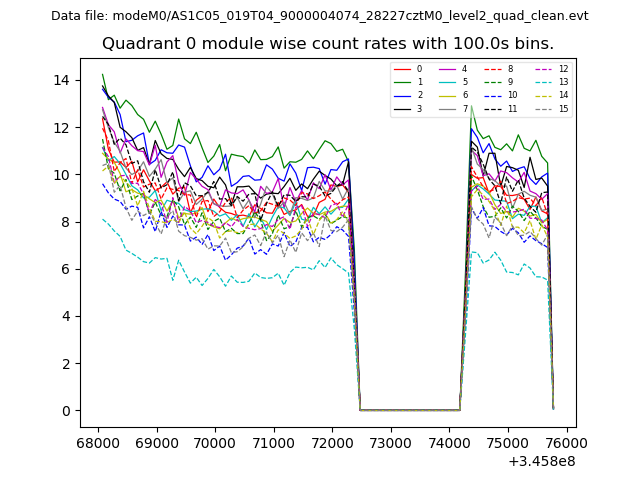 |
 |
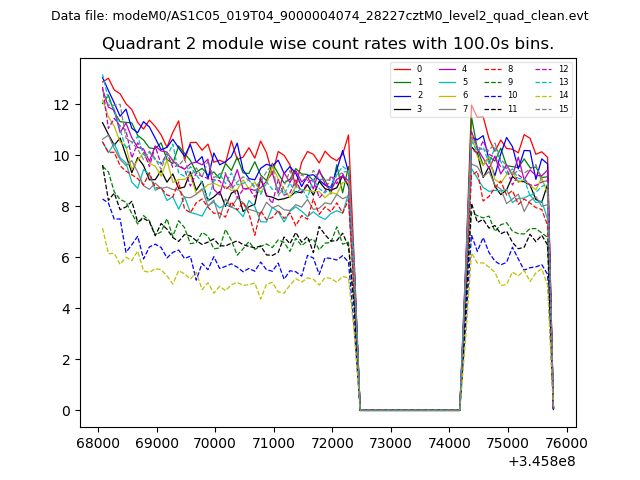
| Module-wise count rates for Quadrant B Data is divided into 100 sec bins |
 |
 |
| Module-wise count rates for Quadrant C Data is divided into 100 sec bins |
 |
 |
| Module-wise count rates for Quadrant D Data is divided into 100 sec bins |
 |
 |
| Parameter | Plot |
|---|---|
| CZT HV Monitor | 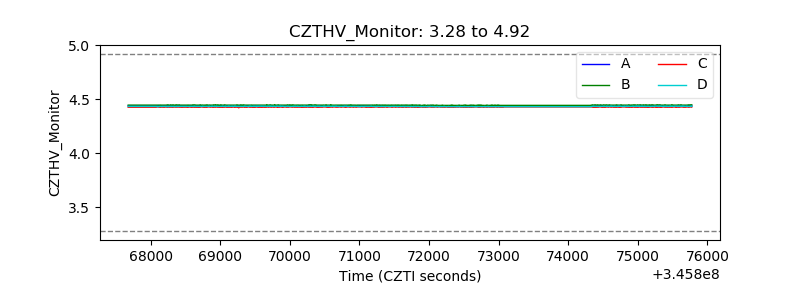 |
| D_VDD | 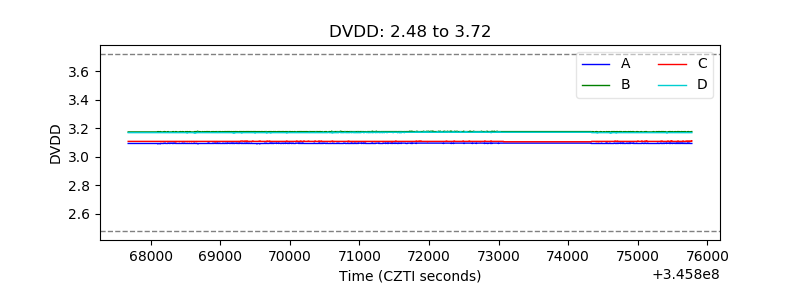 |
| Temperature 1 | 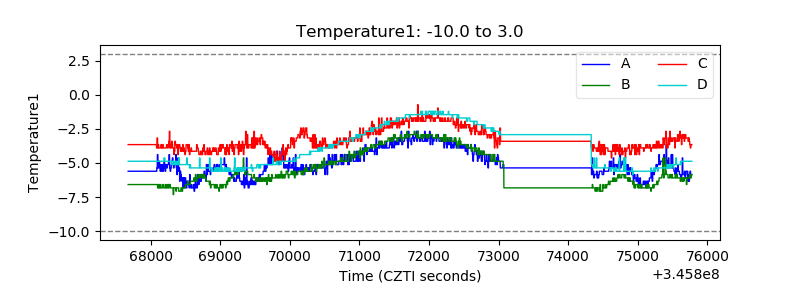 |
| Veto HV Monitor |  |
| Veto LLD | 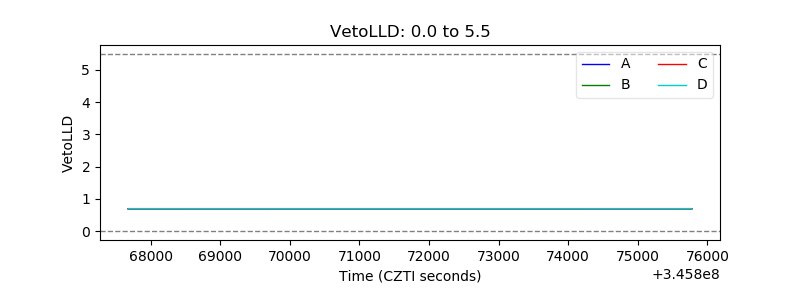 |
| Alpha Counter | 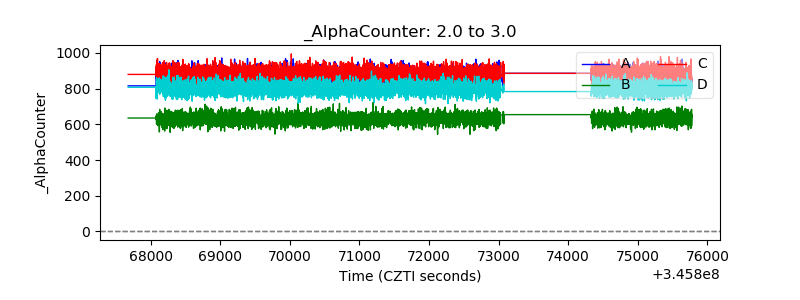 |
| _CPM_Rate | 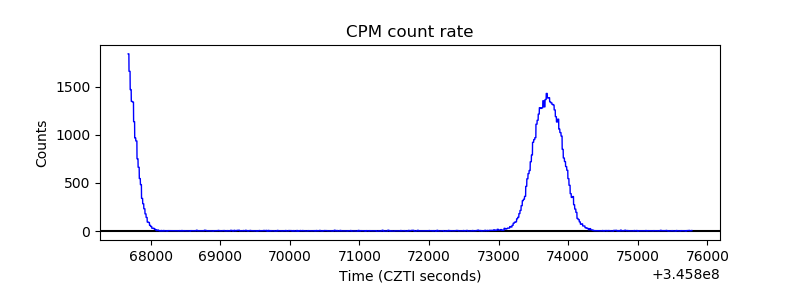 |
| CZT Counter | 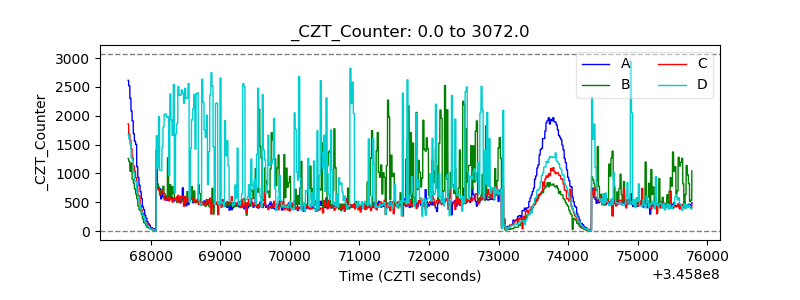 |
| +2.5 Volts monitor | 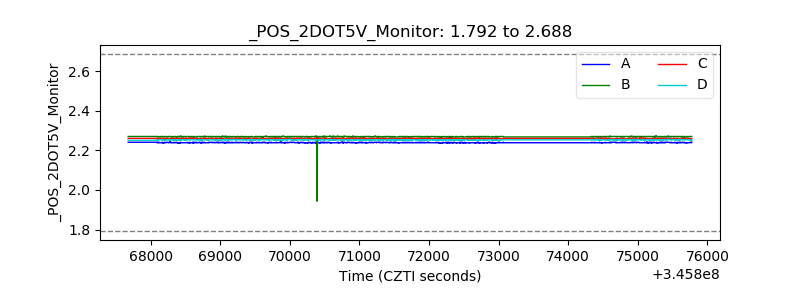 |
| +5 Volts monitor |  |
| _ROLL_ROT | 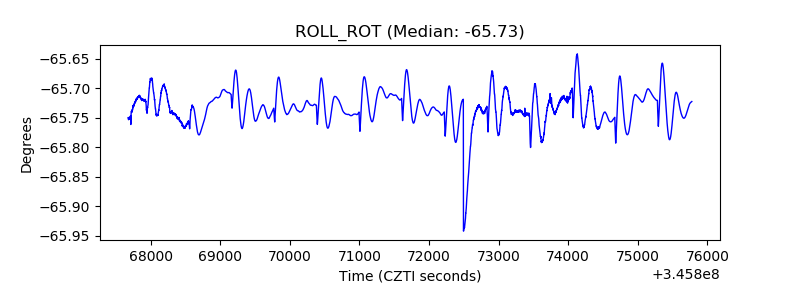 |
| _Roll_DEC | 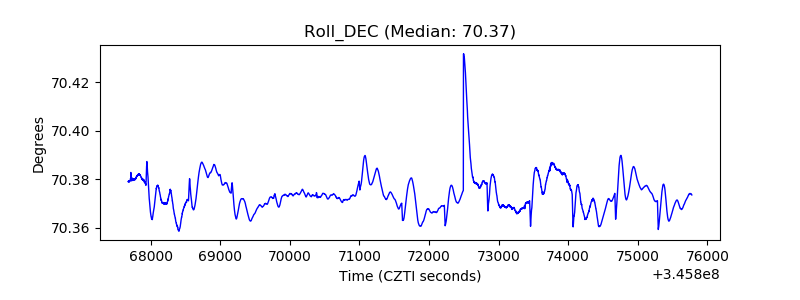 |
| _Roll_RA | 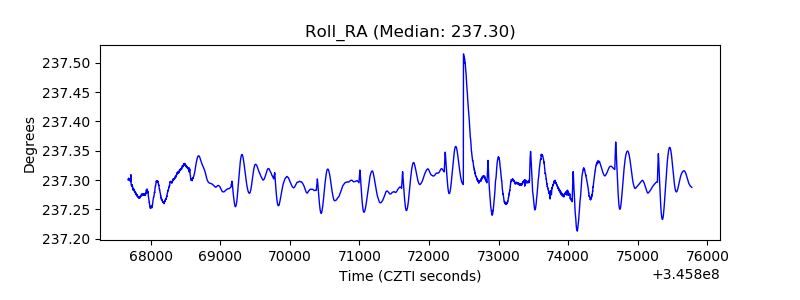 |
| Veto Counter | 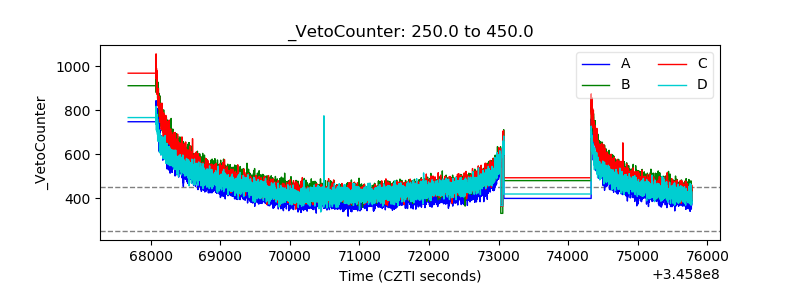 |