| Param | Original file | Final file |
|---|---|---|
| Filename | modeM0/AS1C05_019T04_9000004074_28230cztM0_level2.evt | modeM0/AS1C05_019T04_9000004074_28230cztM0_level2_quad_clean.evt |
| Size (bytes) | 1,342,762,560 | 259,378,560 |
| Size | 1.3 GB | 247.4 MB |
| Events in quadrant A | 7,938,021 | 1,726,446 |
| Events in quadrant B | 10,006,542 | 1,743,914 |
| Events in quadrant C | 8,093,755 | 1,657,662 |
| Events in quadrant D | 13,469,431 | 1,545,572 |
| Mode M9 | |||
|---|---|---|---|
| Quadrant | BADHDUFLAG | Total packets | Discarded packets |
| A | 0 | 18 | 0 |
| B | 0 | 18 | 0 |
| C | 0 | 18 | 0 |
| D | 0 | 18 | 0 |
| Mode M0 | |||
|---|---|---|---|
| Quadrant | BADHDUFLAG | Total packets | Discarded packets |
| A | 0 | 35223 | 0 |
| B | 0 | 41117 | 0 |
| C | 0 | 35367 | 0 |
| D | 0 | 51887 | 0 |
| Quadrant | Total seconds | Saturated seconds | Saturation percentage |
|---|---|---|---|
| A | 17137 | 195 | 1.137889% |
| B | 17137 | 366 | 2.135730% |
| C | 17136 | 234 | 1.365546% |
| D | 17138 | 1419 | 8.279846% |
Noise dominated data is calculated using 1-second bins in cleaned event files. If a bin has >2000 counts, and if more than 50% of those come from <1% of pixels, then it is considered to be noise-dominated and hence unusable.
| Quadrant | # 1 sec bins | Bins with >0 counts | Bins with >2000 counts | High rate bins dominated by noise | Noise dominated (total time) | Noise dominated (detector-on time) | Marked lightcurve |
|---|---|---|---|---|---|---|---|
| A | 19057 | 17139 | 1 | 1 | 0.01% | 0.01% | 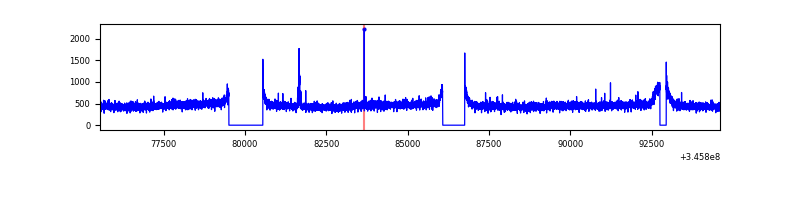 |
| B | 19057 | 17139 | 64 | 64 | 0.34% | 0.37% | 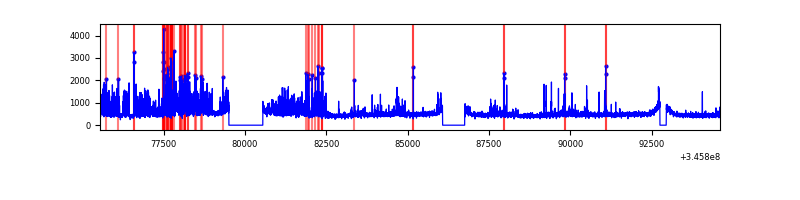 |
| C | 19057 | 17140 | 0 | 0 | 0.00% | 0.00% | 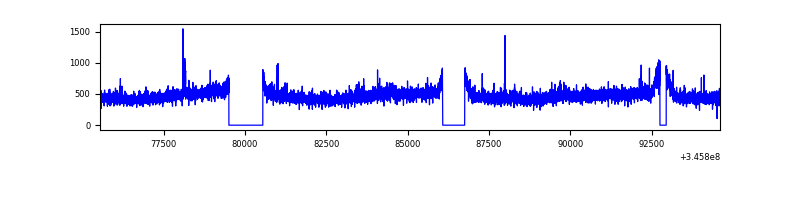 |
| D | 19058 | 17140 | 1239 | 1239 | 6.50% | 7.23% | 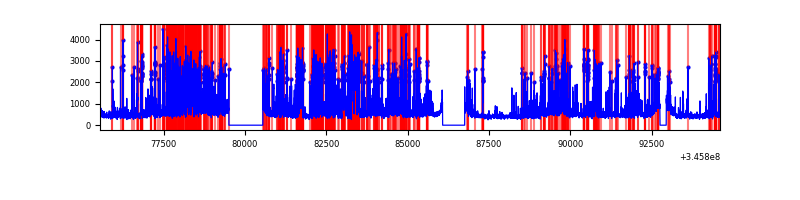 |
Top three noisy pixels from each quadrant. If the there are fewer than three noisy pixels in the level2.evt file, extra rows are filled as -1
| Pixel properties | Quadrant properties | ||||||
|---|---|---|---|---|---|---|---|
| Quadrant | DetID | PixID | Counts | Sigma | Mean | Median | Sigma |
| A | 6 | 16 | 48527 | 114.41 | 2041 | 2000 | 406.7 |
| A | 13 | 254 | 23990 | 54.07 | 2041 | 2000 | 406.7 |
| A | 3 | 137 | 20083 | 44.47 | 2041 | 2000 | 406.7 |
| B | 5 | 255 | 1897282 | 5024.92 | 2011 | 1957 | 377.2 |
| B | 0 | 183 | 62602 | 160.78 | 2011 | 1957 | 377.2 |
| B | 10 | 245 | 55483 | 141.91 | 2011 | 1957 | 377.2 |
| C | 14 | 238 | 316666 | 703.48 | 1937 | 1946 | 447.4 |
| C | 3 | 233 | 160690 | 354.83 | 1937 | 1946 | 447.4 |
| C | 5 | 37 | 43879 | 93.73 | 1937 | 1946 | 447.4 |
| D | 1 | 52 | 4842228 | 10830.11 | 1897 | 1844 | 446.9 |
| D | 8 | 195 | 401071 | 893.25 | 1897 | 1844 | 446.9 |
| D | 7 | 80 | 376276 | 837.77 | 1897 | 1844 | 446.9 |
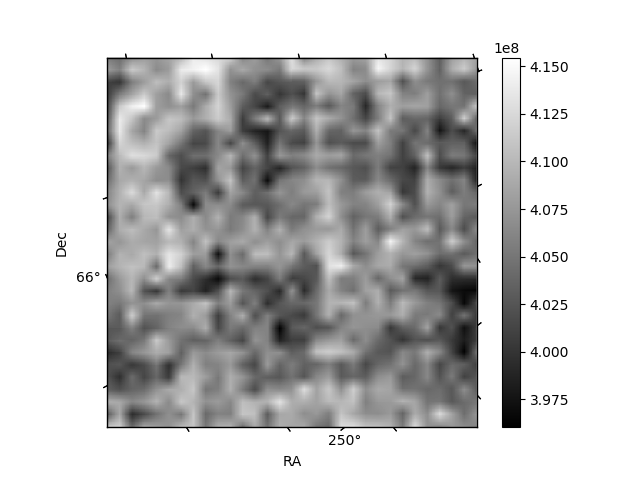
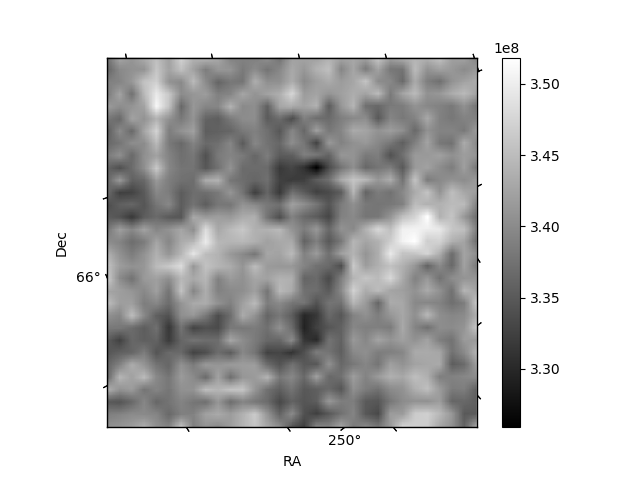
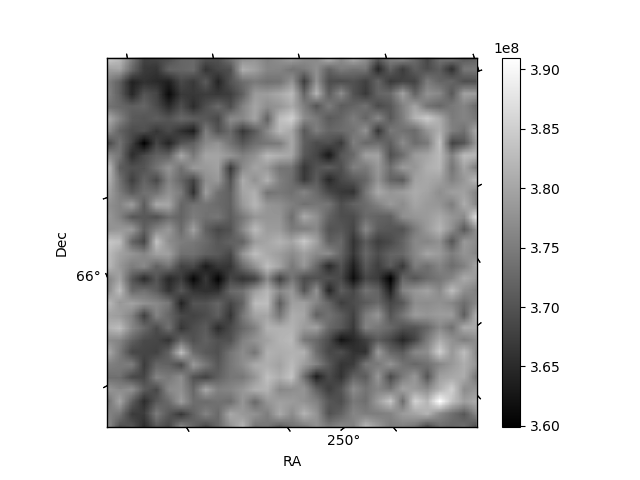
Histogram calculated using DETX and DETY for each event in the final _common_clean file
| Quadrant A | 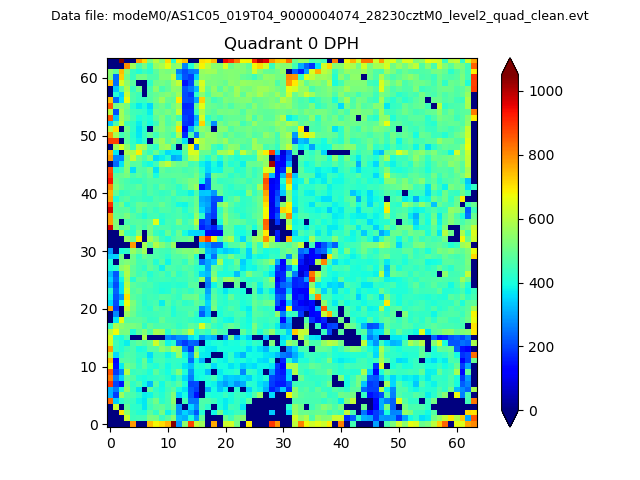 |
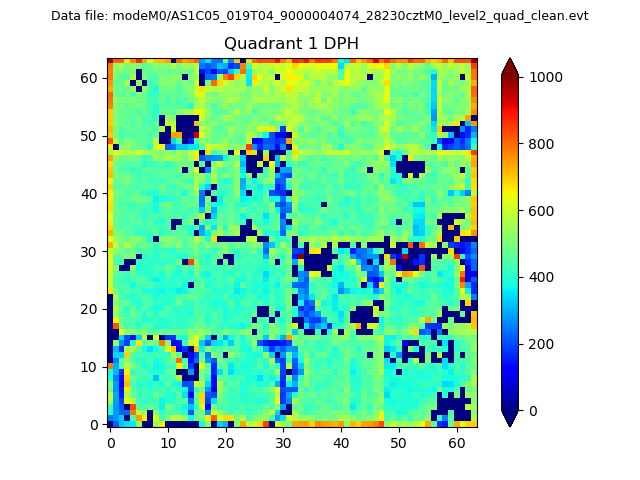 |
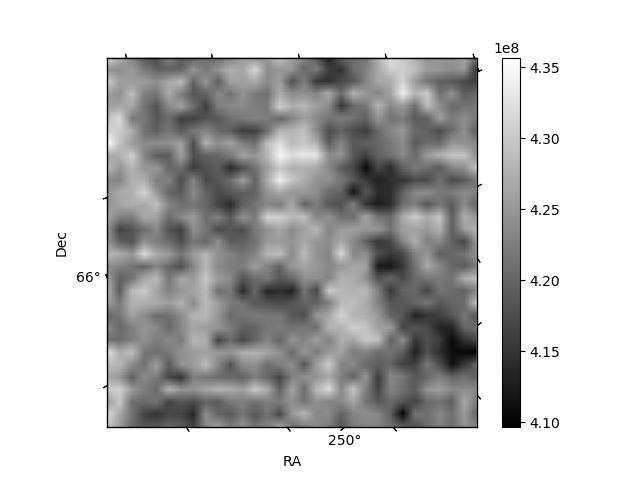
Quadrant B |
|---|---|---|---|
| Quadrant D |  |
 |
Quadrant C |
| Plot type | Count rate plots | Images |
|---|---|---|
| Comparison with Poisson distribution Blue bars denote a histogram of data divided into 1 sec bins. Red curve is a Poisson curve with rate = median count rate of data. |
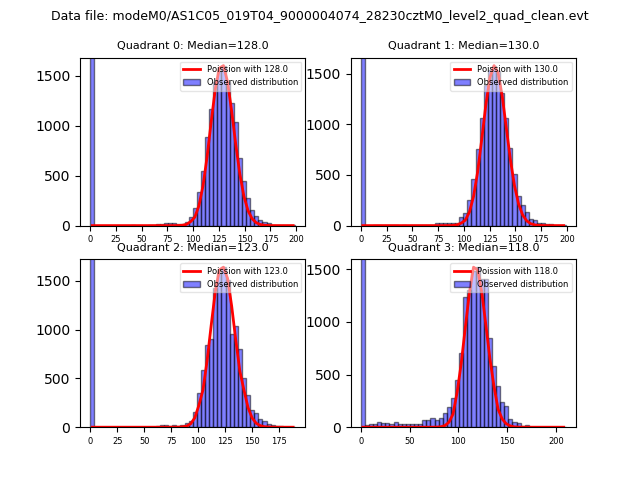 |
 |
| Quadrant-wise count rates Data is divided into 100 sec bins |
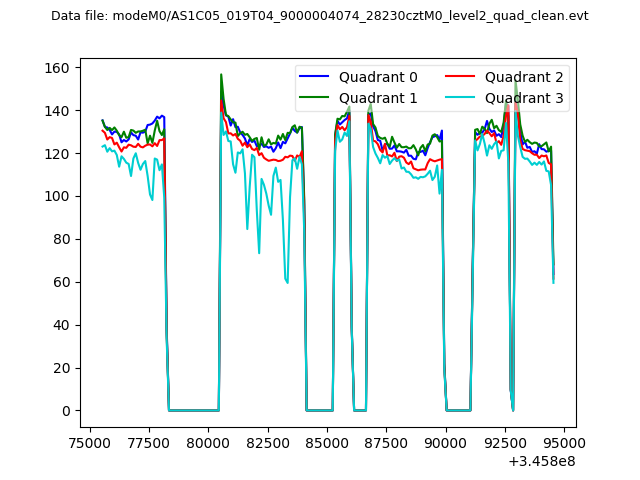 |
|
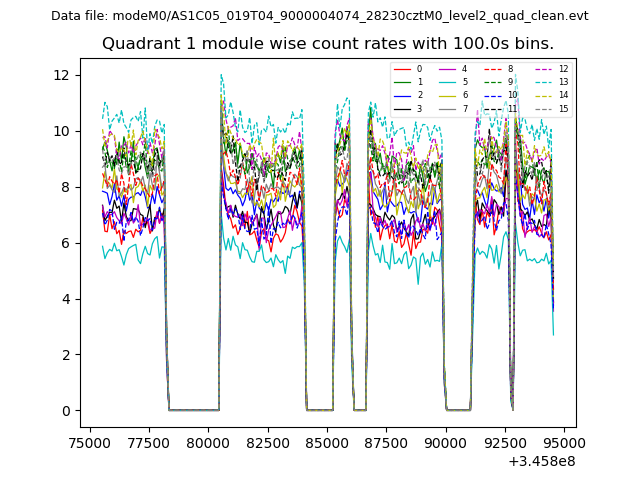
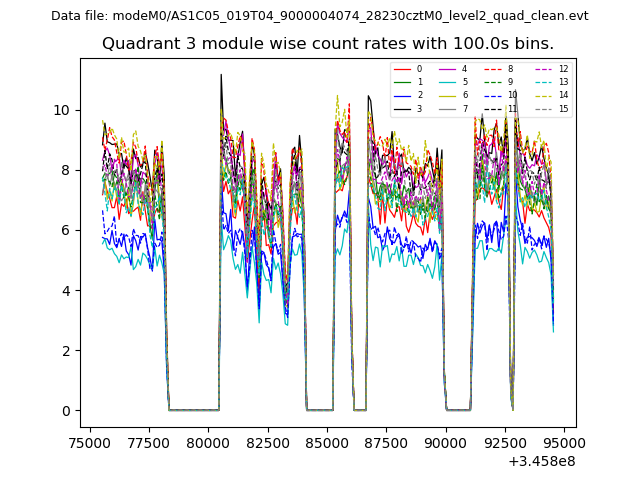
| Module-wise count rates for Quadrant A Data is divided into 100 sec bins |
 |
 |
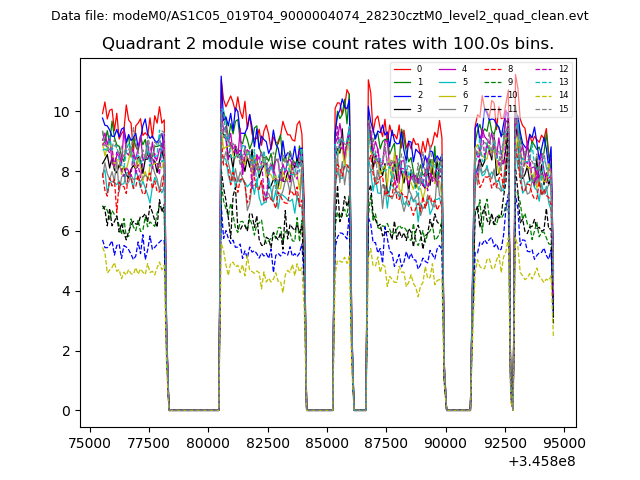
| Module-wise count rates for Quadrant B Data is divided into 100 sec bins |
 |
 |
| Module-wise count rates for Quadrant C Data is divided into 100 sec bins |
 |
 |
| Module-wise count rates for Quadrant D Data is divided into 100 sec bins |
 |
 |
| Parameter | Plot |
|---|---|
| CZT HV Monitor | 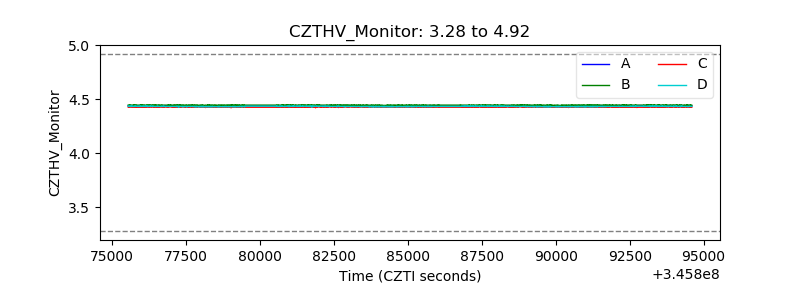 |
| D_VDD | 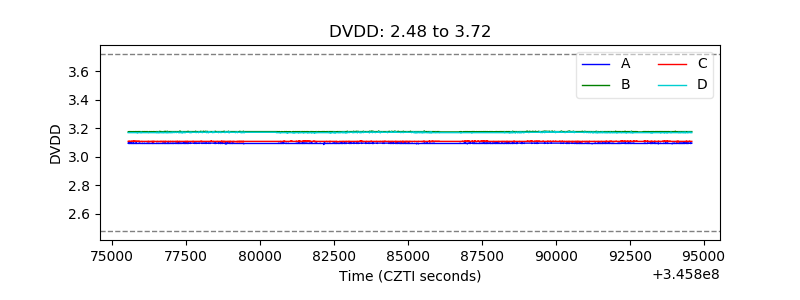 |
| Temperature 1 | 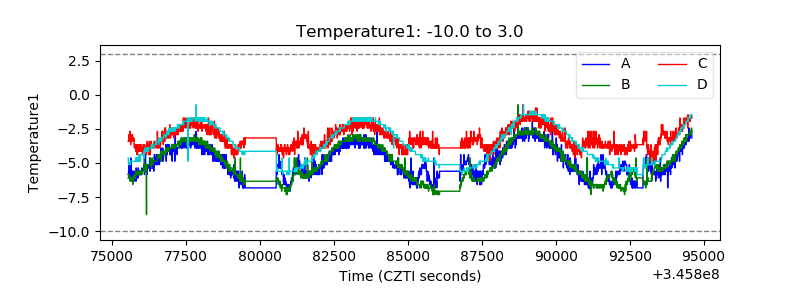 |
| Veto HV Monitor | 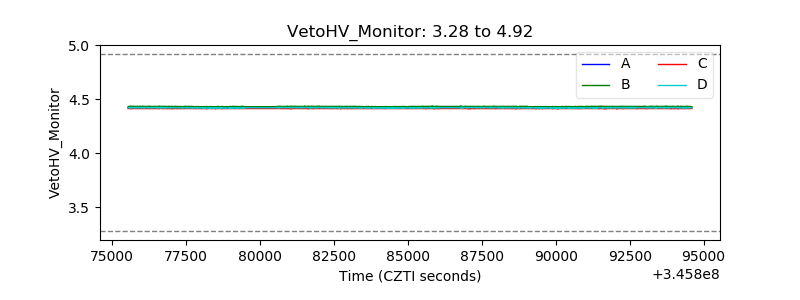 |
| Veto LLD | 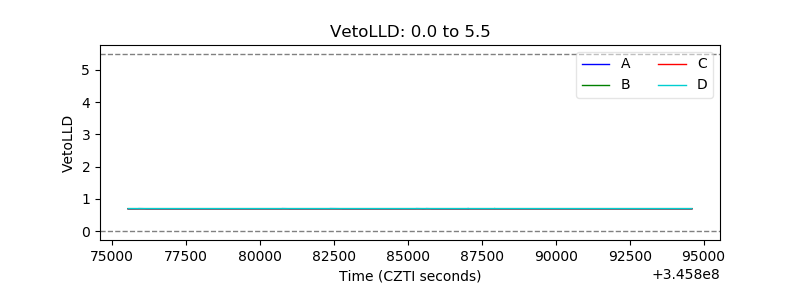 |
| Alpha Counter | 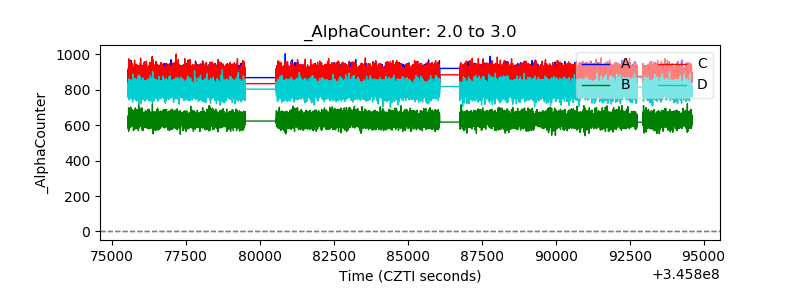 |
| _CPM_Rate | 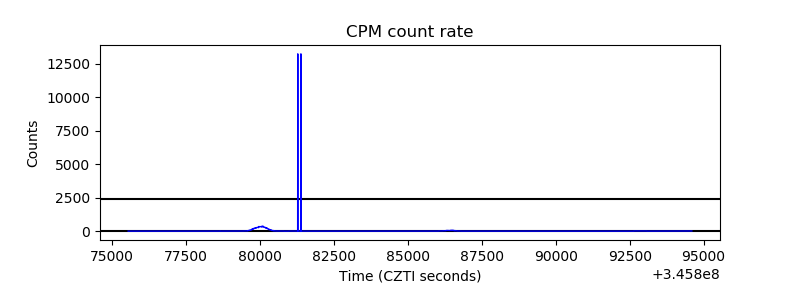 |
| CZT Counter |  |
| +2.5 Volts monitor |  |
| +5 Volts monitor | 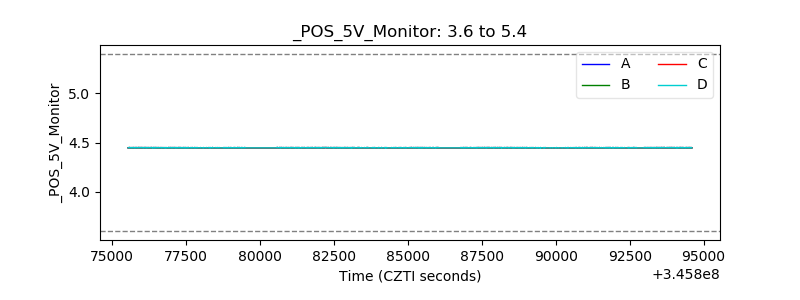 |
| _ROLL_ROT | 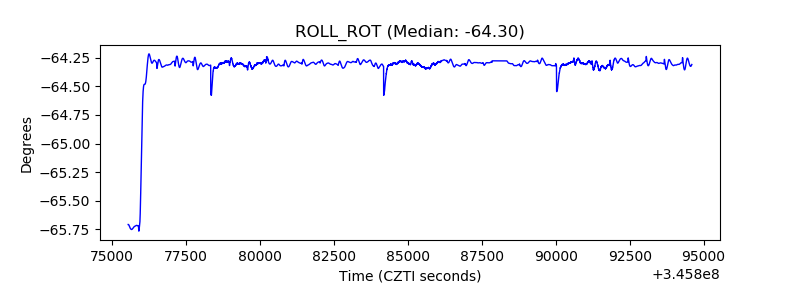 |
| _Roll_DEC | 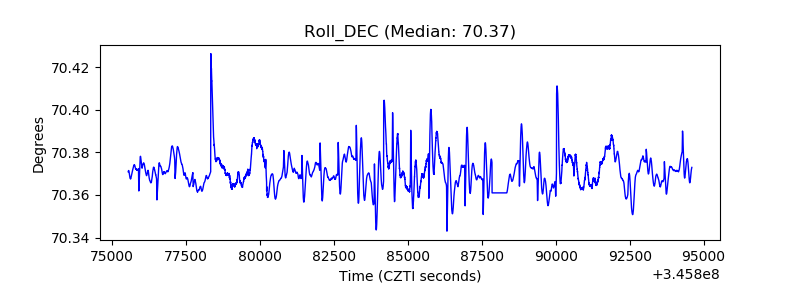 |
| _Roll_RA |  |
| Veto Counter | 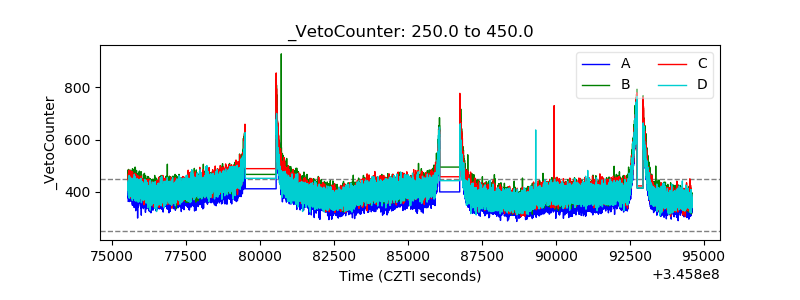 |