| Param | Original file | Final file |
|---|---|---|
| Filename | modeM0/AS1C05_019T04_9000004074_28231cztM0_level2.evt | modeM0/AS1C05_019T04_9000004074_28231cztM0_level2_quad_clean.evt |
| Size (bytes) | 525,090,240 | 116,271,360 |
| Size | 500.8 MB | 110.9 MB |
| Events in quadrant A | 3,342,123 | 768,284 |
| Events in quadrant B | 3,633,642 | 780,713 |
| Events in quadrant C | 3,545,771 | 740,334 |
| Events in quadrant D | 4,879,281 | 717,838 |
| Mode M9 | |||
|---|---|---|---|
| Quadrant | BADHDUFLAG | Total packets | Discarded packets |
| A | 0 | 1 | 0 |
| B | 0 | 1 | 0 |
| C | 0 | 1 | 0 |
| D | 0 | 1 | 0 |
| Mode M0 | |||
|---|---|---|---|
| Quadrant | BADHDUFLAG | Total packets | Discarded packets |
| A | 0 | 15046 | 0 |
| B | 0 | 15710 | 0 |
| C | 0 | 15356 | 0 |
| D | 0 | 19513 | 0 |
| Quadrant | Total seconds | Saturated seconds | Saturation percentage |
|---|---|---|---|
| A | 7378 | 74 | 1.002982% |
| B | 7379 | 120 | 1.626237% |
| C | 7379 | 150 | 2.032796% |
| D | 7379 | 175 | 2.371595% |
Noise dominated data is calculated using 1-second bins in cleaned event files. If a bin has >2000 counts, and if more than 50% of those come from <1% of pixels, then it is considered to be noise-dominated and hence unusable.
| Quadrant | # 1 sec bins | Bins with >0 counts | Bins with >2000 counts | High rate bins dominated by noise | Noise dominated (total time) | Noise dominated (detector-on time) | Marked lightcurve |
|---|---|---|---|---|---|---|---|
| A | 7573 | 7379 | 0 | 0 | 0.00% | 0.00% | 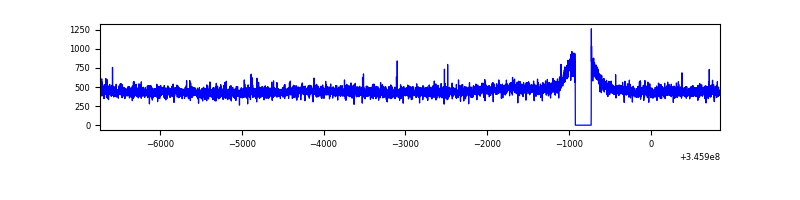 |
| B | 7574 | 7380 | 28 | 28 | 0.37% | 0.38% | 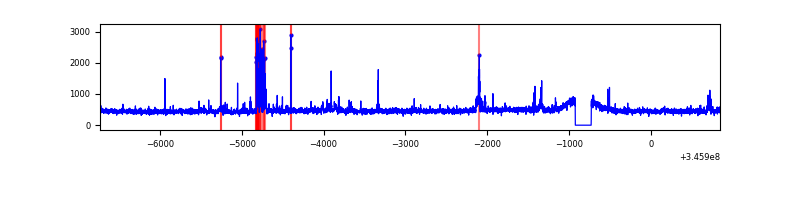 |
| C | 7574 | 7380 | 17 | 17 | 0.22% | 0.23% | 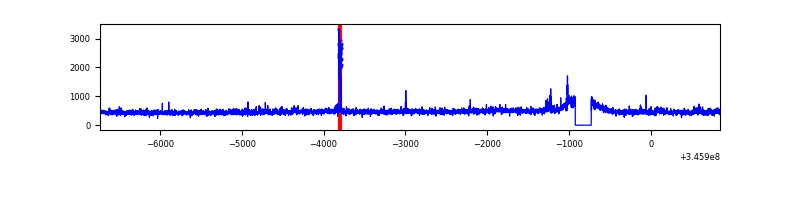 |
| D | 7574 | 7380 | 117 | 117 | 1.54% | 1.59% | 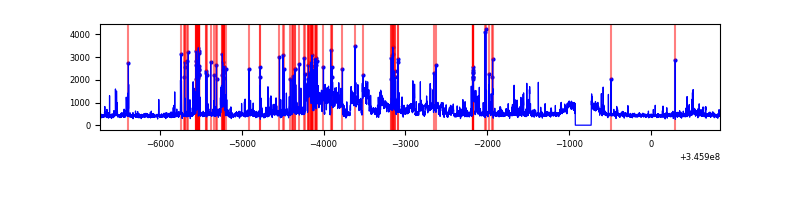 |
Top three noisy pixels from each quadrant. If the there are fewer than three noisy pixels in the level2.evt file, extra rows are filled as -1
| Pixel properties | Quadrant properties | ||||||
|---|---|---|---|---|---|---|---|
| Quadrant | DetID | PixID | Counts | Sigma | Mean | Median | Sigma |
| A | 13 | 254 | 11703 | 62.18 | 865 | 846 | 174.6 |
| A | 3 | 137 | 8702 | 45.0 | 865 | 846 | 174.6 |
| A | 0 | 226 | 7340 | 37.2 | 865 | 846 | 174.6 |
| B | 10 | 245 | 184651 | 1118.85 | 855 | 833 | 164.3 |
| B | 4 | 200 | 30383 | 179.86 | 855 | 833 | 164.3 |
| B | 0 | 183 | 26496 | 156.2 | 855 | 833 | 164.3 |
| C | 3 | 233 | 203250 | 1057.58 | 819 | 822 | 191.4 |
| C | 14 | 238 | 132396 | 687.41 | 819 | 822 | 191.4 |
| C | 5 | 37 | 15528 | 76.83 | 819 | 822 | 191.4 |
| D | 1 | 52 | 1245491 | 6368.28 | 824 | 801 | 195.5 |
| D | 8 | 195 | 184922 | 942.03 | 824 | 801 | 195.5 |
| D | 5 | 222 | 161339 | 821.37 | 824 | 801 | 195.5 |
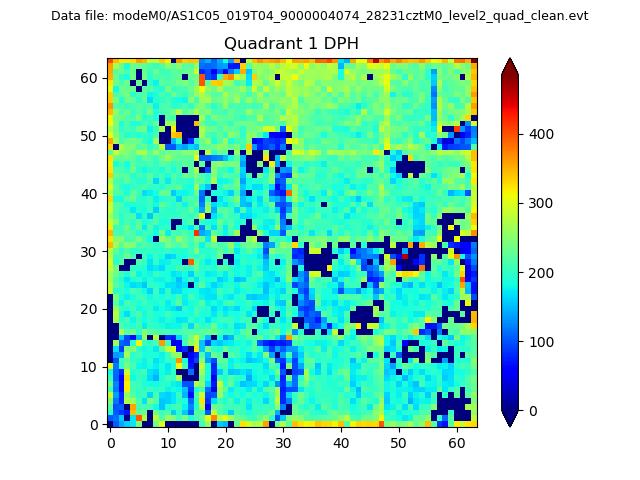
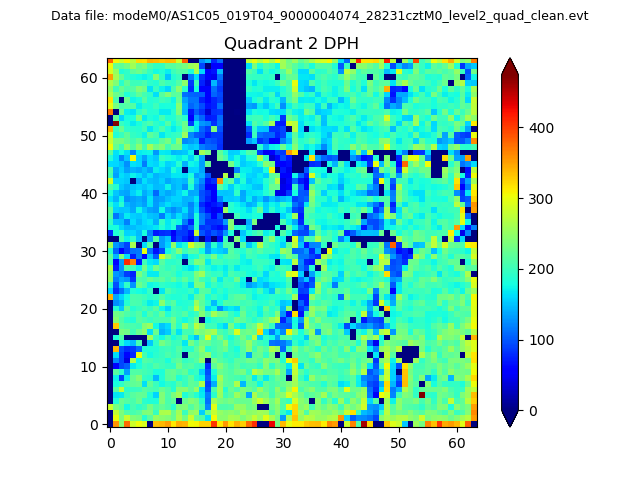
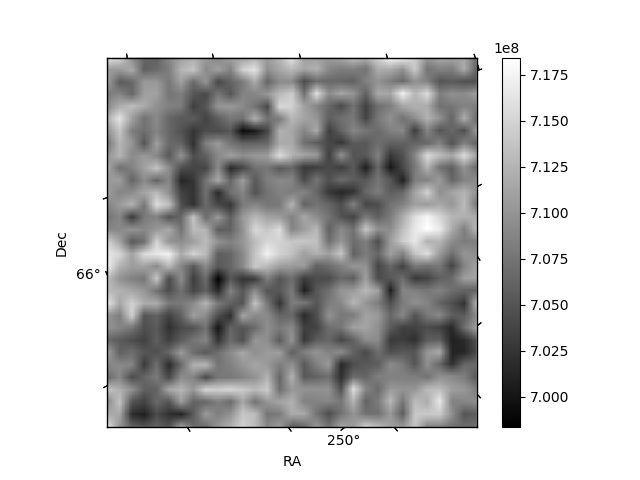
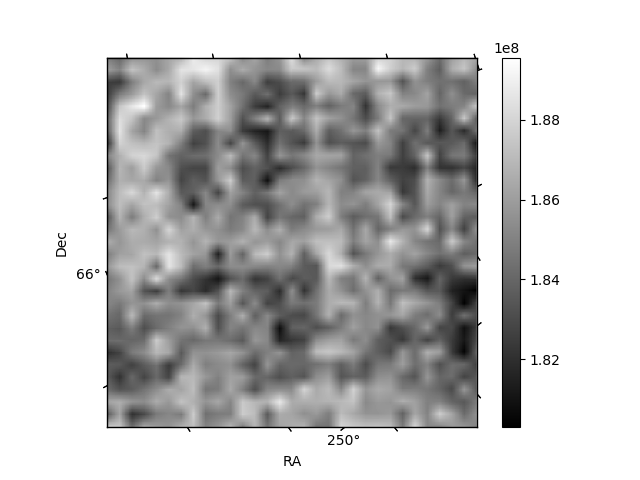
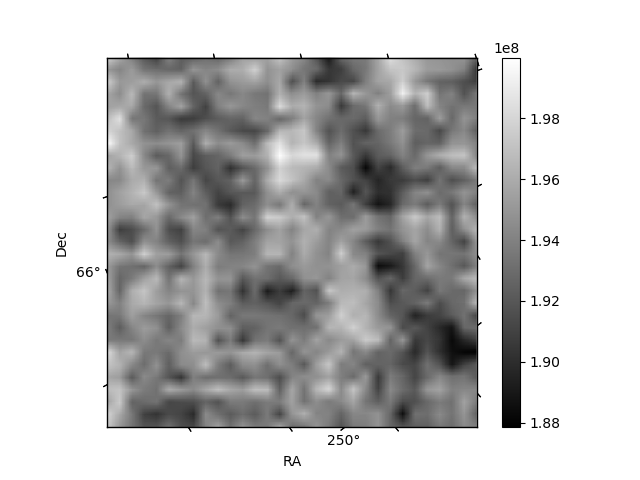
Histogram calculated using DETX and DETY for each event in the final _common_clean file
| Quadrant A |  |
 |
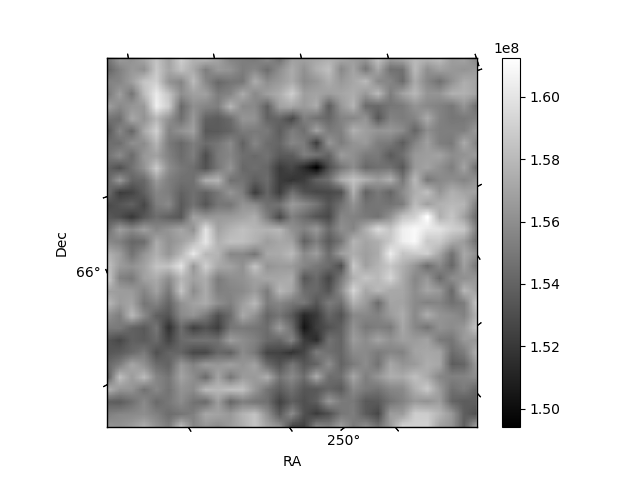
Quadrant B |
|---|---|---|---|
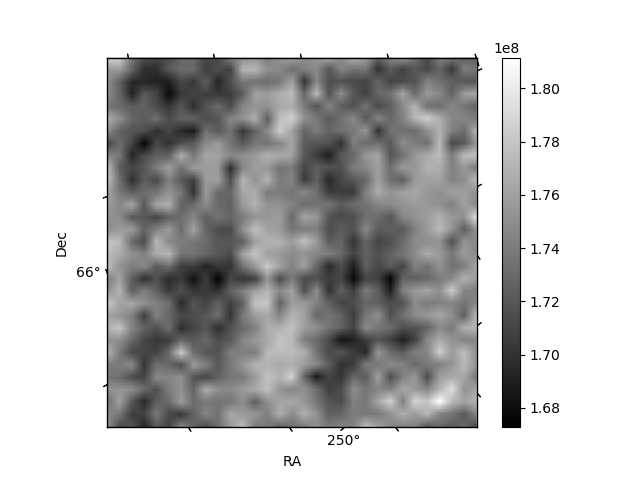
| Quadrant D | 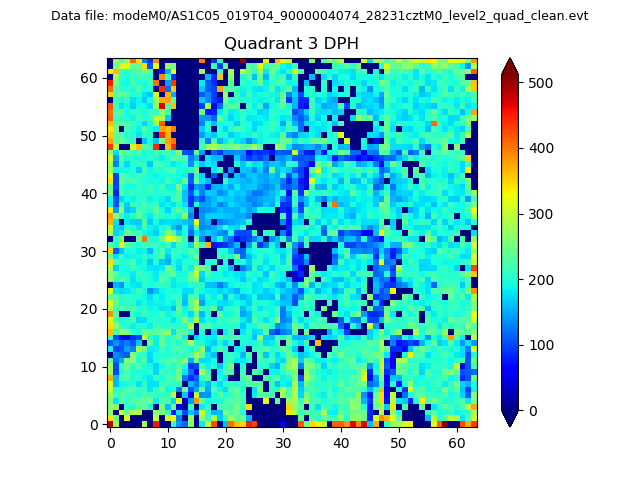 |
 |
Quadrant C |
| Plot type | Count rate plots | Images |
|---|---|---|
| Comparison with Poisson distribution Blue bars denote a histogram of data divided into 1 sec bins. Red curve is a Poisson curve with rate = median count rate of data. |
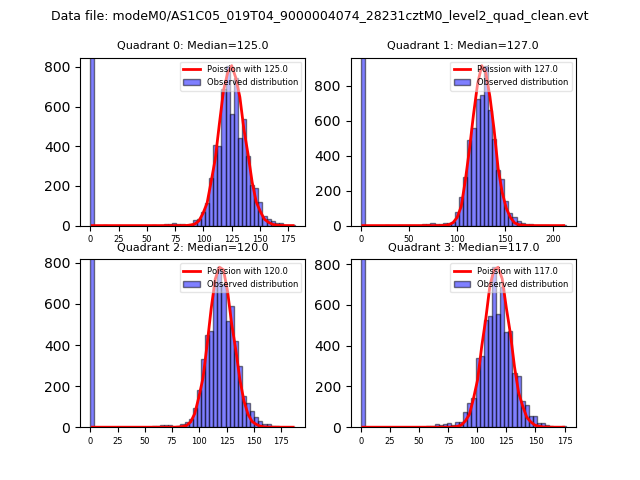 |
 |
| Quadrant-wise count rates Data is divided into 100 sec bins |
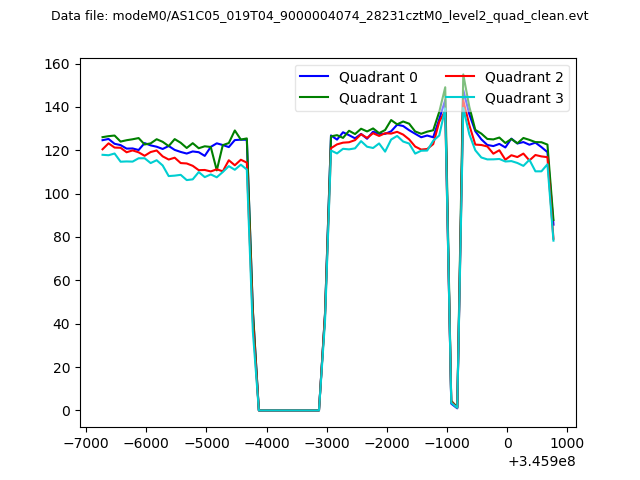 |
|
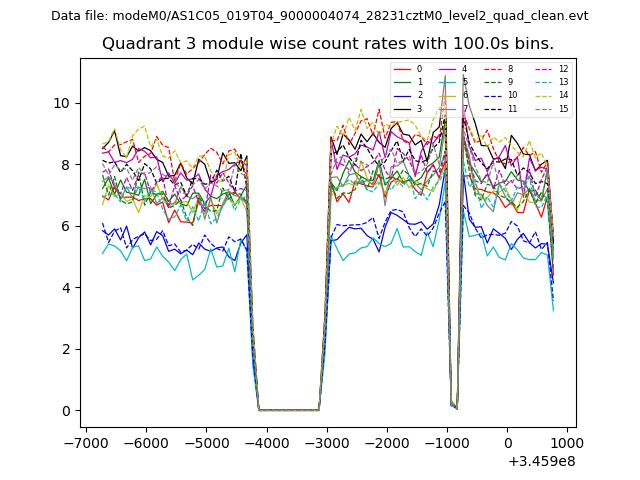
| Module-wise count rates for Quadrant A Data is divided into 100 sec bins |
 |
 |
| Module-wise count rates for Quadrant B Data is divided into 100 sec bins |
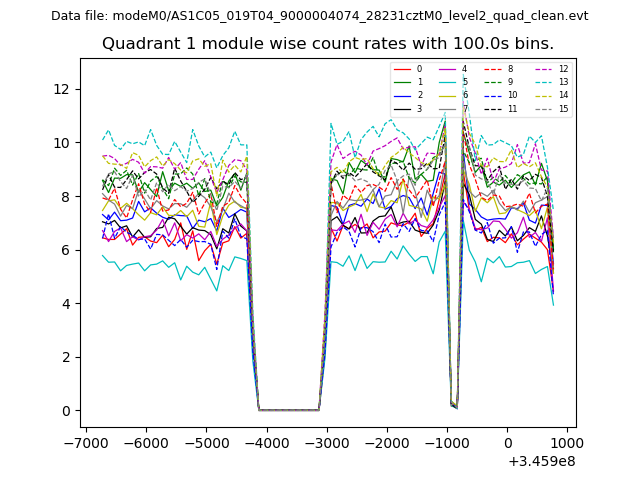 |
 |
| Module-wise count rates for Quadrant C Data is divided into 100 sec bins |
 |
 |
| Module-wise count rates for Quadrant D Data is divided into 100 sec bins |
 |
 |
| Parameter | Plot |
|---|---|
| CZT HV Monitor | 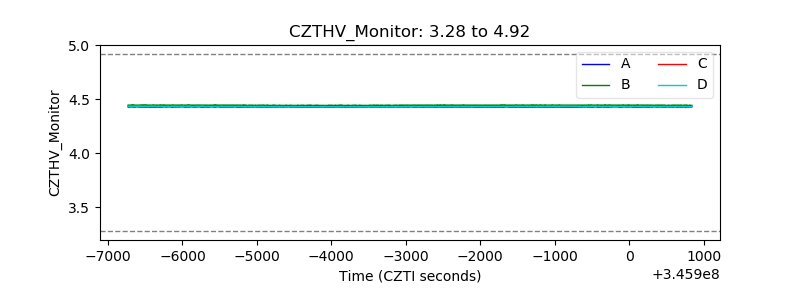 |
| D_VDD | 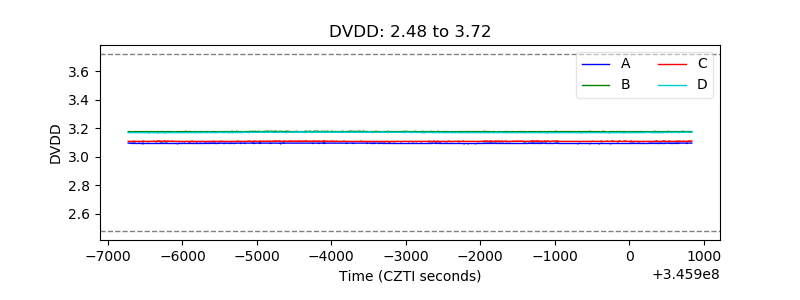 |
| Temperature 1 | 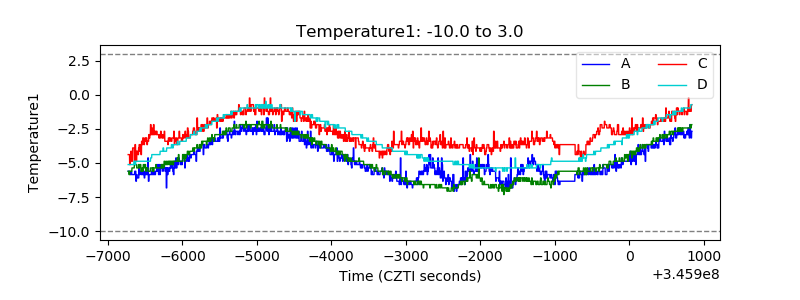 |
| Veto HV Monitor | 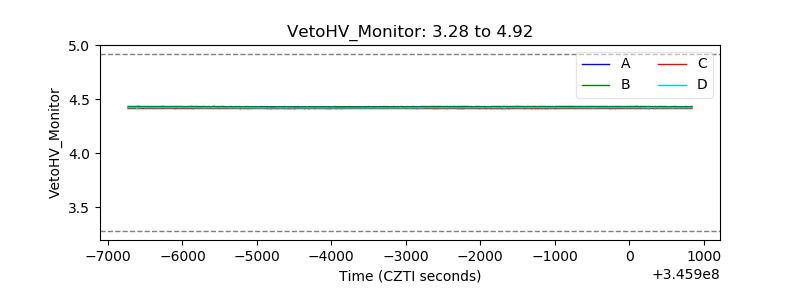 |
| Veto LLD | 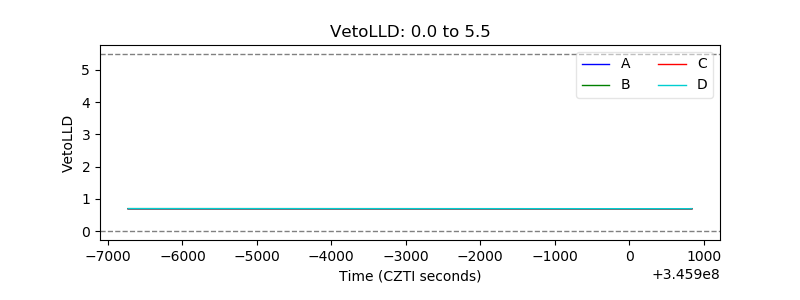 |
| Alpha Counter |  |
| _CPM_Rate | 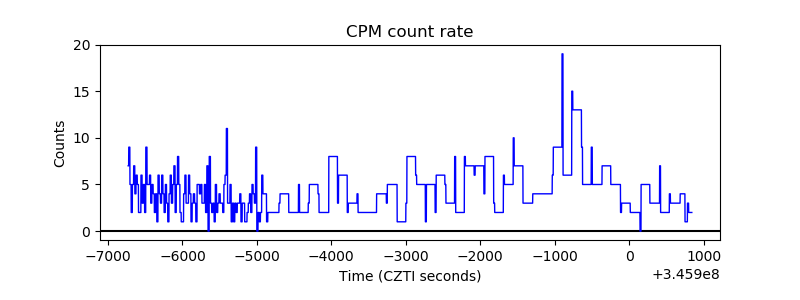 |
| CZT Counter | 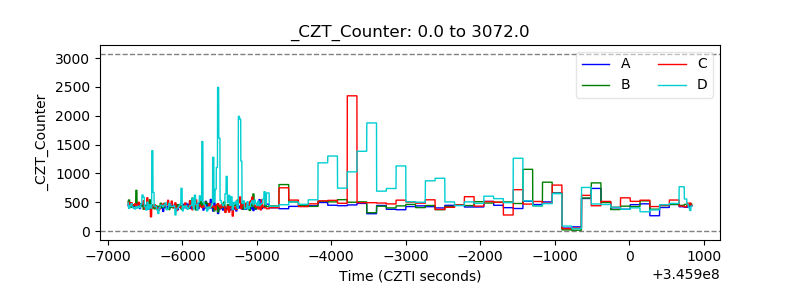 |
| +2.5 Volts monitor |  |
| +5 Volts monitor |  |
| _ROLL_ROT | 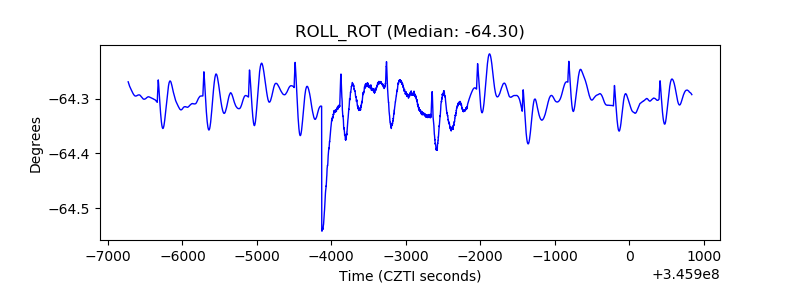 |
| _Roll_DEC | 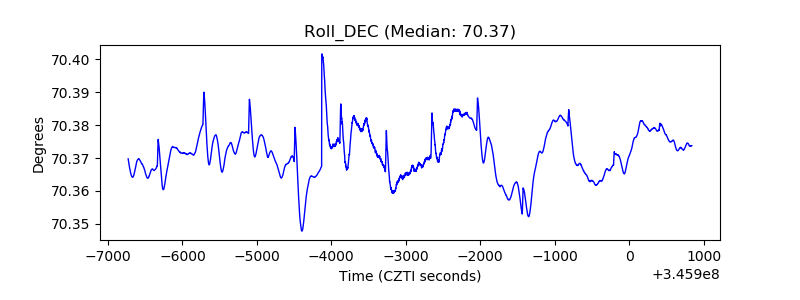 |
| _Roll_RA | 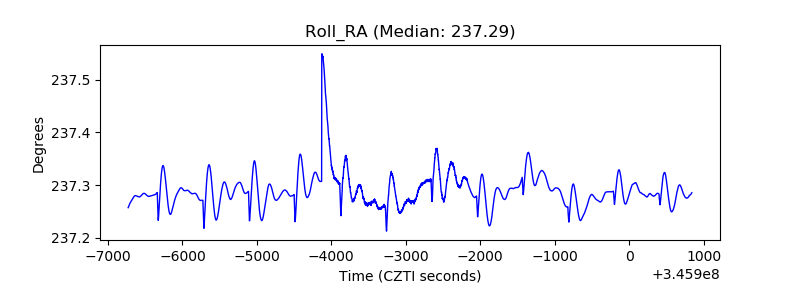 |
| Veto Counter | 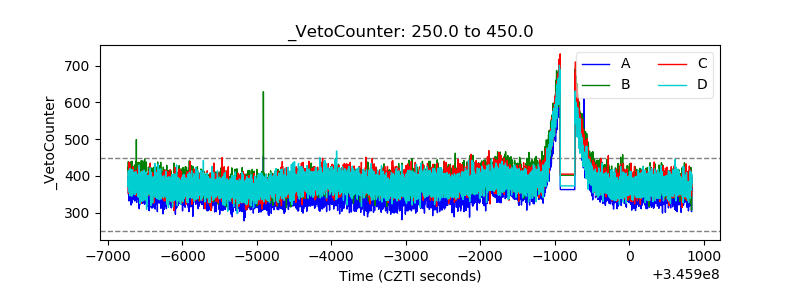 |