| Param | Original file | Final file |
|---|---|---|
| Filename | modeM0/AS1C05_019T04_9000004074_28232cztM0_level2.evt | modeM0/AS1C05_019T04_9000004074_28232cztM0_level2_quad_clean.evt |
| Size (bytes) | 486,941,760 | 113,708,160 |
| Size | 464.4 MB | 108.4 MB |
| Events in quadrant A | 3,278,010 | 753,131 |
| Events in quadrant B | 3,524,413 | 761,889 |
| Events in quadrant C | 3,649,772 | 718,406 |
| Events in quadrant D | 3,801,780 | 705,256 |
| Mode M9 | |||
|---|---|---|---|
| Quadrant | BADHDUFLAG | Total packets | Discarded packets |
| A | 0 | 4 | 0 |
| B | 0 | 4 | 0 |
| C | 0 | 4 | 0 |
| D | 0 | 4 | 0 |
| Mode M0 | |||
|---|---|---|---|
| Quadrant | BADHDUFLAG | Total packets | Discarded packets |
| A | 0 | 14703 | 0 |
| B | 0 | 15194 | 0 |
| C | 0 | 15399 | 0 |
| D | 0 | 16244 | 0 |
| Quadrant | Total seconds | Saturated seconds | Saturation percentage |
|---|---|---|---|
| A | 7252 | 63 | 0.868726% |
| B | 7253 | 88 | 1.213291% |
| C | 7252 | 135 | 1.861555% |
| D | 7252 | 128 | 1.765030% |
Noise dominated data is calculated using 1-second bins in cleaned event files. If a bin has >2000 counts, and if more than 50% of those come from <1% of pixels, then it is considered to be noise-dominated and hence unusable.
| Quadrant | # 1 sec bins | Bins with >0 counts | Bins with >2000 counts | High rate bins dominated by noise | Noise dominated (total time) | Noise dominated (detector-on time) | Marked lightcurve |
|---|---|---|---|---|---|---|---|
| A | 7632 | 7252 | 0 | 0 | 0.00% | 0.00% |  |
| B | 7633 | 7253 | 14 | 14 | 0.18% | 0.19% |  |
| C | 7632 | 7252 | 5 | 5 | 0.07% | 0.07% |  |
| D | 7632 | 7252 | 81 | 81 | 1.06% | 1.12% |  |
Top three noisy pixels from each quadrant. If the there are fewer than three noisy pixels in the level2.evt file, extra rows are filled as -1
| Pixel properties | Quadrant properties | ||||||
|---|---|---|---|---|---|---|---|
| Quadrant | DetID | PixID | Counts | Sigma | Mean | Median | Sigma |
| A | 13 | 254 | 11302 | 61.45 | 848 | 829 | 170.4 |
| A | 3 | 137 | 8551 | 45.31 | 848 | 829 | 170.4 |
| A | 0 | 226 | 7120 | 36.91 | 848 | 829 | 170.4 |
| B | 10 | 245 | 135483 | 833.77 | 837 | 815 | 161.5 |
| B | 0 | 183 | 45859 | 278.88 | 837 | 815 | 161.5 |
| B | 0 | 230 | 25358 | 151.95 | 837 | 815 | 161.5 |
| C | 3 | 233 | 369592 | 1958.35 | 805 | 808 | 188.3 |
| C | 14 | 238 | 130779 | 690.18 | 805 | 808 | 188.3 |
| C | 5 | 37 | 8961 | 43.29 | 805 | 808 | 188.3 |
| D | 1 | 52 | 209938 | 1086.36 | 813 | 790 | 192.5 |
| D | 2 | 250 | 199354 | 1031.38 | 813 | 790 | 192.5 |
| D | 8 | 195 | 154769 | 799.8 | 813 | 790 | 192.5 |
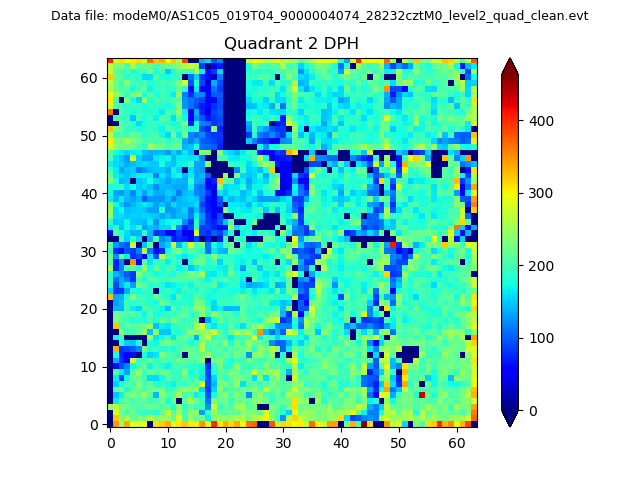
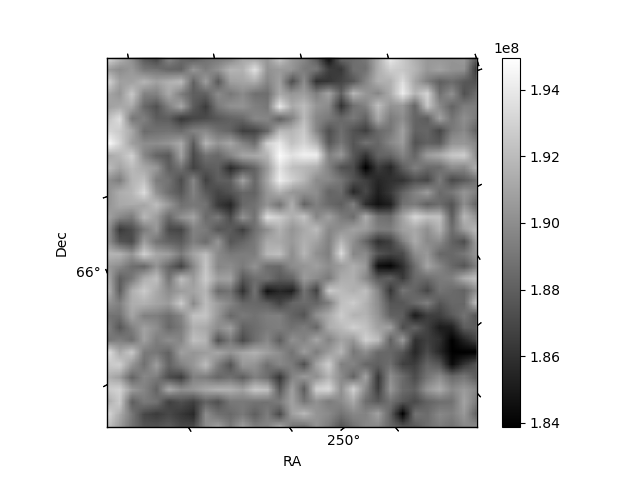
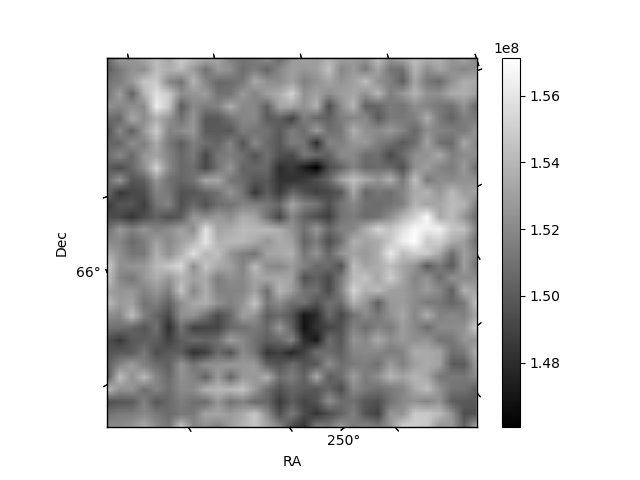
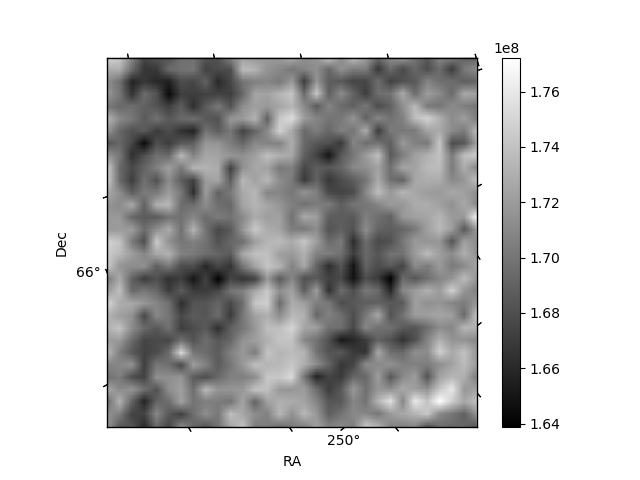
Histogram calculated using DETX and DETY for each event in the final _common_clean file
| Quadrant A | 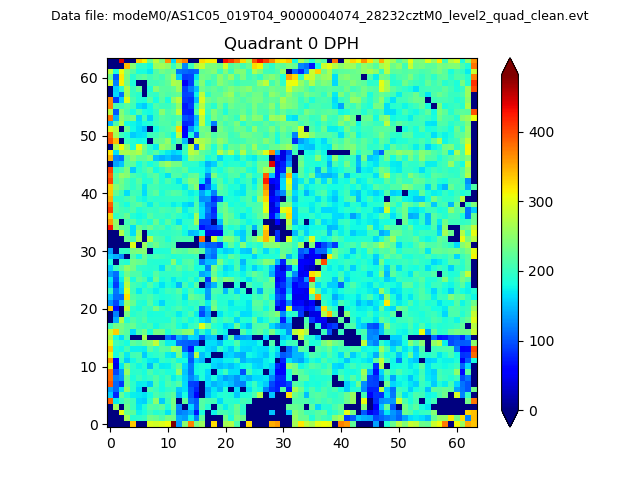 |
 |
Quadrant B |
|---|---|---|---|
| Quadrant D | 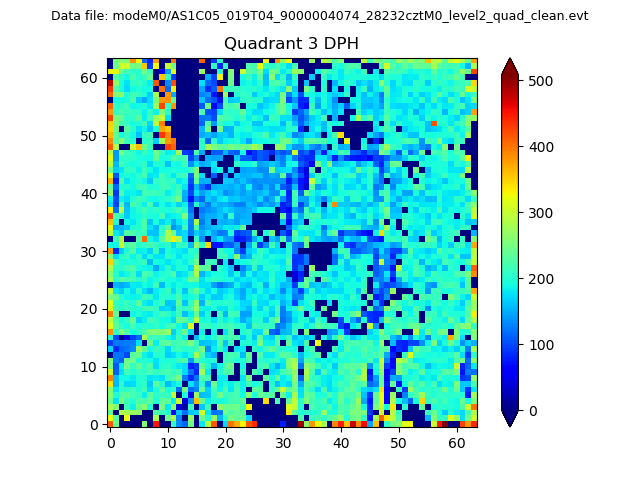 |
 |
Quadrant C |
| Plot type | Count rate plots | Images |
|---|---|---|
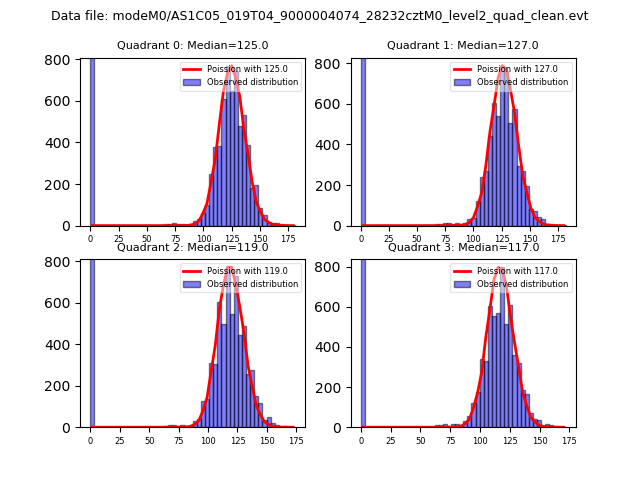
| Comparison with Poisson distribution Blue bars denote a histogram of data divided into 1 sec bins. Red curve is a Poisson curve with rate = median count rate of data. |
 |
 |
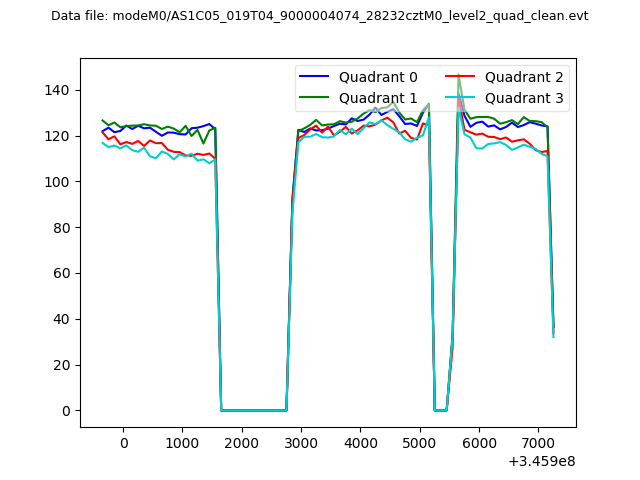
| Quadrant-wise count rates Data is divided into 100 sec bins |
 |
|
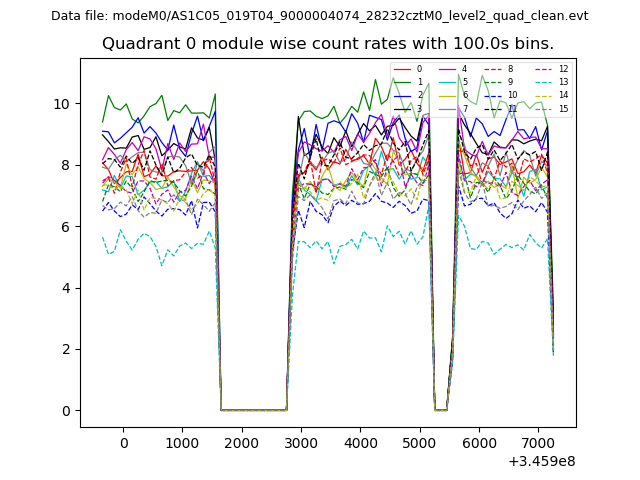
| Module-wise count rates for Quadrant A Data is divided into 100 sec bins |
 |
 |
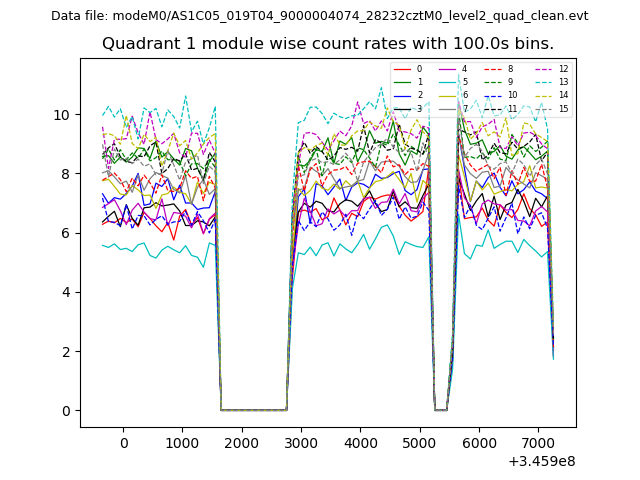
| Module-wise count rates for Quadrant B Data is divided into 100 sec bins |
 |
 |
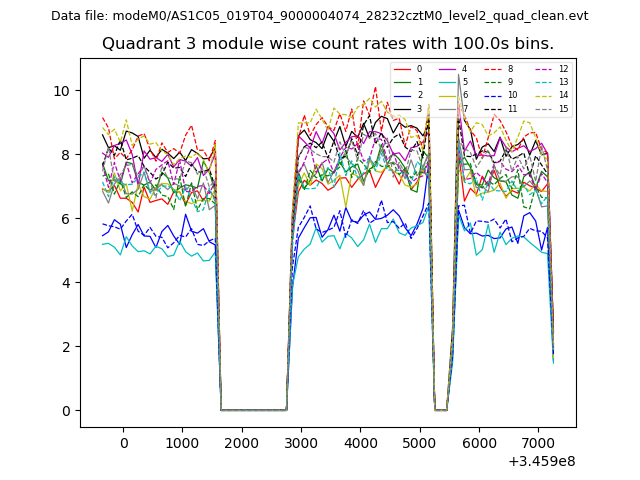
| Module-wise count rates for Quadrant C Data is divided into 100 sec bins |
 |
 |
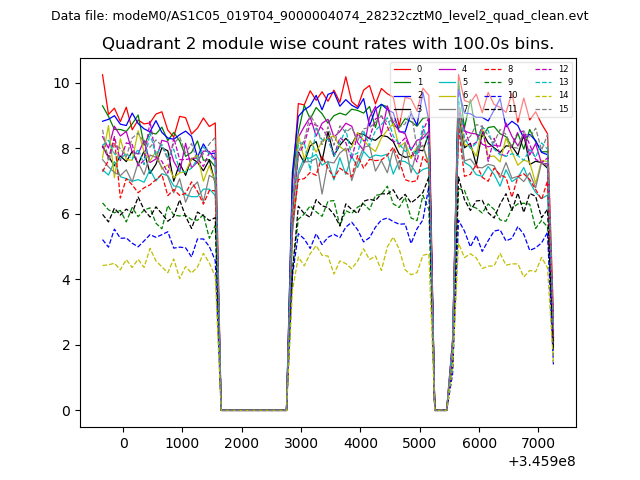
| Module-wise count rates for Quadrant D Data is divided into 100 sec bins |
 |
 |
| Parameter | Plot |
|---|---|
| CZT HV Monitor | 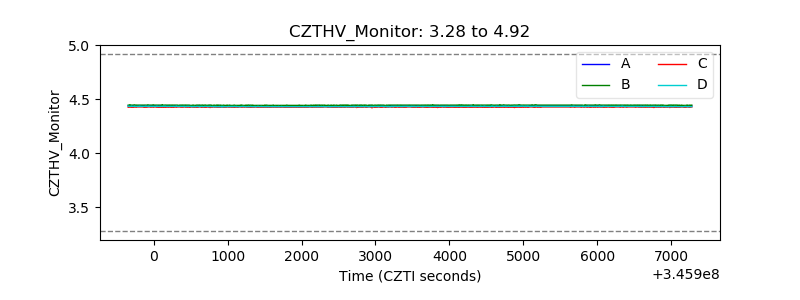 |
| D_VDD | 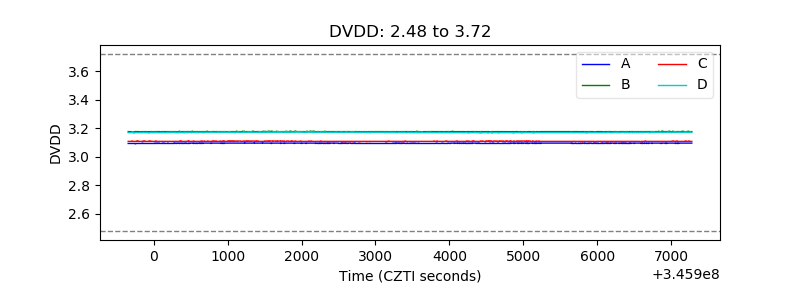 |
| Temperature 1 |  |
| Veto HV Monitor | 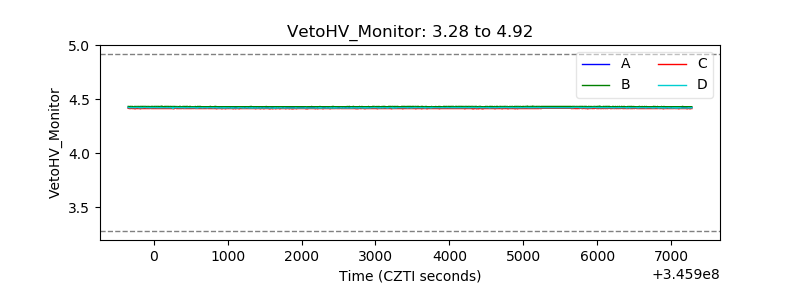 |
| Veto LLD |  |
| Alpha Counter | 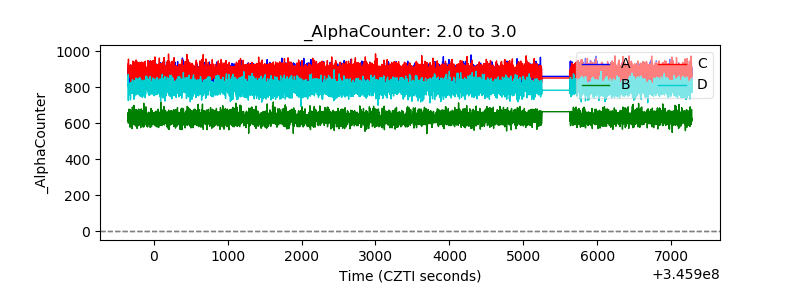 |
| _CPM_Rate | 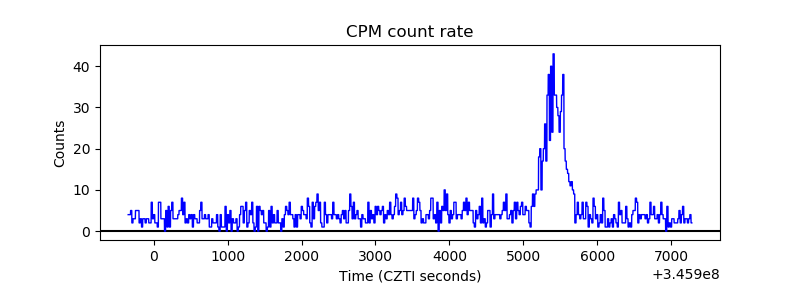 |
| CZT Counter | 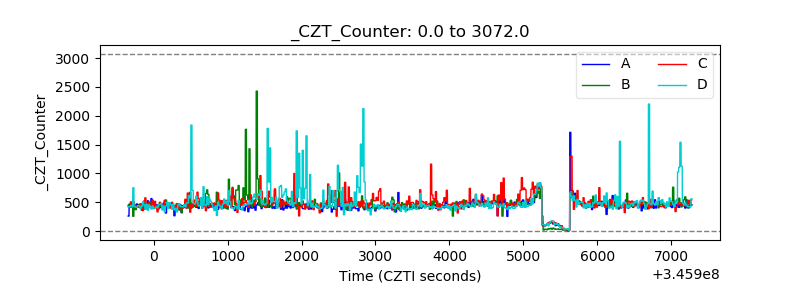 |
| +2.5 Volts monitor |  |
| +5 Volts monitor | 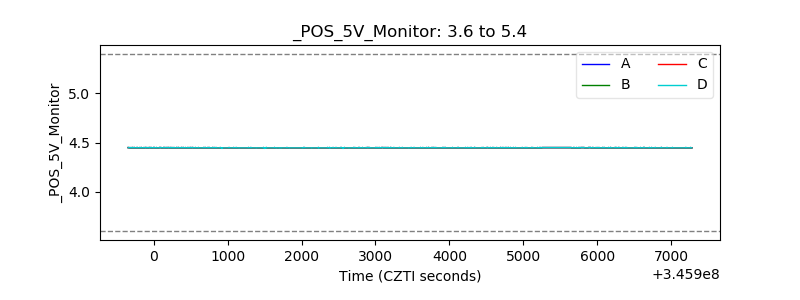 |
| _ROLL_ROT | 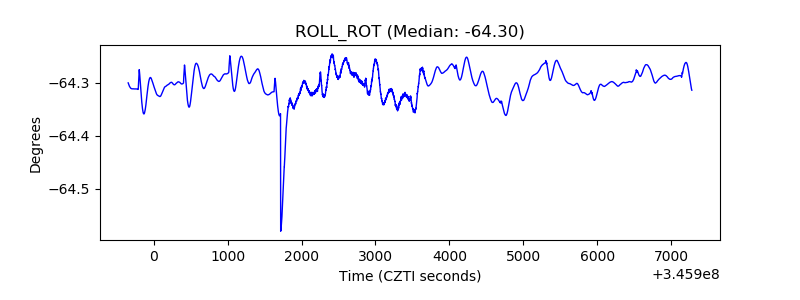 |
| _Roll_DEC | 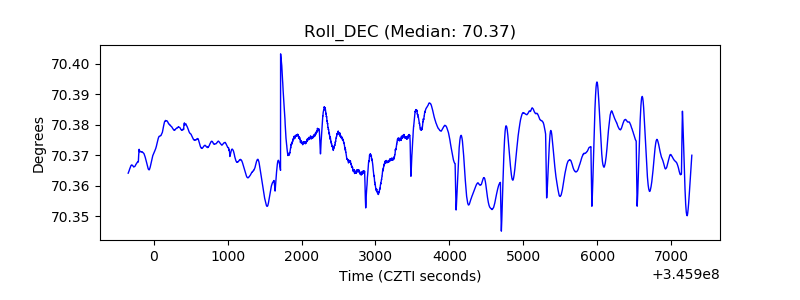 |
| _Roll_RA |  |
| Veto Counter | 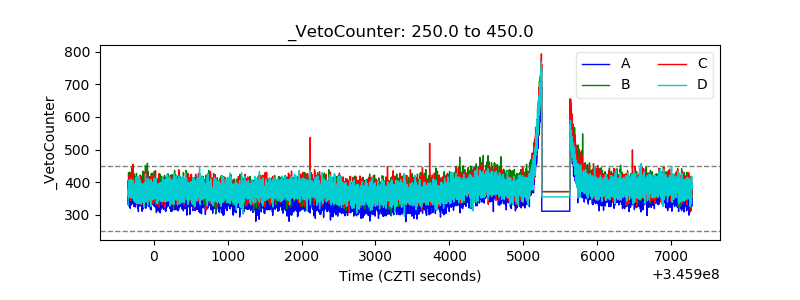 |