| Param | Original file | Final file |
|---|---|---|
| Filename | modeM0/AS1C05_019T04_9000004074_28234cztM0_level2.evt | modeM0/AS1C05_019T04_9000004074_28234cztM0_level2_quad_clean.evt |
| Size (bytes) | 913,953,600 | 179,144,640 |
| Size | 871.6 MB | 170.8 MB |
| Events in quadrant A | 5,683,521 | 1,172,749 |
| Events in quadrant B | 6,078,040 | 1,190,099 |
| Events in quadrant C | 6,444,386 | 1,124,981 |
| Events in quadrant D | 8,631,617 | 1,077,832 |
| Mode M9 | |||
|---|---|---|---|
| Quadrant | BADHDUFLAG | Total packets | Discarded packets |
| A | 0 | 13 | 0 |
| B | 0 | 13 | 0 |
| C | 0 | 13 | 0 |
| D | 0 | 13 | 0 |
| Mode M0 | |||
|---|---|---|---|
| Quadrant | BADHDUFLAG | Total packets | Discarded packets |
| A | 0 | 25192 | 0 |
| B | 0 | 26118 | 0 |
| C | 0 | 26899 | 0 |
| D | 0 | 34231 | 0 |
| Quadrant | Total seconds | Saturated seconds | Saturation percentage |
|---|---|---|---|
| A | 12443 | 91 | 0.731335% |
| B | 12443 | 126 | 1.012618% |
| C | 12443 | 184 | 1.478743% |
| D | 12442 | 752 | 6.044044% |
Noise dominated data is calculated using 1-second bins in cleaned event files. If a bin has >2000 counts, and if more than 50% of those come from <1% of pixels, then it is considered to be noise-dominated and hence unusable.
| Quadrant | # 1 sec bins | Bins with >0 counts | Bins with >2000 counts | High rate bins dominated by noise | Noise dominated (total time) | Noise dominated (detector-on time) | Marked lightcurve |
|---|---|---|---|---|---|---|---|
| A | 13793 | 12443 | 1 | 1 | 0.01% | 0.01% | 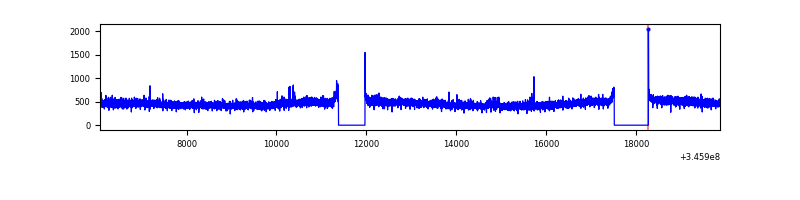 |
| B | 13793 | 12443 | 22 | 22 | 0.16% | 0.18% | 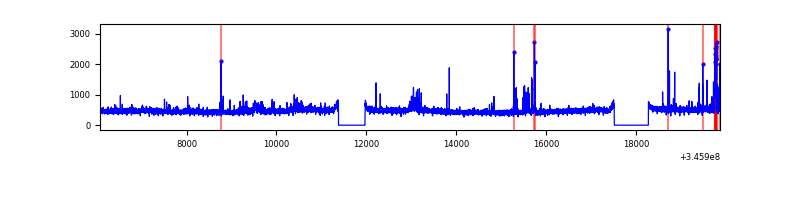 |
| C | 13793 | 12443 | 2 | 2 | 0.01% | 0.02% | 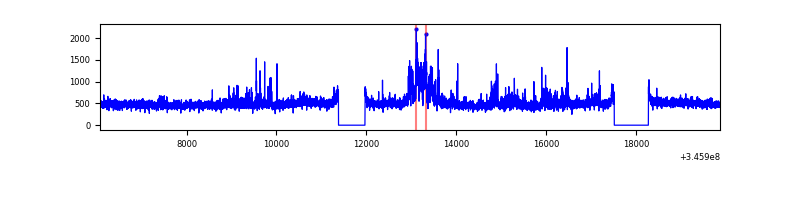 |
| D | 13792 | 12442 | 533 | 533 | 3.86% | 4.28% | 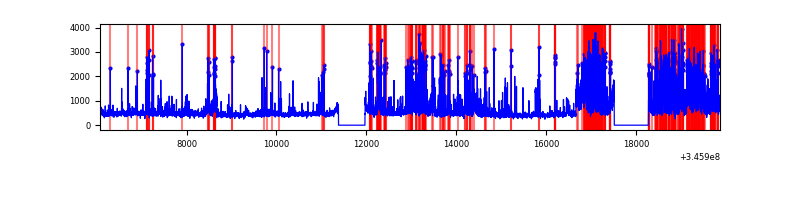 |
Top three noisy pixels from each quadrant. If the there are fewer than three noisy pixels in the level2.evt file, extra rows are filled as -1
| Pixel properties | Quadrant properties | ||||||
|---|---|---|---|---|---|---|---|
| Quadrant | DetID | PixID | Counts | Sigma | Mean | Median | Sigma |
| A | 6 | 16 | 29275 | 94.54 | 1463 | 1431 | 294.5 |
| A | 13 | 254 | 20075 | 63.3 | 1463 | 1431 | 294.5 |
| A | 3 | 137 | 14713 | 45.1 | 1463 | 1431 | 294.5 |
| B | 10 | 245 | 218371 | 780.97 | 1445 | 1404 | 277.8 |
| B | 10 | 246 | 76132 | 268.98 | 1445 | 1404 | 277.8 |
| B | 4 | 200 | 64178 | 225.95 | 1445 | 1404 | 277.8 |
| C | 3 | 233 | 774776 | 2361.4 | 1397 | 1403 | 327.5 |
| C | 14 | 238 | 226000 | 685.78 | 1397 | 1403 | 327.5 |
| C | 13 | 61 | 9400 | 24.42 | 1397 | 1403 | 327.5 |
| D | 1 | 52 | 2537139 | 7689.16 | 1382 | 1345 | 329.8 |
| D | 5 | 222 | 271490 | 819.15 | 1382 | 1345 | 329.8 |
| D | 8 | 195 | 233588 | 704.22 | 1382 | 1345 | 329.8 |
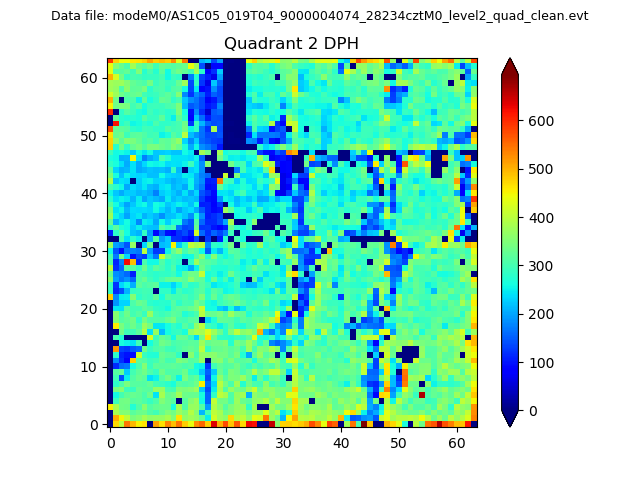
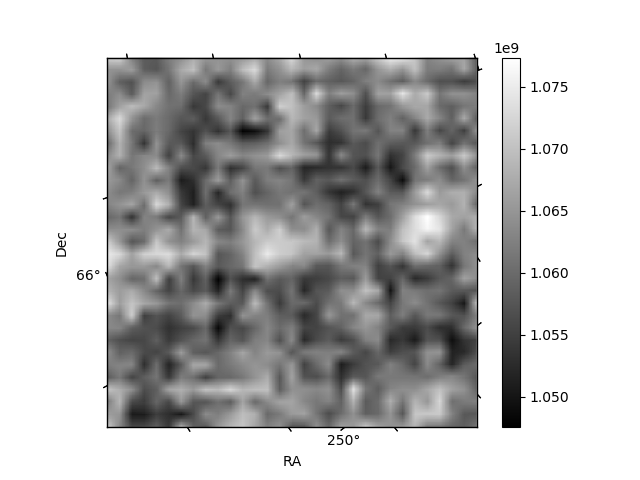
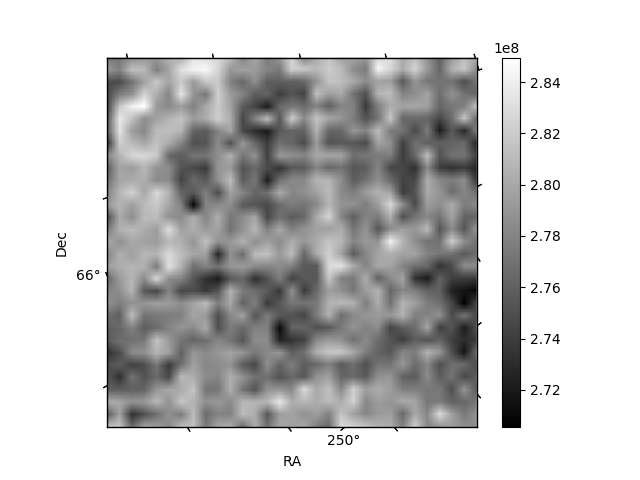
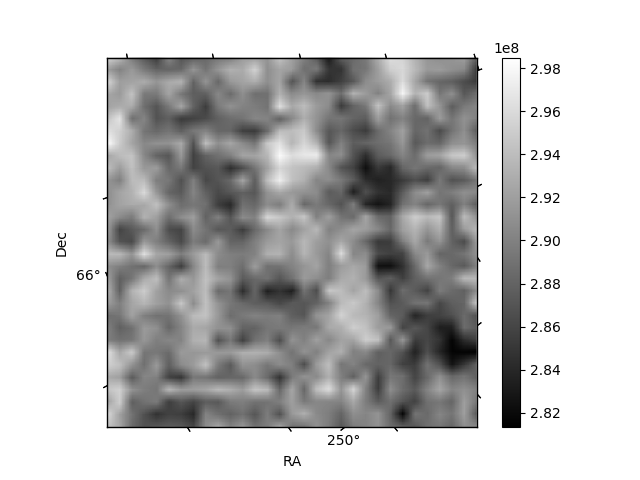
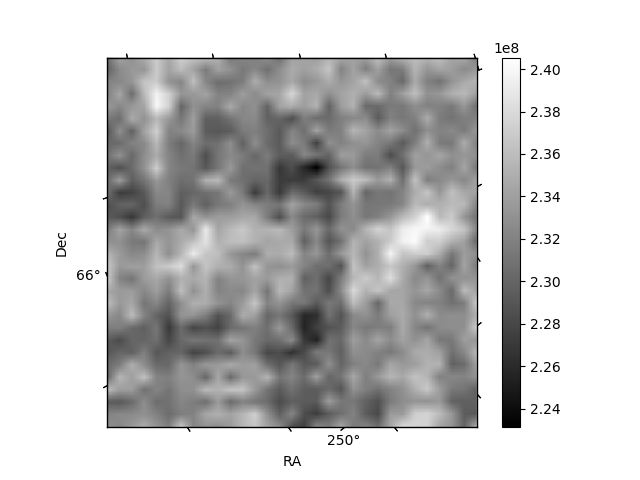
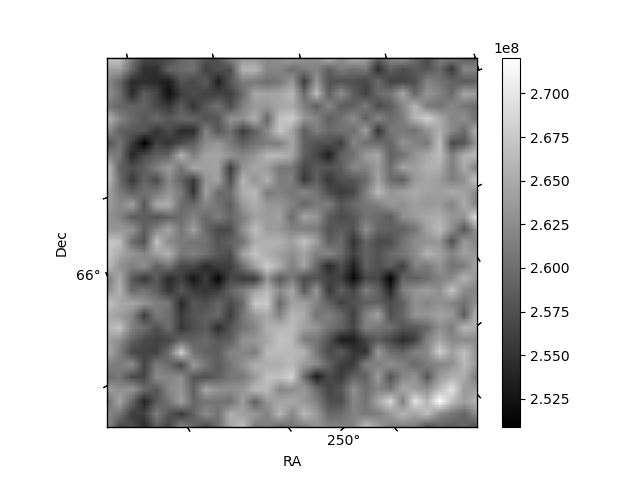
Histogram calculated using DETX and DETY for each event in the final _common_clean file
| Quadrant A | 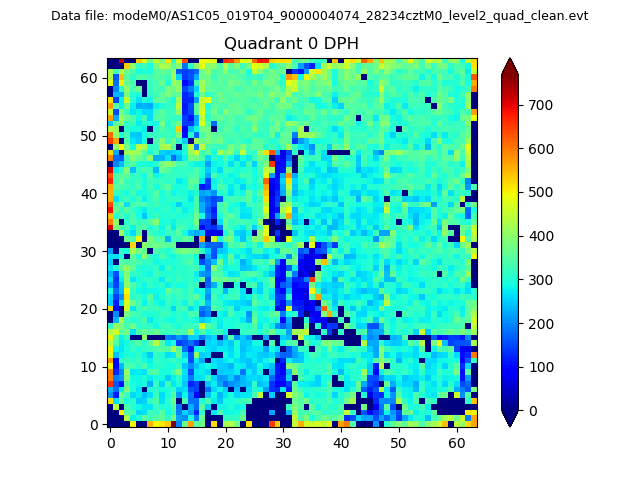 |
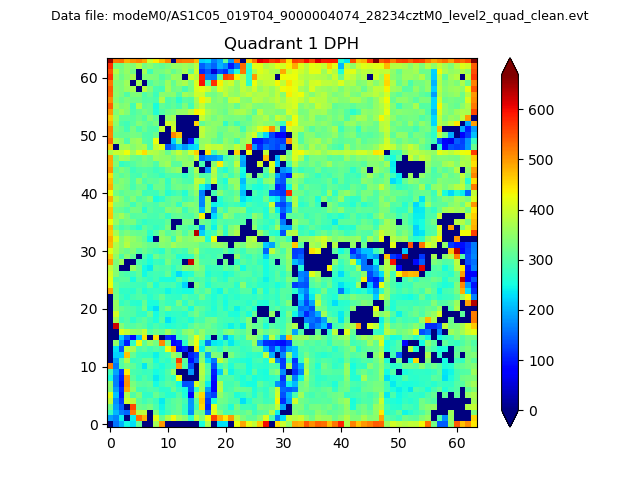 |
Quadrant B |
|---|---|---|---|
| Quadrant D | 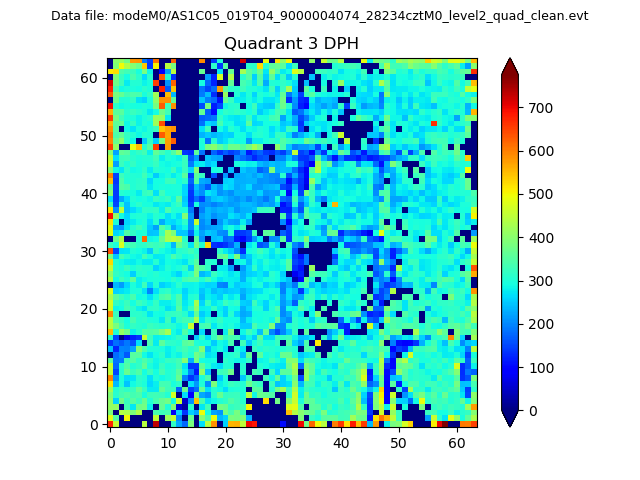 |
 |
Quadrant C |
| Plot type | Count rate plots | Images |
|---|---|---|
| Comparison with Poisson distribution Blue bars denote a histogram of data divided into 1 sec bins. Red curve is a Poisson curve with rate = median count rate of data. |
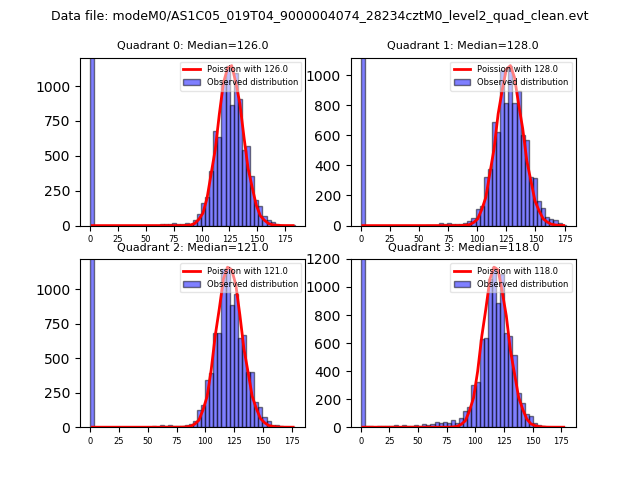 |
 |
| Quadrant-wise count rates Data is divided into 100 sec bins |
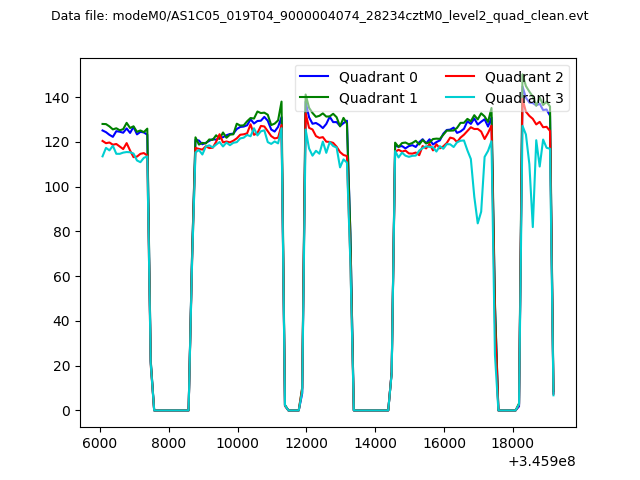 |
|
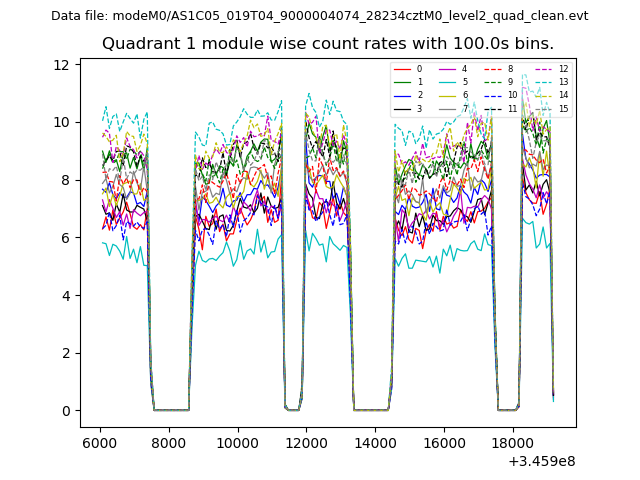
| Module-wise count rates for Quadrant A Data is divided into 100 sec bins |
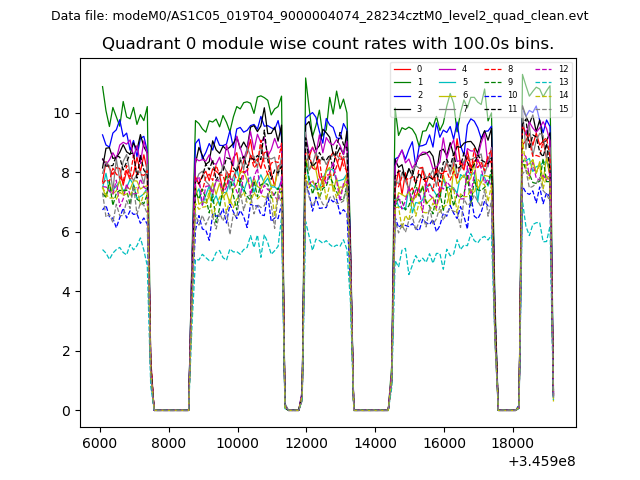 |
 |
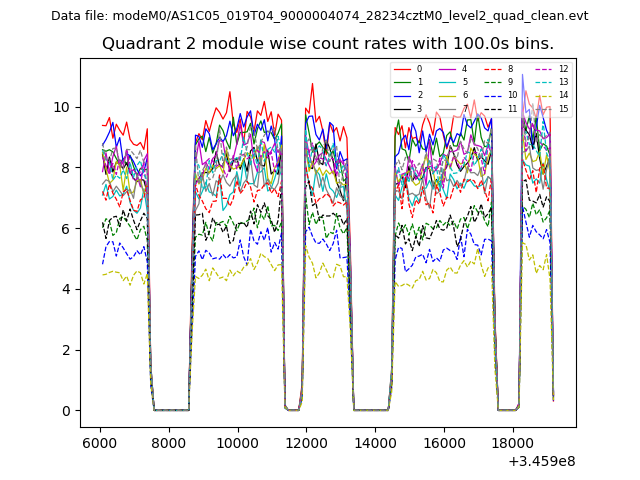
| Module-wise count rates for Quadrant B Data is divided into 100 sec bins |
 |
 |
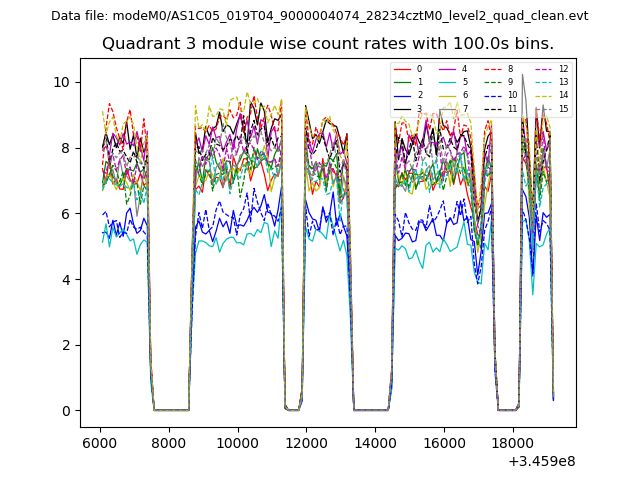
| Module-wise count rates for Quadrant C Data is divided into 100 sec bins |
 |
 |
| Module-wise count rates for Quadrant D Data is divided into 100 sec bins |
 |
 |
| Parameter | Plot |
|---|---|
| CZT HV Monitor | 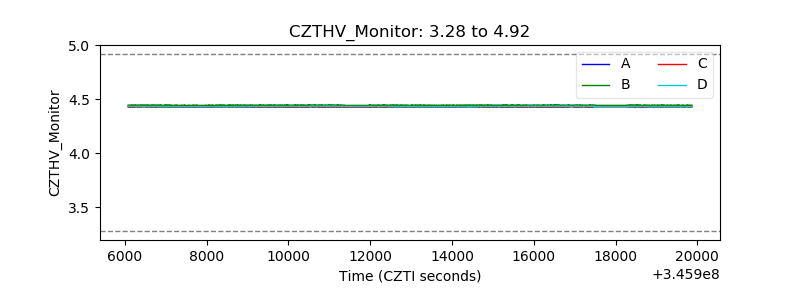 |
| D_VDD | 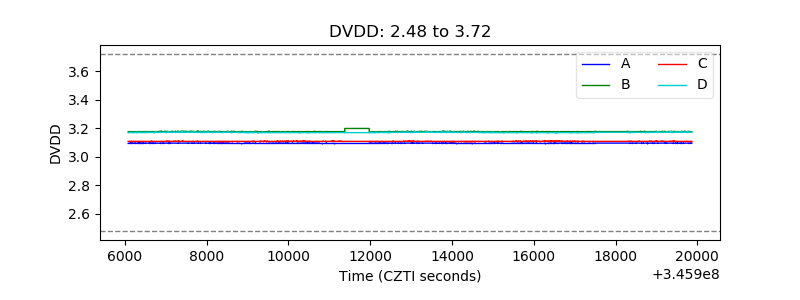 |
| Temperature 1 | 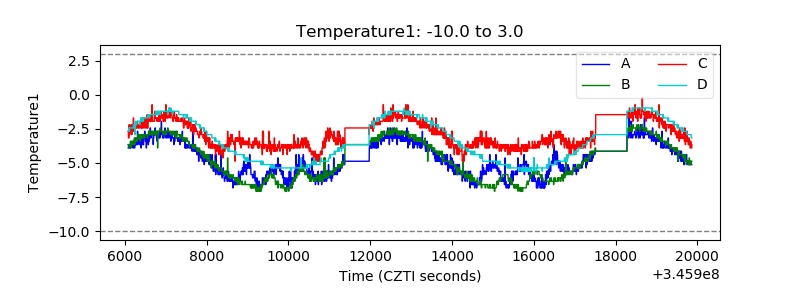 |
| Veto HV Monitor | 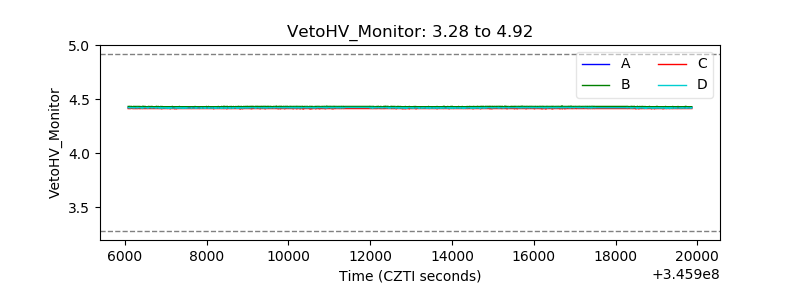 |
| Veto LLD | 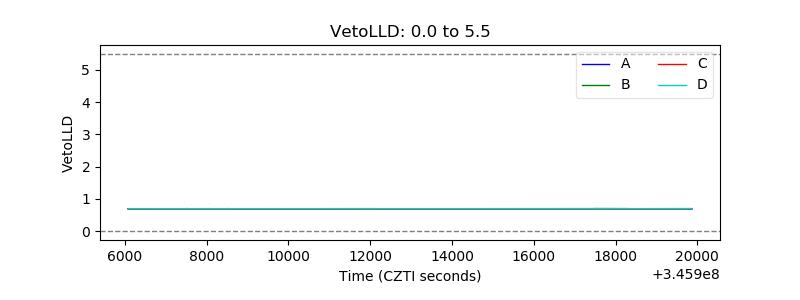 |
| Alpha Counter | 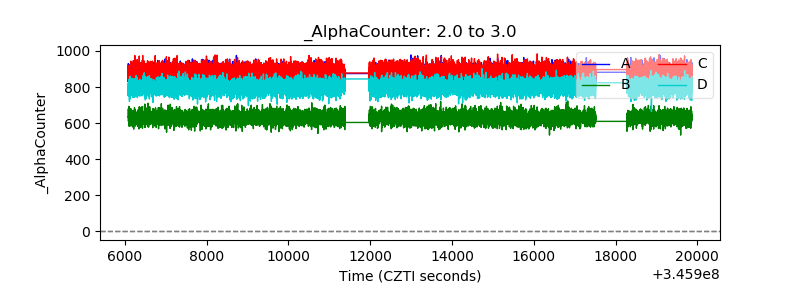 |
| _CPM_Rate | 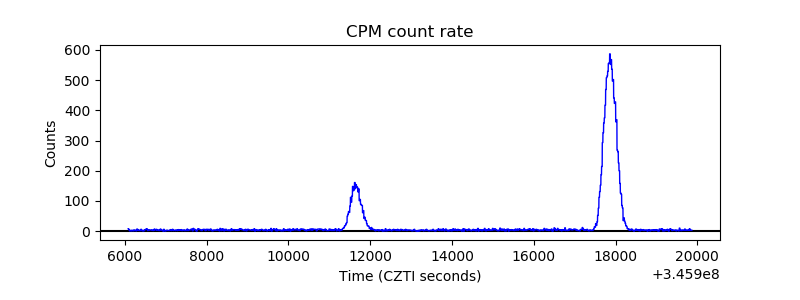 |
| CZT Counter | 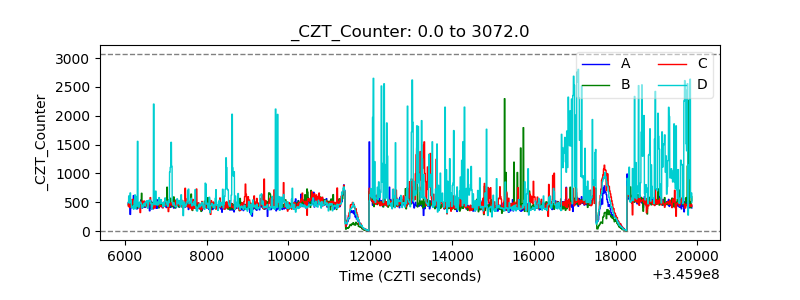 |
| +2.5 Volts monitor |  |
| +5 Volts monitor |  |
| _ROLL_ROT | 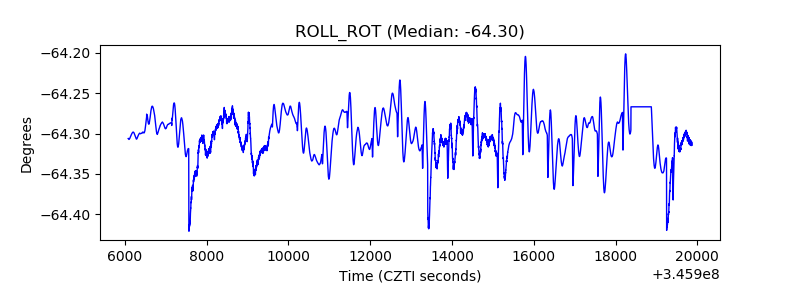 |
| _Roll_DEC | 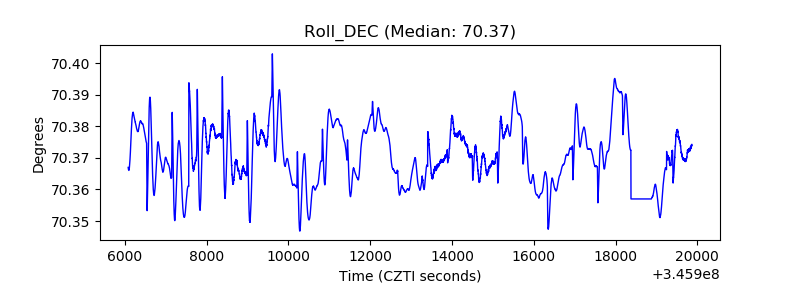 |
| _Roll_RA | 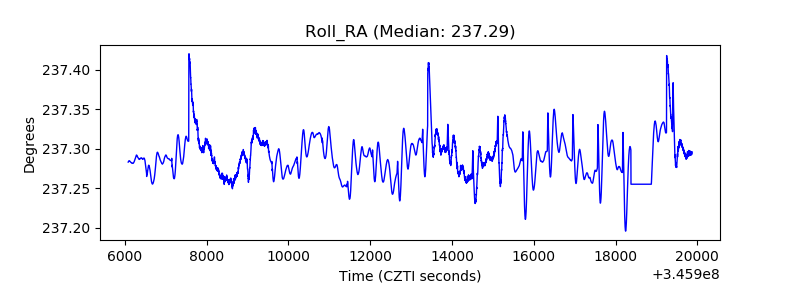 |
| Veto Counter | 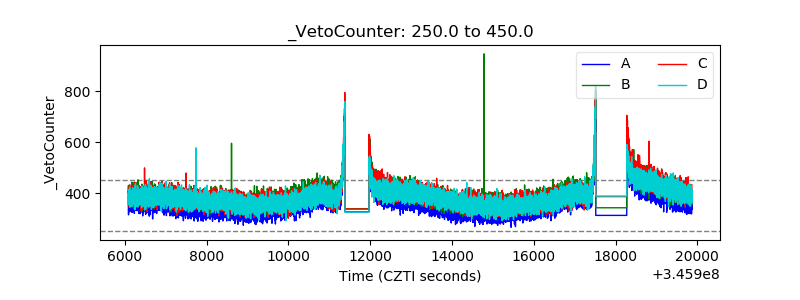 |