| Param | Original file | Final file |
|---|---|---|
| Filename | modeM0/AS1C05_019T04_9000004074_28235cztM0_level2.evt | modeM0/AS1C05_019T04_9000004074_28235cztM0_level2_quad_clean.evt |
| Size (bytes) | 469,425,600 | 81,901,440 |
| Size | 447.7 MB | 78.1 MB |
| Events in quadrant A | 2,897,685 | 519,327 |
| Events in quadrant B | 3,157,119 | 526,060 |
| Events in quadrant C | 3,191,313 | 505,029 |
| Events in quadrant D | 4,543,216 | 490,678 |
| Mode M9 | |||
|---|---|---|---|
| Quadrant | BADHDUFLAG | Total packets | Discarded packets |
| A | 0 | 10 | 0 |
| B | 0 | 10 | 0 |
| C | 0 | 10 | 0 |
| D | 0 | 10 | 0 |
| Mode M0 | |||
|---|---|---|---|
| Quadrant | BADHDUFLAG | Total packets | Discarded packets |
| A | 0 | 12835 | 0 |
| B | 0 | 13527 | 0 |
| C | 0 | 13662 | 0 |
| D | 0 | 17973 | 0 |
| Quadrant | Total seconds | Saturated seconds | Saturation percentage |
|---|---|---|---|
| A | 6291 | 26 | 0.413289% |
| B | 6291 | 68 | 1.080909% |
| C | 6291 | 97 | 1.541885% |
| D | 6290 | 284 | 4.515103% |
Noise dominated data is calculated using 1-second bins in cleaned event files. If a bin has >2000 counts, and if more than 50% of those come from <1% of pixels, then it is considered to be noise-dominated and hence unusable.
| Quadrant | # 1 sec bins | Bins with >0 counts | Bins with >2000 counts | High rate bins dominated by noise | Noise dominated (total time) | Noise dominated (detector-on time) | Marked lightcurve |
|---|---|---|---|---|---|---|---|
| A | 7241 | 6292 | 3 | 3 | 0.04% | 0.05% | 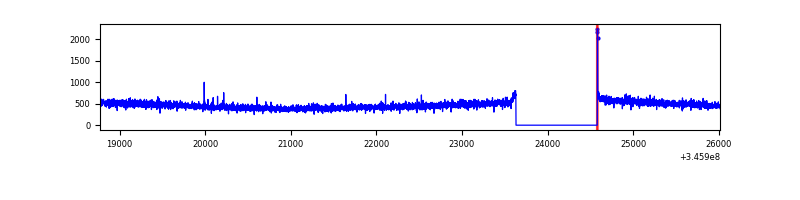 |
| B | 7241 | 6292 | 23 | 23 | 0.32% | 0.37% | 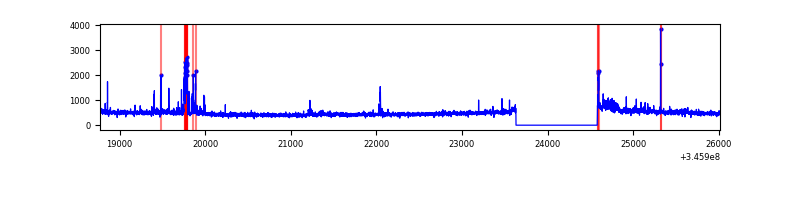 |
| C | 7241 | 6291 | 9 | 9 | 0.12% | 0.14% | 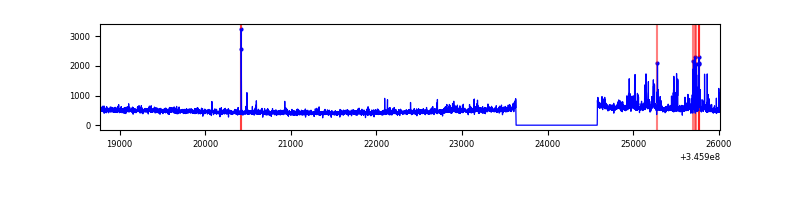 |
| D | 7240 | 6290 | 204 | 204 | 2.82% | 3.24% | 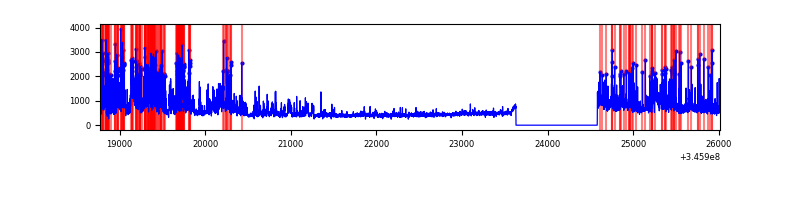 |
Top three noisy pixels from each quadrant. If the there are fewer than three noisy pixels in the level2.evt file, extra rows are filled as -1
| Pixel properties | Quadrant properties | ||||||
|---|---|---|---|---|---|---|---|
| Quadrant | DetID | PixID | Counts | Sigma | Mean | Median | Sigma |
| A | 13 | 254 | 10590 | 65.24 | 748 | 731 | 151.1 |
| A | 8 | 192 | 7822 | 46.93 | 748 | 731 | 151.1 |
| A | 3 | 137 | 7289 | 43.4 | 748 | 731 | 151.1 |
| B | 10 | 245 | 133535 | 928.89 | 741 | 719 | 143.0 |
| B | 4 | 200 | 42706 | 293.65 | 741 | 719 | 143.0 |
| B | 0 | 230 | 31205 | 213.21 | 741 | 719 | 143.0 |
| C | 3 | 233 | 250241 | 1472.37 | 722 | 724 | 169.5 |
| C | 14 | 238 | 117391 | 688.44 | 722 | 724 | 169.5 |
| C | 9 | 54 | 8070 | 43.35 | 722 | 724 | 169.5 |
| D | 1 | 52 | 1335485 | 7703.9 | 720 | 699 | 173.3 |
| D | 8 | 195 | 265269 | 1527.0 | 720 | 699 | 173.3 |
| D | 5 | 222 | 136022 | 781.03 | 720 | 699 | 173.3 |
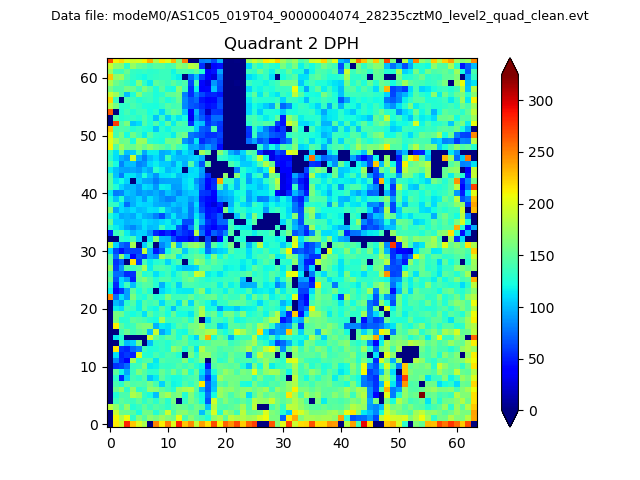
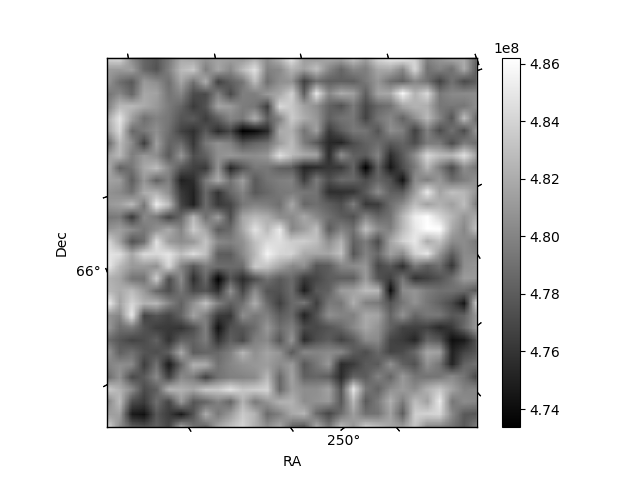
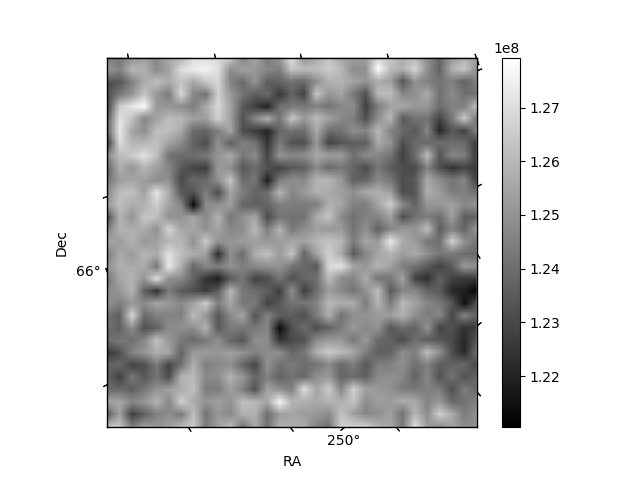
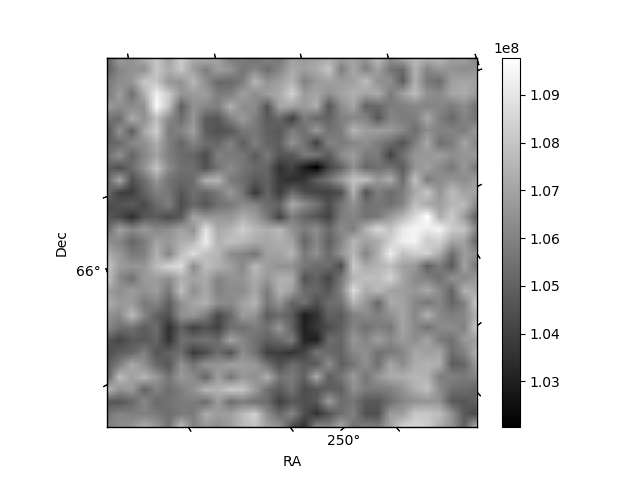
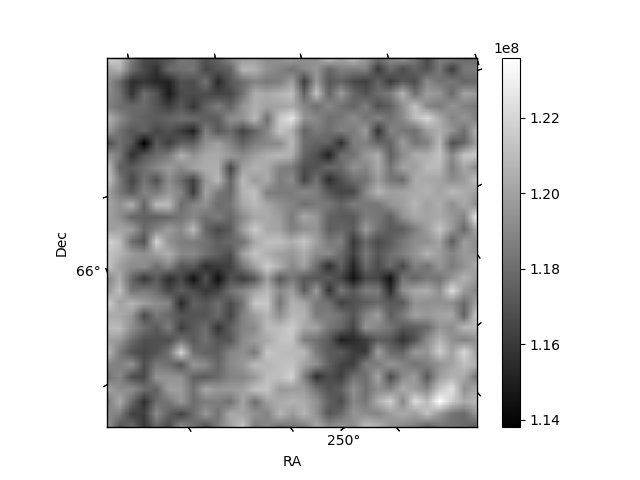
Histogram calculated using DETX and DETY for each event in the final _common_clean file
| Quadrant A | 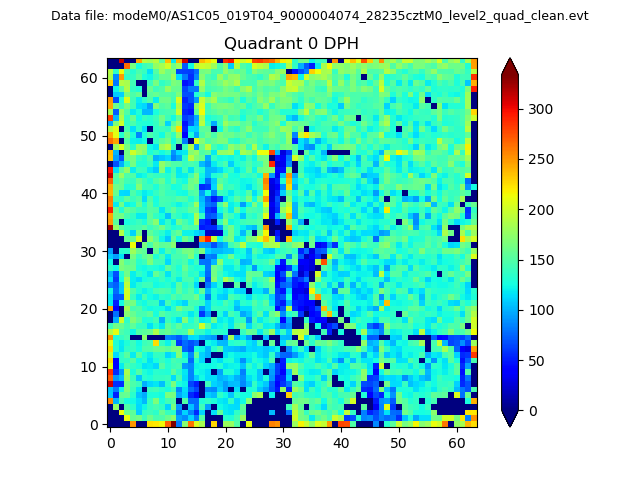 |
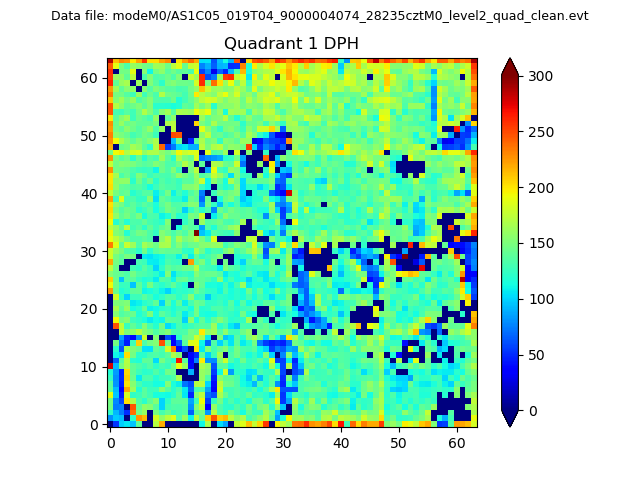 |
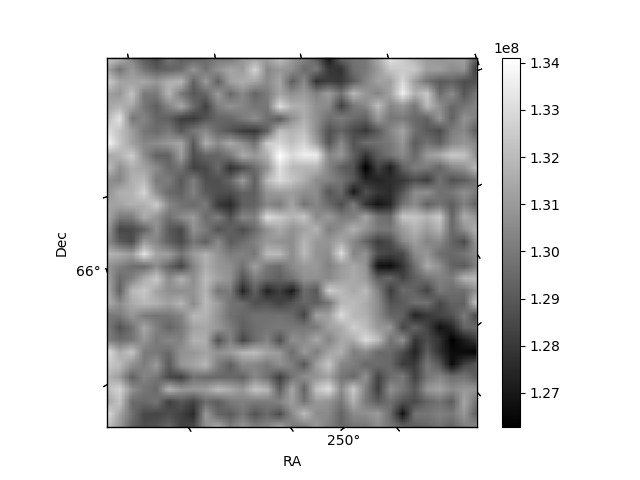
Quadrant B |
|---|---|---|---|
| Quadrant D | 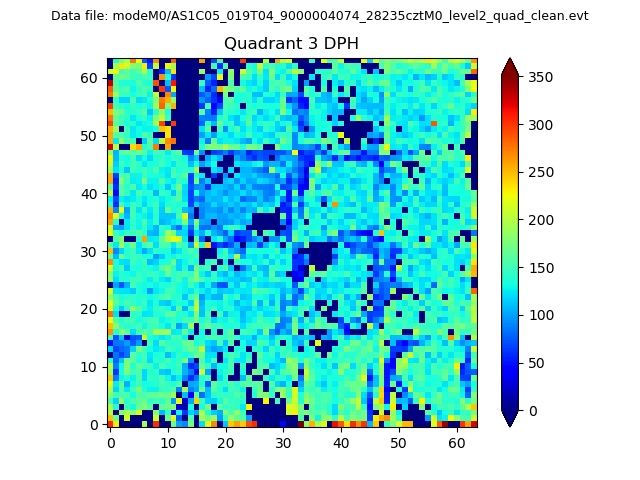 |
 |
Quadrant C |
| Plot type | Count rate plots | Images |
|---|---|---|
| Comparison with Poisson distribution Blue bars denote a histogram of data divided into 1 sec bins. Red curve is a Poisson curve with rate = median count rate of data. |
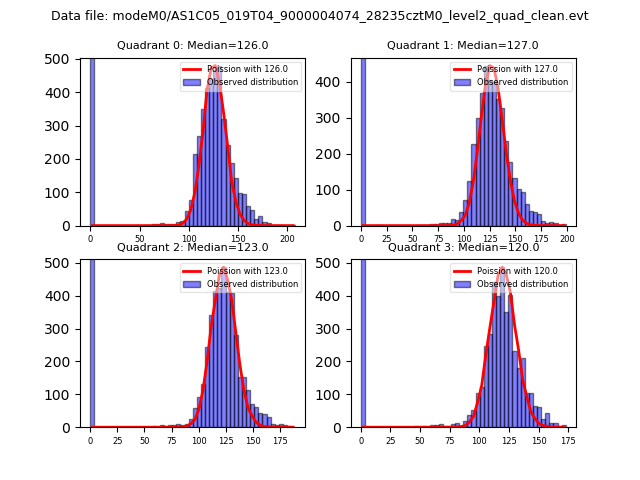 |
 |
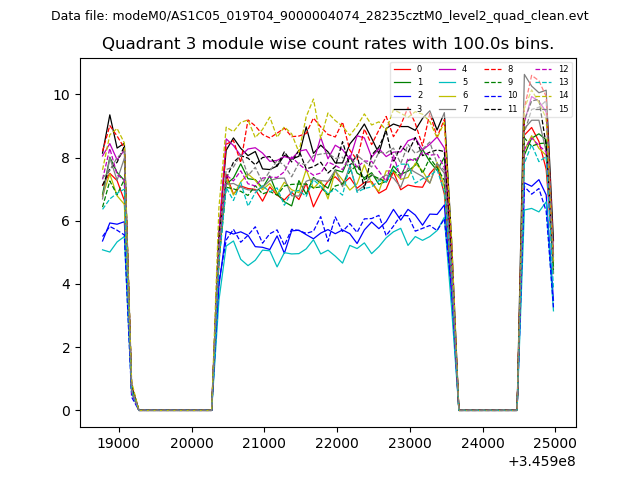
| Quadrant-wise count rates Data is divided into 100 sec bins |
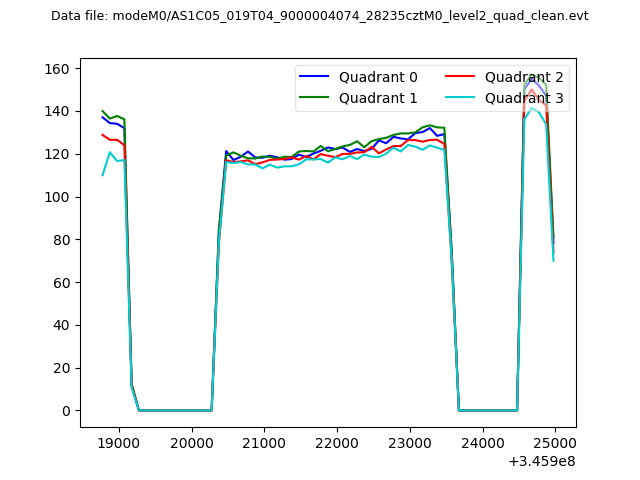 |
|
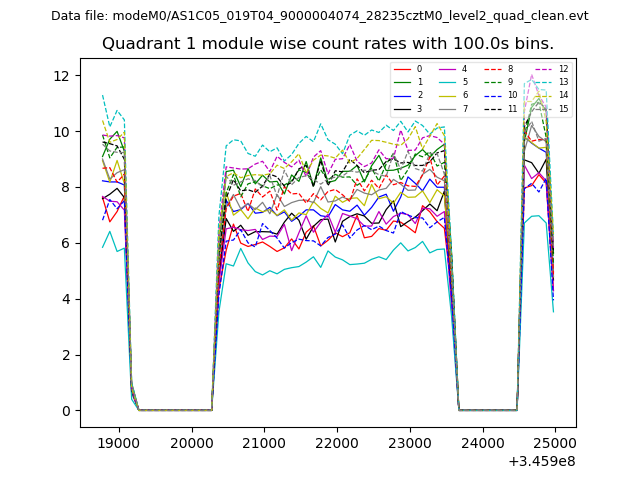
| Module-wise count rates for Quadrant A Data is divided into 100 sec bins |
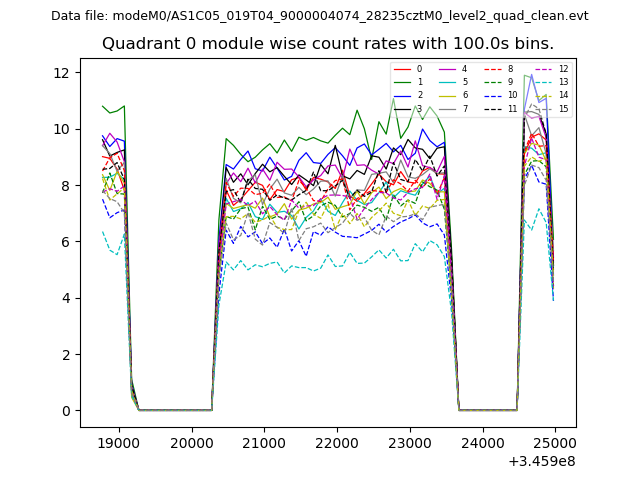 |
 |
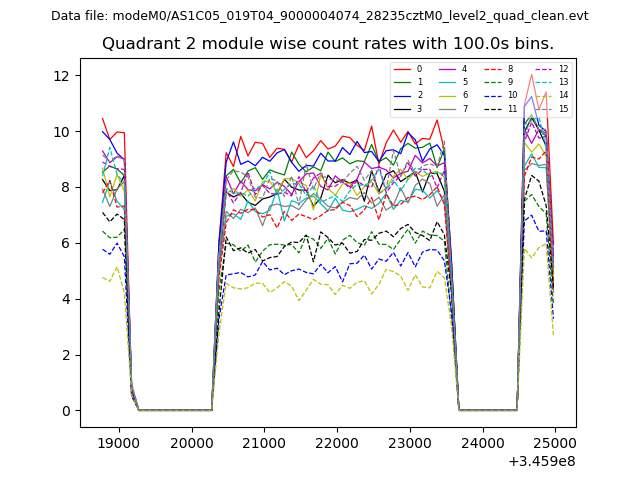
| Module-wise count rates for Quadrant B Data is divided into 100 sec bins |
 |
 |
| Module-wise count rates for Quadrant C Data is divided into 100 sec bins |
 |
 |
| Module-wise count rates for Quadrant D Data is divided into 100 sec bins |
 |
 |
| Parameter | Plot |
|---|---|
| CZT HV Monitor | 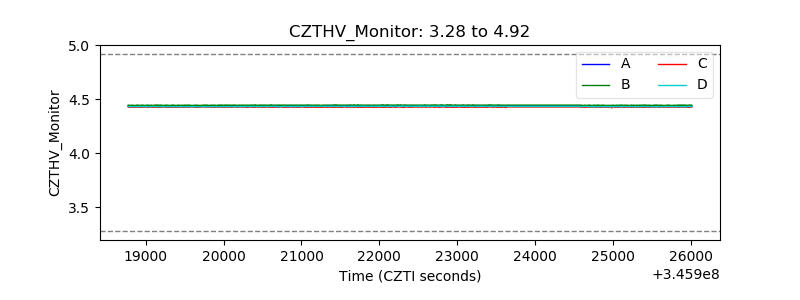 |
| D_VDD | 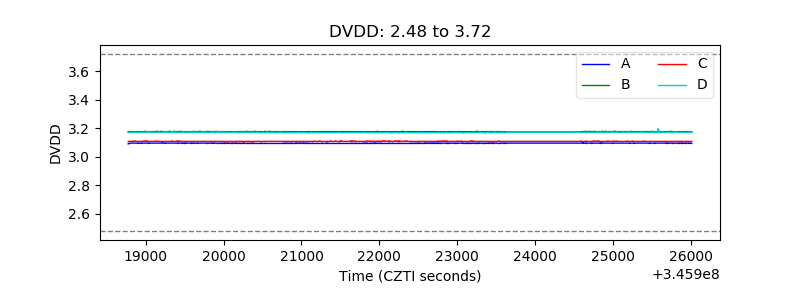 |
| Temperature 1 | 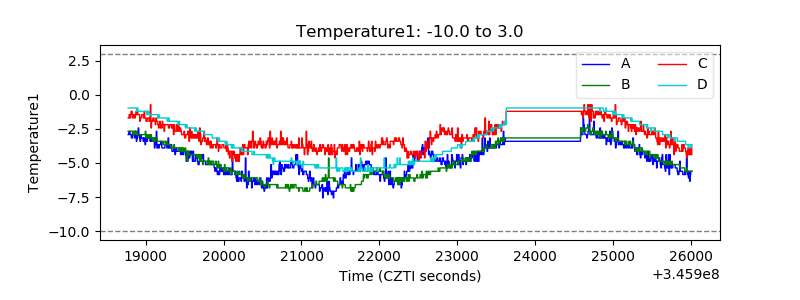 |
| Veto HV Monitor | 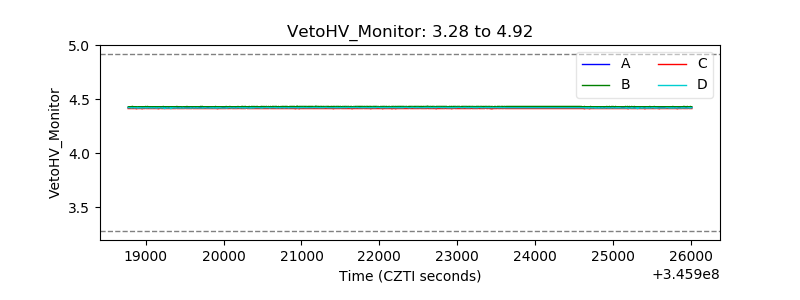 |
| Veto LLD | 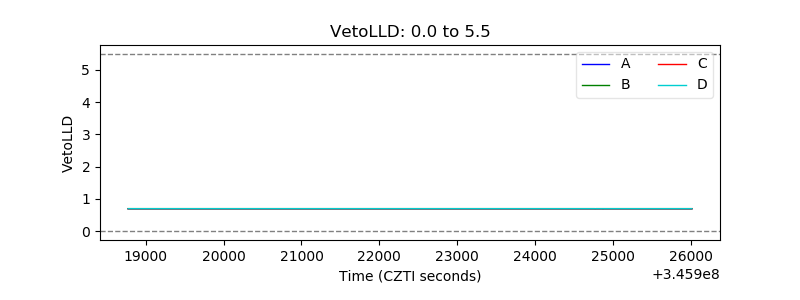 |
| Alpha Counter | 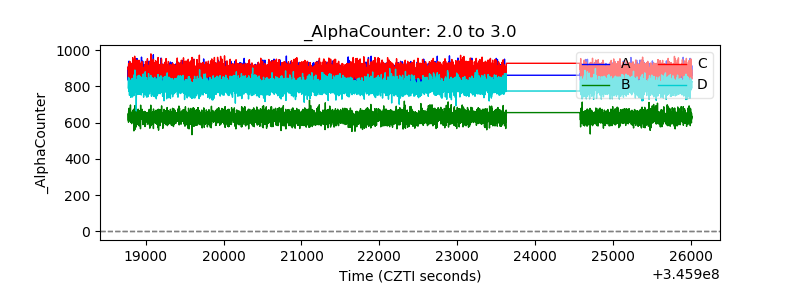 |
| _CPM_Rate | 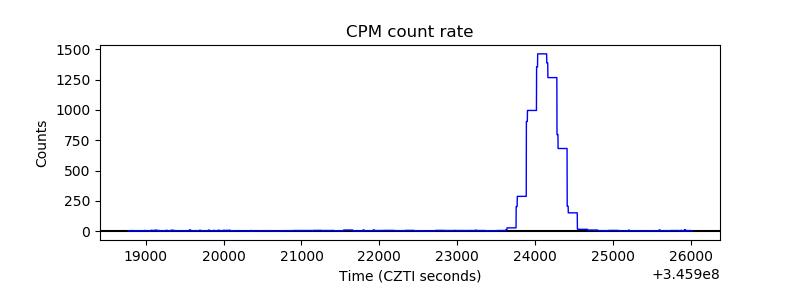 |
| CZT Counter | 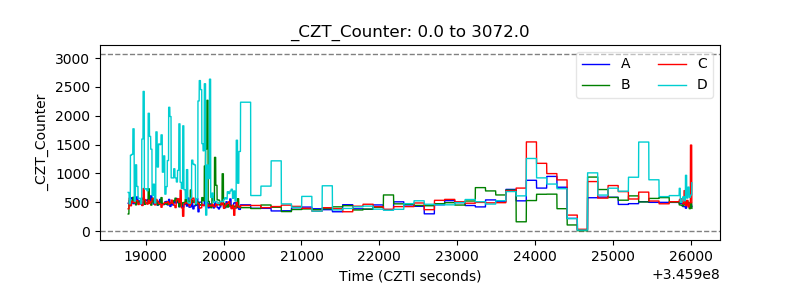 |
| +2.5 Volts monitor |  |
| +5 Volts monitor |  |
| _ROLL_ROT | 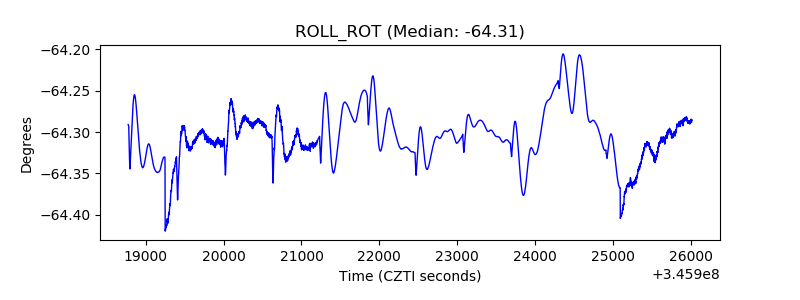 |
| _Roll_DEC | 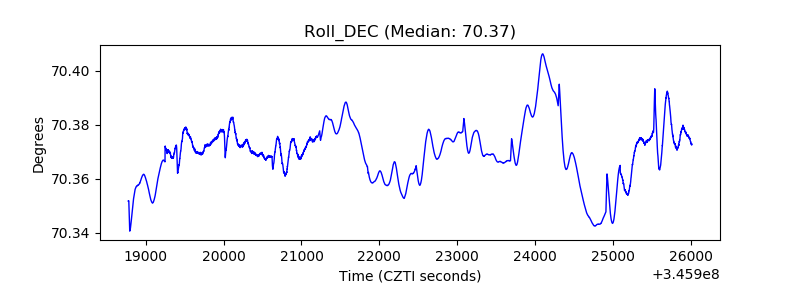 |
| _Roll_RA | 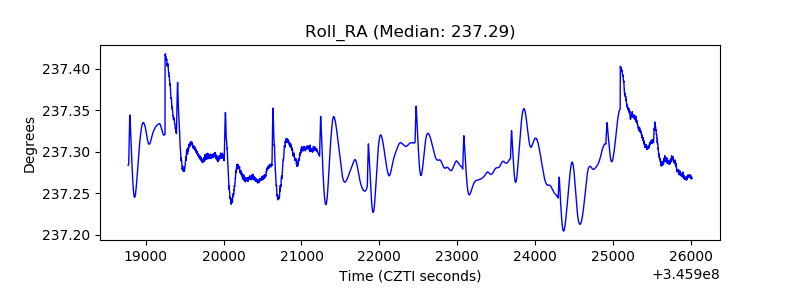 |
| Veto Counter | 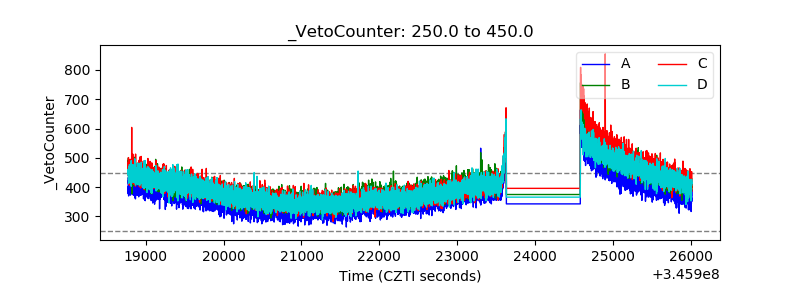 |