| Param | Original file | Final file |
|---|---|---|
| Filename | modeM0/AS1C05_019T04_9000004074_28236cztM0_level2.evt | modeM0/AS1C05_019T04_9000004074_28236cztM0_level2_quad_clean.evt |
| Size (bytes) | 488,479,680 | 84,251,520 |
| Size | 465.9 MB | 80.3 MB |
| Events in quadrant A | 3,121,286 | 527,438 |
| Events in quadrant B | 3,262,494 | 537,914 |
| Events in quadrant C | 3,666,008 | 518,857 |
| Events in quadrant D | 4,296,633 | 507,804 |
| Mode M9 | |||
|---|---|---|---|
| Quadrant | BADHDUFLAG | Total packets | Discarded packets |
| A | 0 | 11 | 0 |
| B | 0 | 12 | 0 |
| C | 0 | 12 | 0 |
| D | 0 | 12 | 0 |
| Mode M0 | |||
|---|---|---|---|
| Quadrant | BADHDUFLAG | Total packets | Discarded packets |
| A | 0 | 13730 | 0 |
| B | 0 | 14170 | 0 |
| C | 0 | 15434 | 0 |
| D | 0 | 17520 | 0 |
| Quadrant | Total seconds | Saturated seconds | Saturation percentage |
|---|---|---|---|
| A | 6586 | 45 | 0.683268% |
| B | 6586 | 61 | 0.926207% |
| C | 6586 | 155 | 2.353477% |
| D | 6586 | 174 | 2.641968% |
Noise dominated data is calculated using 1-second bins in cleaned event files. If a bin has >2000 counts, and if more than 50% of those come from <1% of pixels, then it is considered to be noise-dominated and hence unusable.
| Quadrant | # 1 sec bins | Bins with >0 counts | Bins with >2000 counts | High rate bins dominated by noise | Noise dominated (total time) | Noise dominated (detector-on time) | Marked lightcurve |
|---|---|---|---|---|---|---|---|
| A | 7666 | 6586 | 5 | 5 | 0.07% | 0.08% | 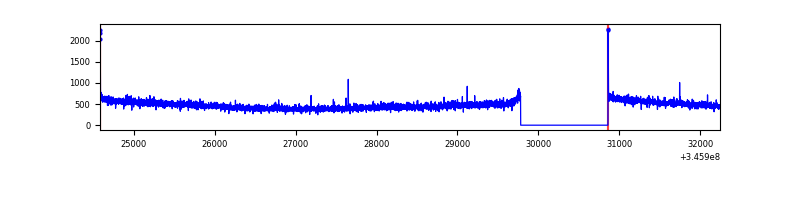 |
| B | 7666 | 6586 | 8 | 8 | 0.10% | 0.12% | 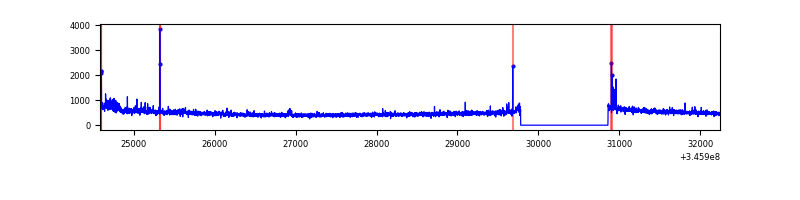 |
| C | 7666 | 6586 | 17 | 17 | 0.22% | 0.26% |  |
| D | 7666 | 6586 | 114 | 114 | 1.49% | 1.73% | 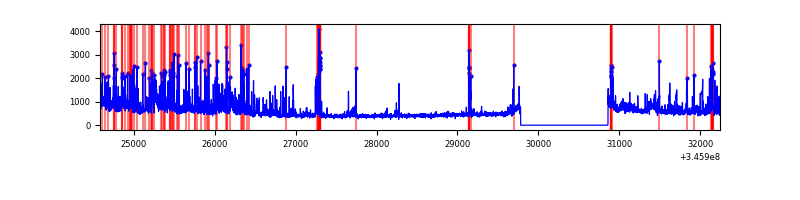 |
Top three noisy pixels from each quadrant. If the there are fewer than three noisy pixels in the level2.evt file, extra rows are filled as -1
| Pixel properties | Quadrant properties | ||||||
|---|---|---|---|---|---|---|---|
| Quadrant | DetID | PixID | Counts | Sigma | Mean | Median | Sigma |
| A | 8 | 192 | 14475 | 84.92 | 804 | 787 | 161.2 |
| A | 13 | 254 | 11211 | 64.67 | 804 | 787 | 161.2 |
| A | 3 | 137 | 7704 | 42.91 | 804 | 787 | 161.2 |
| B | 0 | 230 | 49878 | 321.35 | 801 | 780 | 152.8 |
| B | 4 | 200 | 35672 | 228.37 | 801 | 780 | 152.8 |
| B | 12 | 111 | 18815 | 118.04 | 801 | 780 | 152.8 |
| C | 3 | 233 | 482804 | 2645.08 | 782 | 785 | 182.2 |
| C | 14 | 238 | 128206 | 699.22 | 782 | 785 | 182.2 |
| C | 9 | 221 | 9979 | 50.45 | 782 | 785 | 182.2 |
| D | 1 | 52 | 685199 | 3677.78 | 784 | 763 | 186.1 |
| D | 8 | 195 | 471165 | 2527.68 | 784 | 763 | 186.1 |
| D | 5 | 222 | 89625 | 477.49 | 784 | 763 | 186.1 |
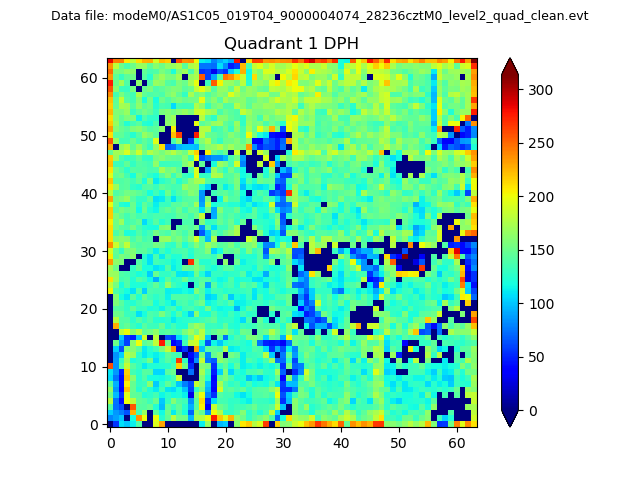
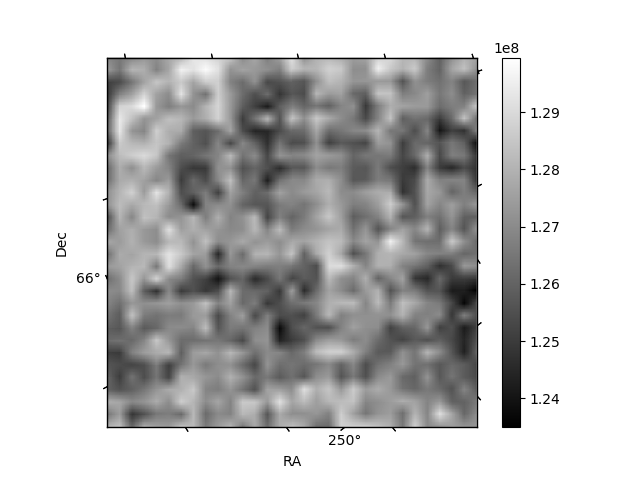
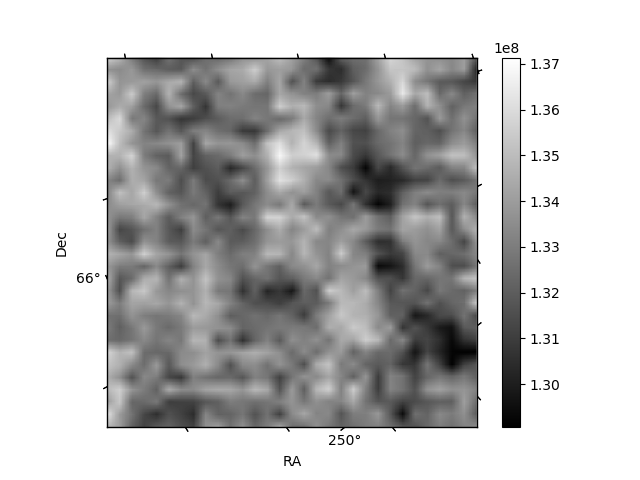
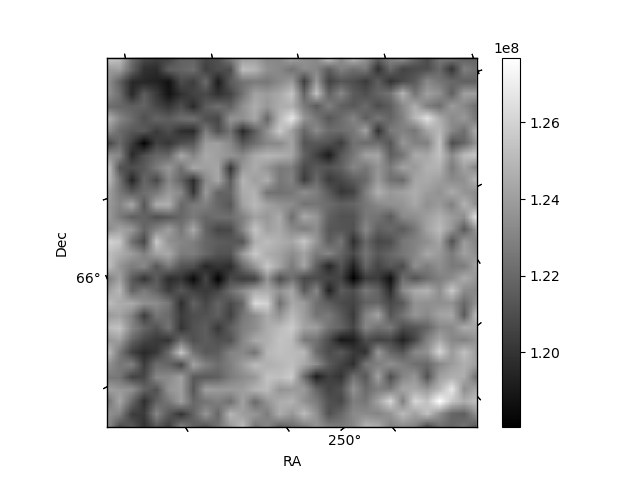
Histogram calculated using DETX and DETY for each event in the final _common_clean file
| Quadrant A | 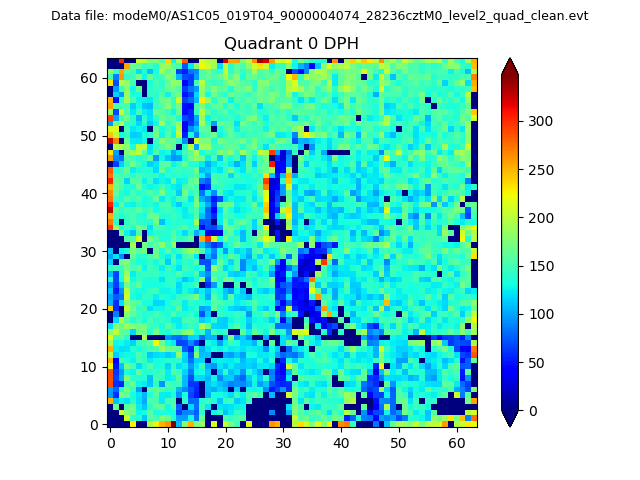 |
 |
Quadrant B |
|---|---|---|---|
| Quadrant D | 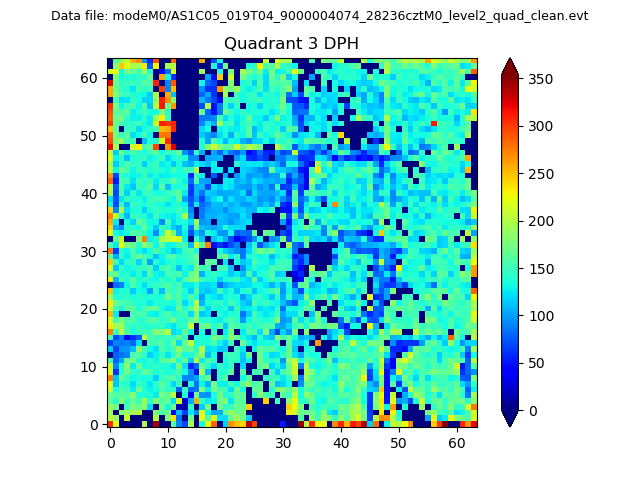 |
 |
Quadrant C |
| Plot type | Count rate plots | Images |
|---|---|---|
| Comparison with Poisson distribution Blue bars denote a histogram of data divided into 1 sec bins. Red curve is a Poisson curve with rate = median count rate of data. |
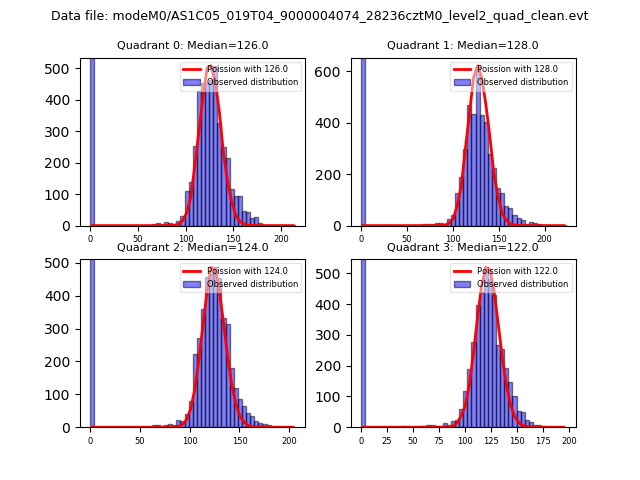 |
 |
| Quadrant-wise count rates Data is divided into 100 sec bins |
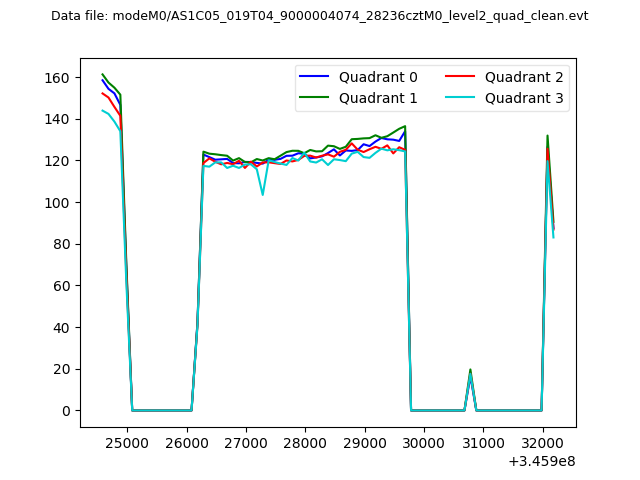 |
|
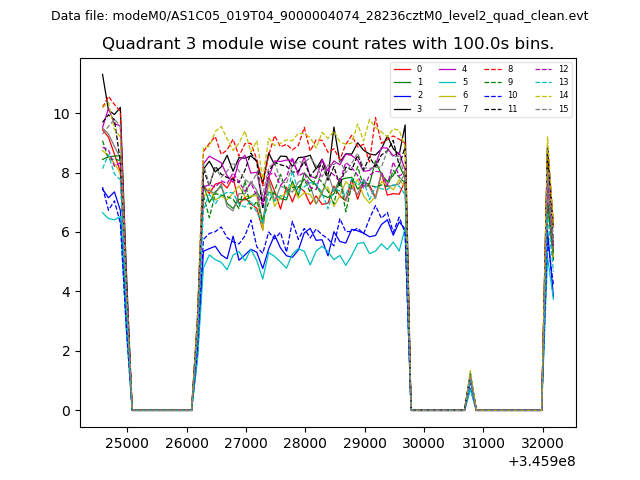
| Module-wise count rates for Quadrant A Data is divided into 100 sec bins |
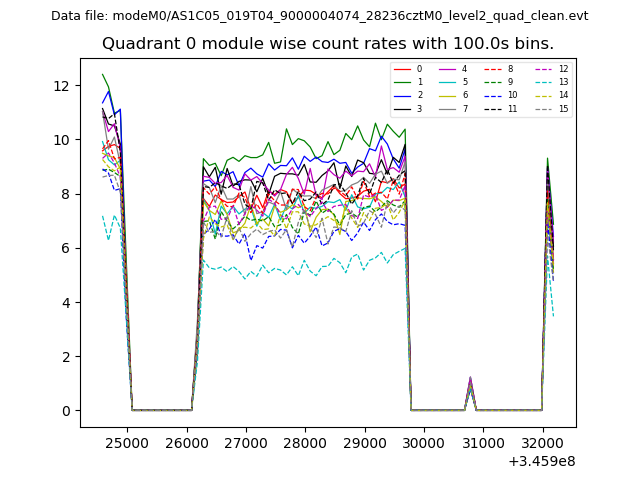 |
 |
| Module-wise count rates for Quadrant B Data is divided into 100 sec bins |
 |
 |
| Module-wise count rates for Quadrant C Data is divided into 100 sec bins |
 |
 |
| Module-wise count rates for Quadrant D Data is divided into 100 sec bins |
 |
 |
| Parameter | Plot |
|---|---|
| CZT HV Monitor | 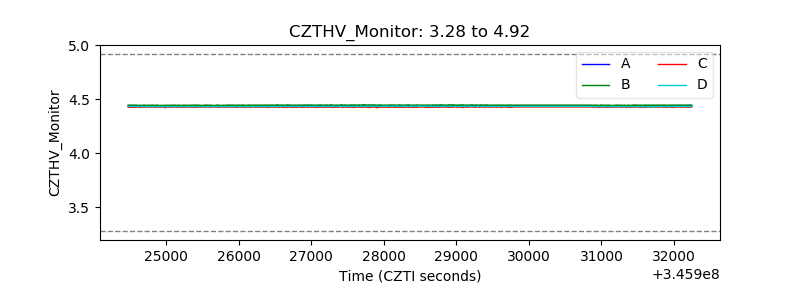 |
| D_VDD | 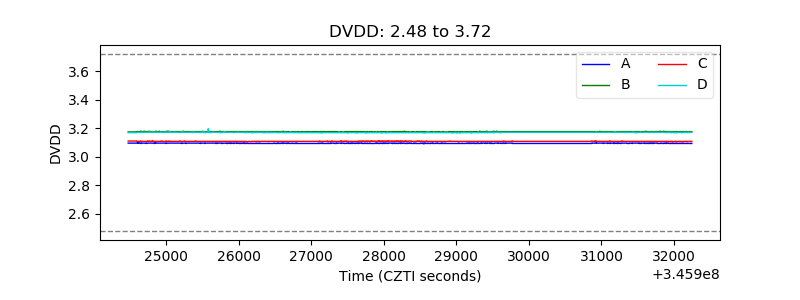 |
| Temperature 1 |  |
| Veto HV Monitor | 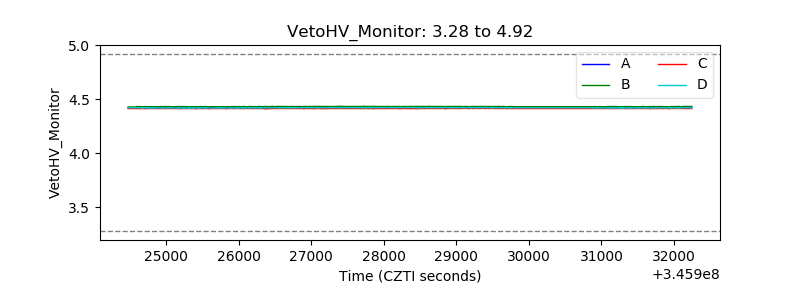 |
| Veto LLD | 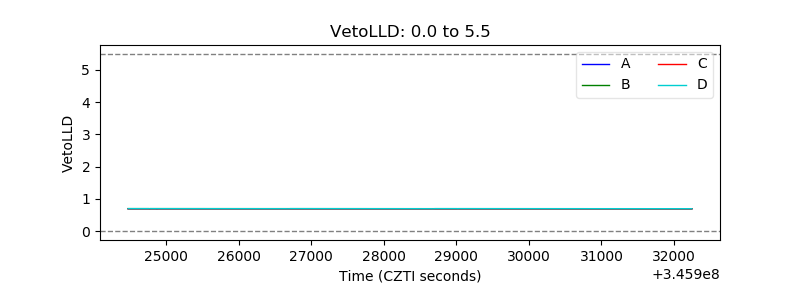 |
| Alpha Counter |  |
| _CPM_Rate | 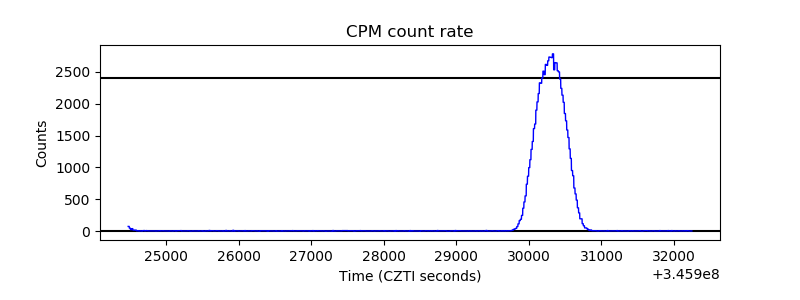 |
| CZT Counter | 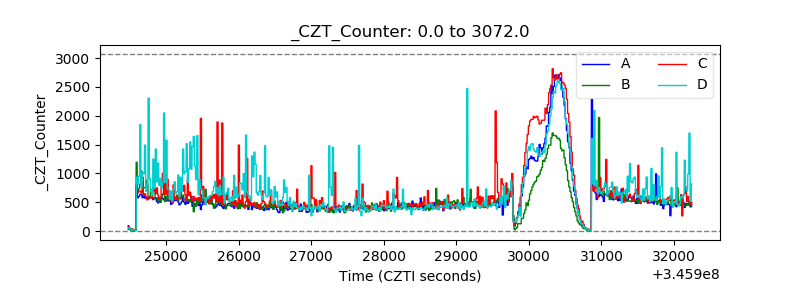 |
| +2.5 Volts monitor |  |
| +5 Volts monitor | 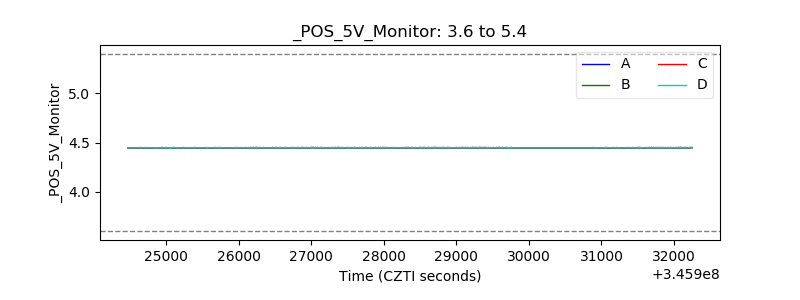 |
| _ROLL_ROT | 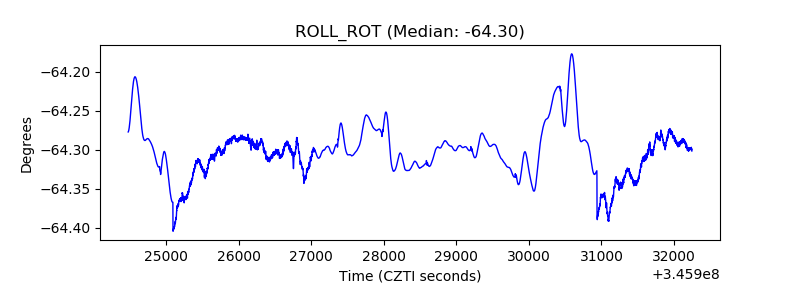 |
| _Roll_DEC | 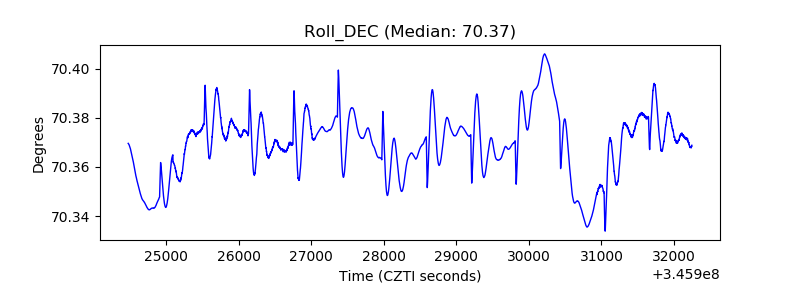 |
| _Roll_RA | 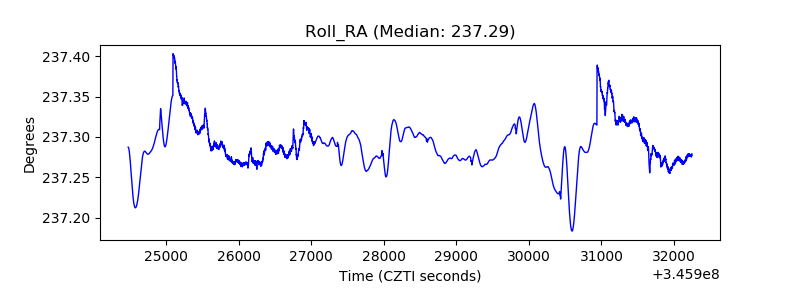 |
| Veto Counter | 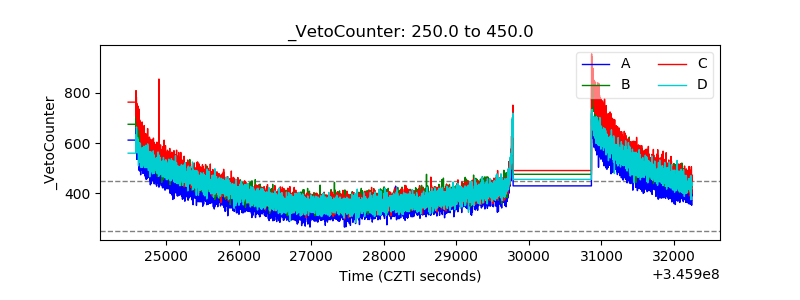 |