| Param | Original file | Final file |
|---|---|---|
| Filename | modeM0/AS1C05_019T04_9000004074_28238cztM0_level2.evt | modeM0/AS1C05_019T04_9000004074_28238cztM0_level2_quad_clean.evt |
| Size (bytes) | 475,220,160 | 89,300,160 |
| Size | 453.2 MB | 85.2 MB |
| Events in quadrant A | 3,089,508 | 566,757 |
| Events in quadrant B | 3,160,141 | 583,665 |
| Events in quadrant C | 3,347,698 | 564,518 |
| Events in quadrant D | 4,362,588 | 545,156 |
| Mode M9 | |||
|---|---|---|---|
| Quadrant | BADHDUFLAG | Total packets | Discarded packets |
| A | 0 | 12 | 0 |
| B | 0 | 12 | 0 |
| C | 0 | 12 | 0 |
| D | 0 | 12 | 0 |
| Mode M0 | |||
|---|---|---|---|
| Quadrant | BADHDUFLAG | Total packets | Discarded packets |
| A | 0 | 13466 | 0 |
| B | 0 | 13657 | 0 |
| C | 0 | 14335 | 0 |
| D | 0 | 17197 | 0 |
| Quadrant | Total seconds | Saturated seconds | Saturation percentage |
|---|---|---|---|
| A | 6363 | 31 | 0.487192% |
| B | 6364 | 32 | 0.502828% |
| C | 6364 | 104 | 1.634192% |
| D | 6364 | 141 | 2.215588% |
Noise dominated data is calculated using 1-second bins in cleaned event files. If a bin has >2000 counts, and if more than 50% of those come from <1% of pixels, then it is considered to be noise-dominated and hence unusable.
| Quadrant | # 1 sec bins | Bins with >0 counts | Bins with >2000 counts | High rate bins dominated by noise | Noise dominated (total time) | Noise dominated (detector-on time) | Marked lightcurve |
|---|---|---|---|---|---|---|---|
| A | 7563 | 6364 | 3 | 3 | 0.04% | 0.05% | 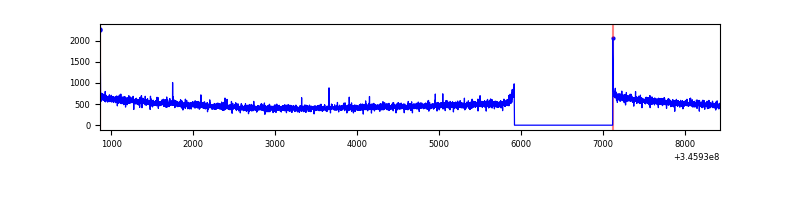 |
| B | 7564 | 6365 | 2 | 2 | 0.03% | 0.03% | 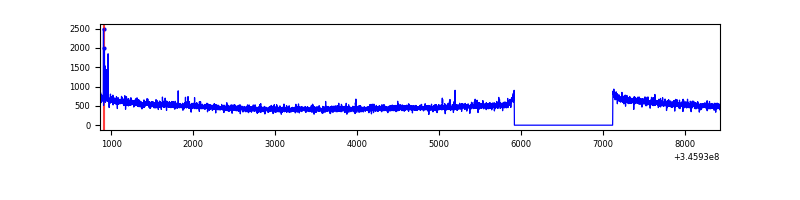 |
| C | 7564 | 6365 | 6 | 6 | 0.08% | 0.09% | 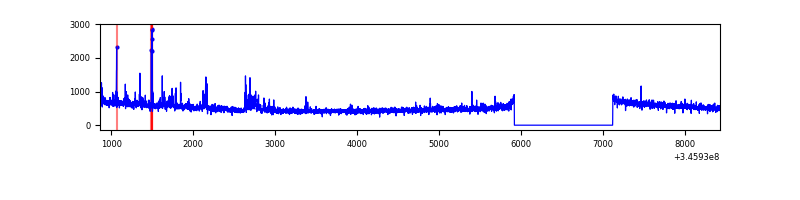 |
| D | 7564 | 6365 | 99 | 99 | 1.31% | 1.56% | 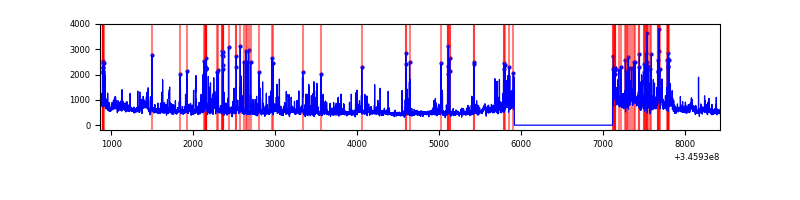 |
Top three noisy pixels from each quadrant. If the there are fewer than three noisy pixels in the level2.evt file, extra rows are filled as -1
| Pixel properties | Quadrant properties | ||||||
|---|---|---|---|---|---|---|---|
| Quadrant | DetID | PixID | Counts | Sigma | Mean | Median | Sigma |
| A | 8 | 192 | 12293 | 72.91 | 796 | 781 | 157.9 |
| A | 13 | 254 | 9969 | 58.2 | 796 | 781 | 157.9 |
| A | 3 | 137 | 7639 | 43.44 | 796 | 781 | 157.9 |
| B | 0 | 230 | 29251 | 190.61 | 798 | 778 | 149.4 |
| B | 12 | 111 | 17808 | 114.01 | 798 | 778 | 149.4 |
| B | 11 | 111 | 16648 | 106.24 | 798 | 778 | 149.4 |
| C | 3 | 233 | 174459 | 966.85 | 780 | 786 | 179.6 |
| C | 14 | 238 | 128215 | 709.41 | 780 | 786 | 179.6 |
| C | 13 | 61 | 5291 | 25.08 | 780 | 786 | 179.6 |
| D | 1 | 52 | 757417 | 4147.18 | 775 | 756 | 182.5 |
| D | 8 | 195 | 506382 | 2771.28 | 775 | 756 | 182.5 |
| D | 7 | 238 | 91782 | 498.9 | 775 | 756 | 182.5 |
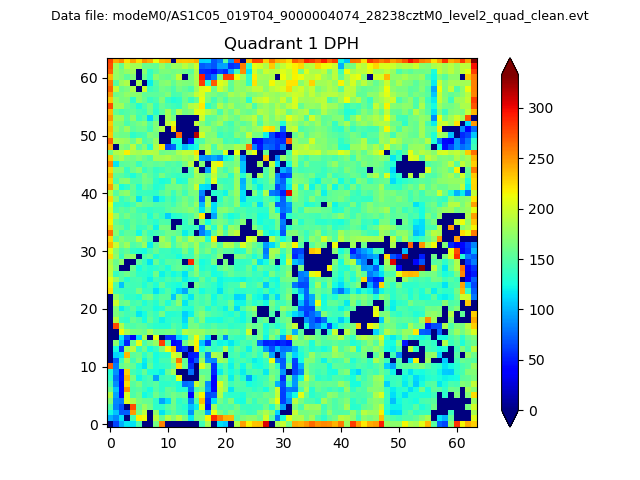
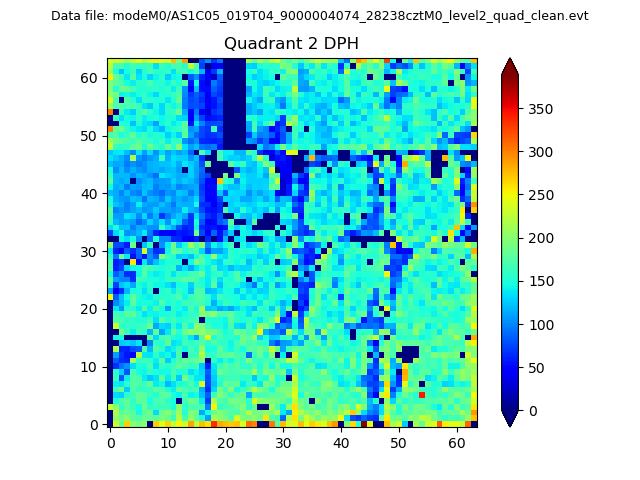
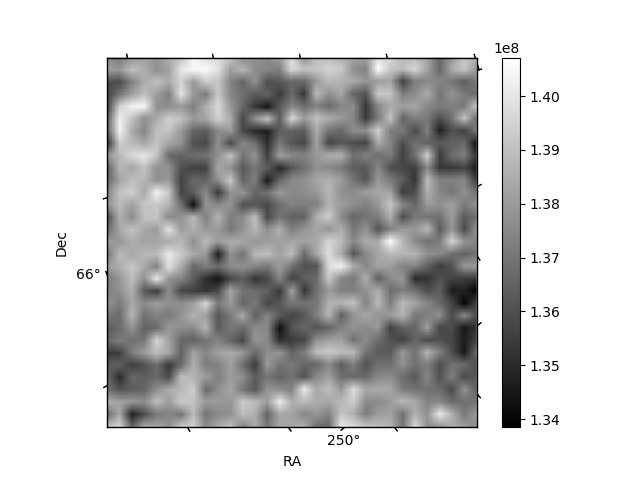
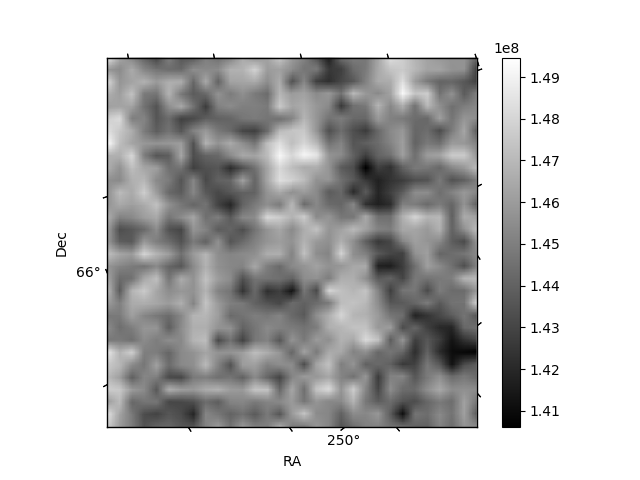
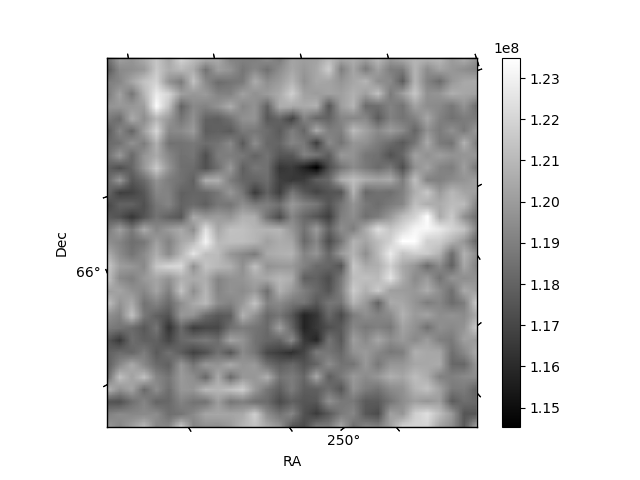
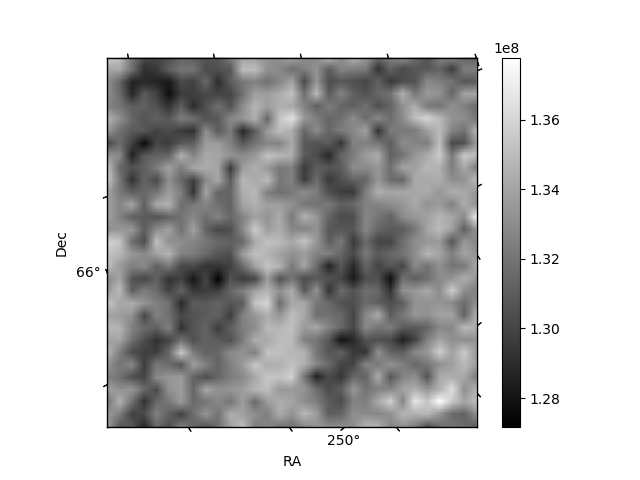
Histogram calculated using DETX and DETY for each event in the final _common_clean file
| Quadrant A |  |
 |
Quadrant B |
|---|---|---|---|
| Quadrant D |  |
 |
Quadrant C |
| Plot type | Count rate plots | Images |
|---|---|---|
| Comparison with Poisson distribution Blue bars denote a histogram of data divided into 1 sec bins. Red curve is a Poisson curve with rate = median count rate of data. |
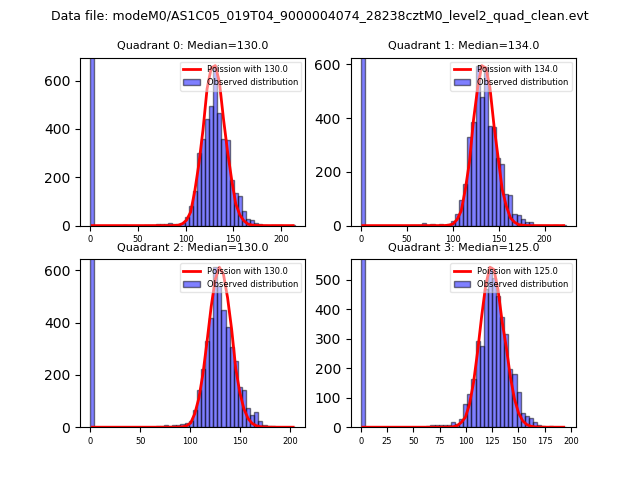 |
 |
| Quadrant-wise count rates Data is divided into 100 sec bins |
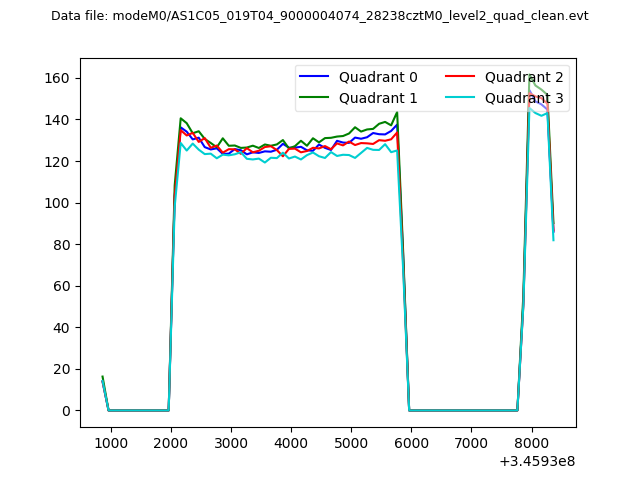 |
|
| Module-wise count rates for Quadrant A Data is divided into 100 sec bins |
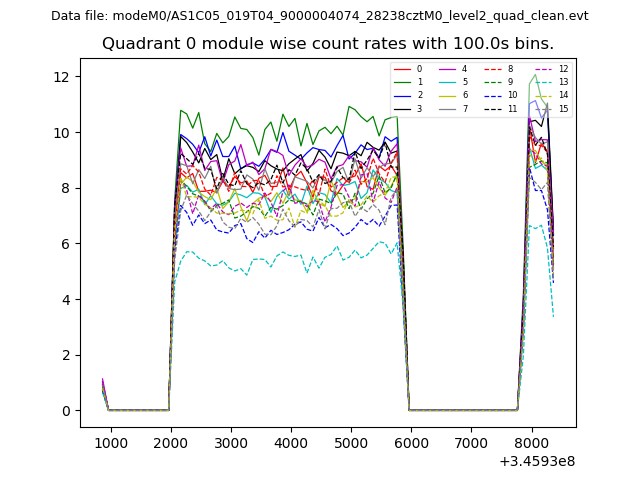 |
 |
| Module-wise count rates for Quadrant B Data is divided into 100 sec bins |
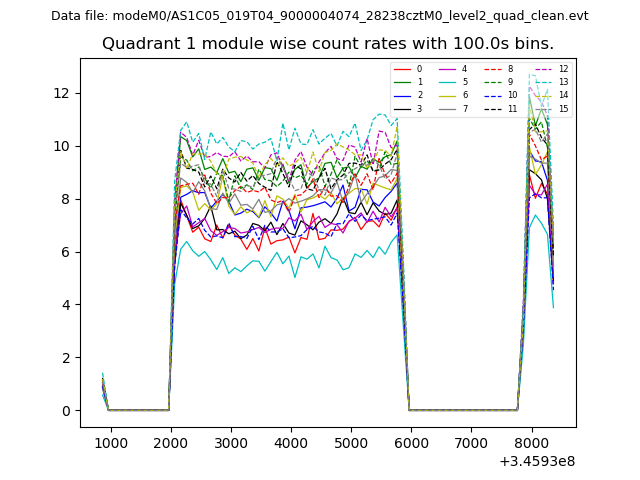 |
 |
| Module-wise count rates for Quadrant C Data is divided into 100 sec bins |
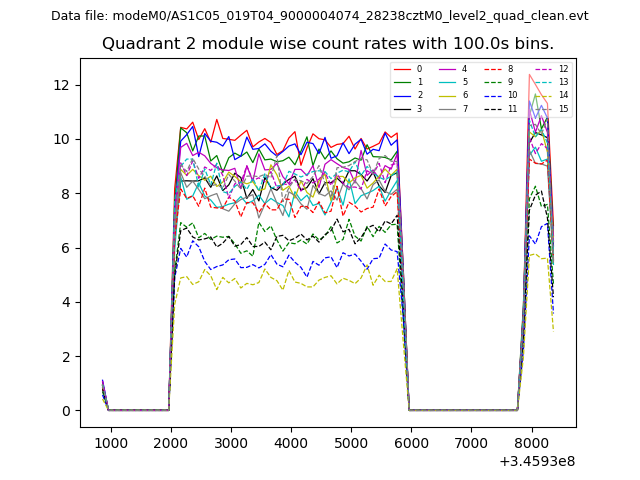 |
 |
| Module-wise count rates for Quadrant D Data is divided into 100 sec bins |
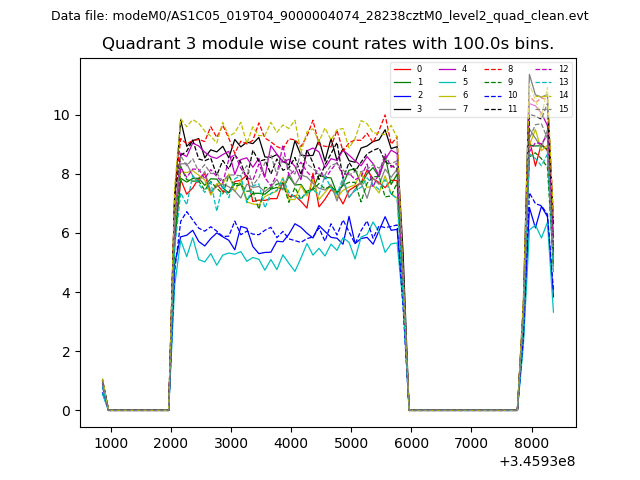 |
 |
| Parameter | Plot |
|---|---|
| CZT HV Monitor | 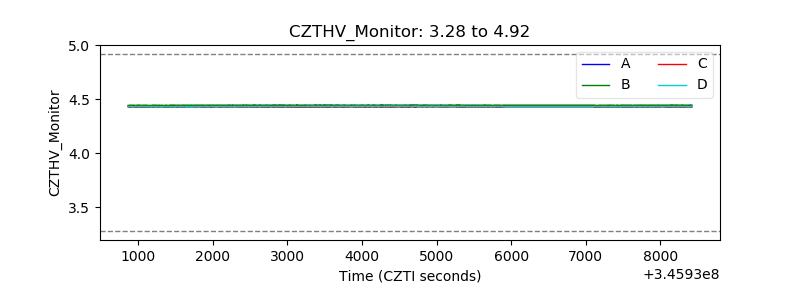 |
| D_VDD | 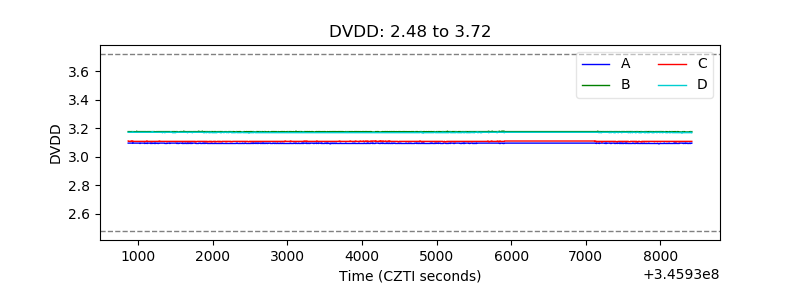 |
| Temperature 1 | 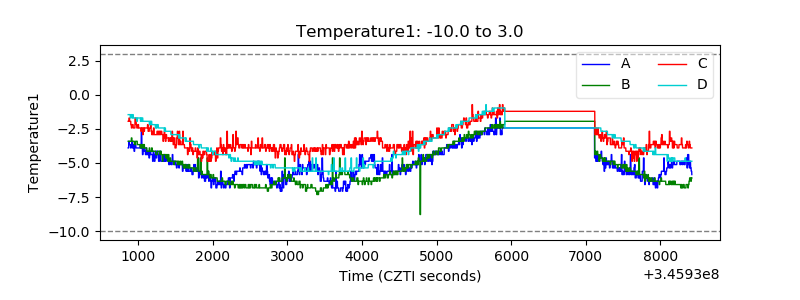 |
| Veto HV Monitor |  |
| Veto LLD | 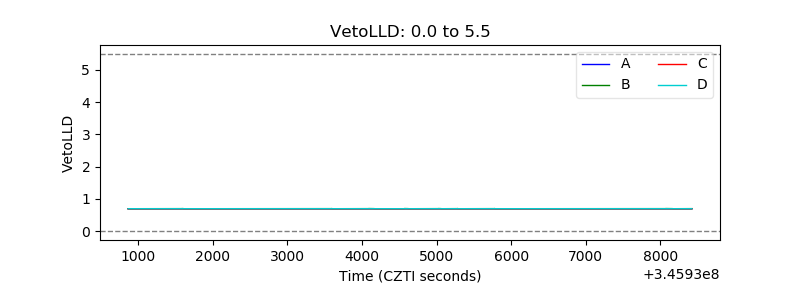 |
| Alpha Counter | 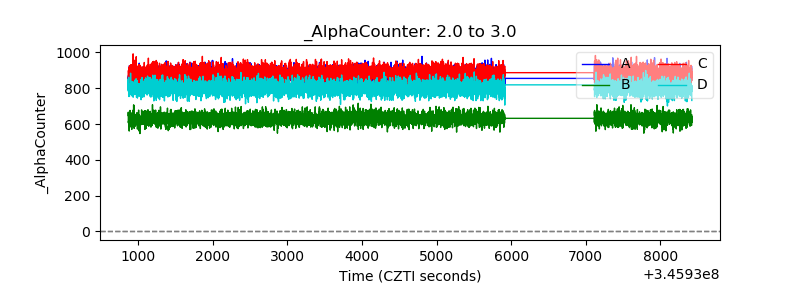 |
| _CPM_Rate | 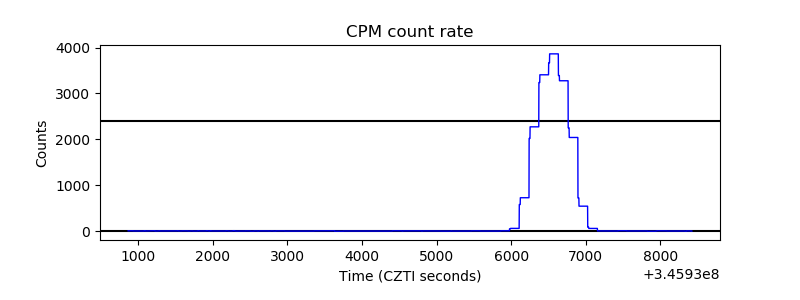 |
| CZT Counter |  |
| +2.5 Volts monitor |  |
| +5 Volts monitor |  |
| _ROLL_ROT | 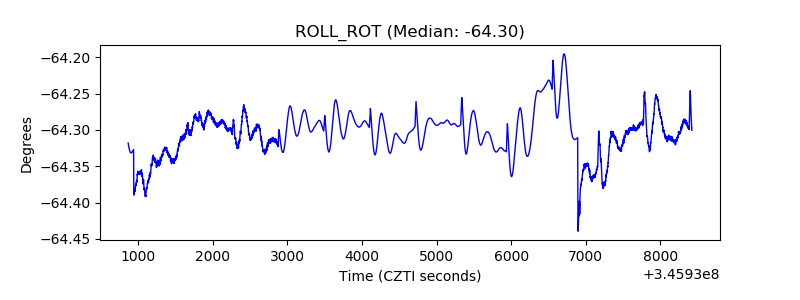 |
| _Roll_DEC | 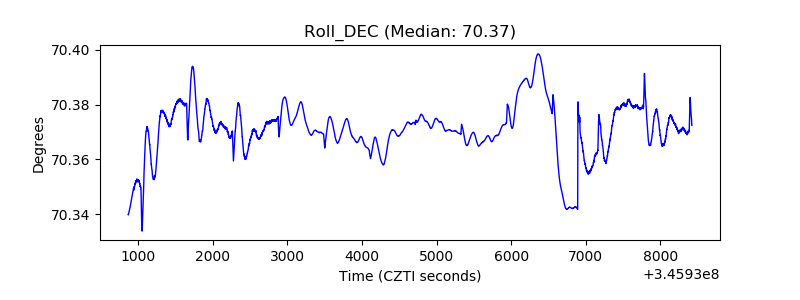 |
| _Roll_RA | 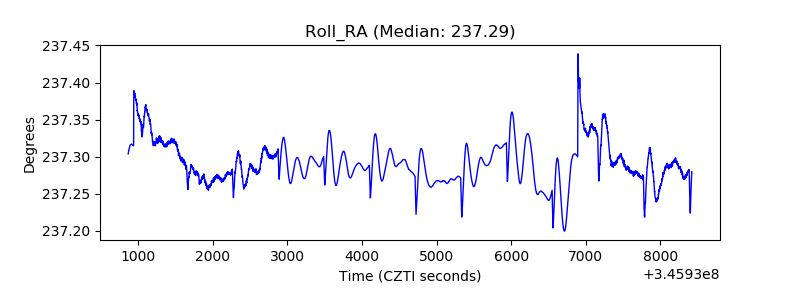 |
| Veto Counter | 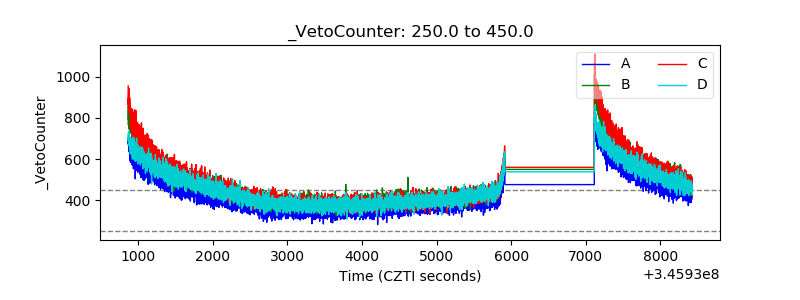 |