| Param | Original file | Final file |
|---|---|---|
| Filename | modeM0/AS1C05_019T04_9000004074_28240cztM0_level2.evt | modeM0/AS1C05_019T04_9000004074_28240cztM0_level2_quad_clean.evt |
| Size (bytes) | 495,469,440 | 130,887,360 |
| Size | 472.5 MB | 124.8 MB |
| Events in quadrant A | 3,285,575 | 891,071 |
| Events in quadrant B | 3,309,046 | 921,426 |
| Events in quadrant C | 3,329,644 | 873,367 |
| Events in quadrant D | 4,640,004 | 825,169 |
| Mode M9 | |||
|---|---|---|---|
| Quadrant | BADHDUFLAG | Total packets | Discarded packets |
| A | 0 | 20 | 0 |
| B | 0 | 21 | 0 |
| C | 0 | 21 | 0 |
| D | 0 | 21 | 0 |
| Mode M0 | |||
|---|---|---|---|
| Quadrant | BADHDUFLAG | Total packets | Discarded packets |
| A | 0 | 13952 | 0 |
| B | 0 | 13965 | 0 |
| C | 0 | 14084 | 0 |
| D | 0 | 18112 | 0 |
| Quadrant | Total seconds | Saturated seconds | Saturation percentage |
|---|---|---|---|
| A | 6505 | 37 | 0.568793% |
| B | 6505 | 57 | 0.876249% |
| C | 6505 | 88 | 1.352806% |
| D | 6505 | 252 | 3.873943% |
Noise dominated data is calculated using 1-second bins in cleaned event files. If a bin has >2000 counts, and if more than 50% of those come from <1% of pixels, then it is considered to be noise-dominated and hence unusable.
| Quadrant | # 1 sec bins | Bins with >0 counts | Bins with >2000 counts | High rate bins dominated by noise | Noise dominated (total time) | Noise dominated (detector-on time) | Marked lightcurve |
|---|---|---|---|---|---|---|---|
| A | 7820 | 6505 | 2 | 2 | 0.03% | 0.03% | 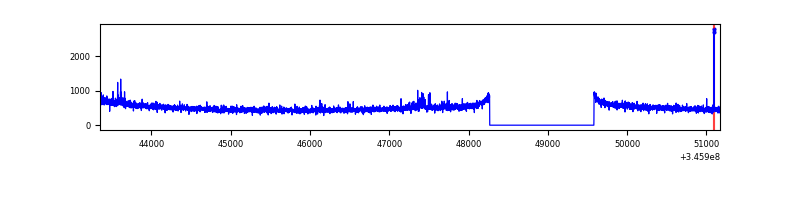 |
| B | 7820 | 6506 | 0 | 0 | 0.00% | 0.00% | 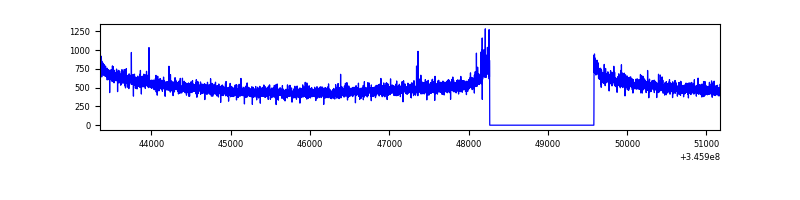 |
| C | 7820 | 6506 | 0 | 0 | 0.00% | 0.00% | 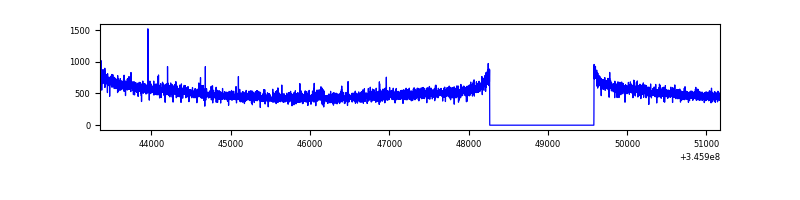 |
| D | 7820 | 6506 | 174 | 174 | 2.23% | 2.67% | 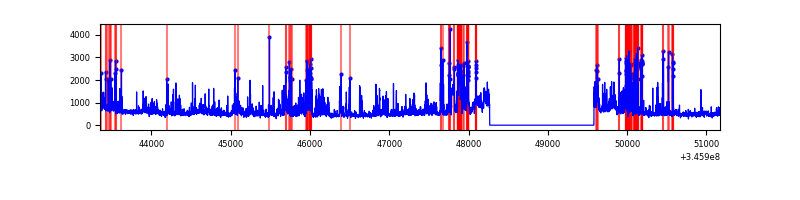 |
Top three noisy pixels from each quadrant. If the there are fewer than three noisy pixels in the level2.evt file, extra rows are filled as -1
| Pixel properties | Quadrant properties | ||||||
|---|---|---|---|---|---|---|---|
| Quadrant | DetID | PixID | Counts | Sigma | Mean | Median | Sigma |
| A | 12 | 96 | 25564 | 148.94 | 839 | 824 | 166.1 |
| A | 6 | 16 | 24760 | 144.1 | 839 | 824 | 166.1 |
| A | 13 | 254 | 10433 | 57.85 | 839 | 824 | 166.1 |
| B | 12 | 111 | 18526 | 113.21 | 841 | 824 | 156.4 |
| B | 11 | 111 | 16907 | 102.86 | 841 | 824 | 156.4 |
| B | 14 | 111 | 16105 | 97.73 | 841 | 824 | 156.4 |
| C | 14 | 238 | 135084 | 721.61 | 810 | 817 | 186.1 |
| C | 3 | 233 | 32883 | 172.34 | 810 | 817 | 186.1 |
| C | 13 | 61 | 5604 | 25.73 | 810 | 817 | 186.1 |
| D | 1 | 52 | 1054848 | 5658.45 | 794 | 774 | 186.3 |
| D | 7 | 238 | 208310 | 1114.09 | 794 | 774 | 186.3 |
| D | 8 | 195 | 188910 | 1009.94 | 794 | 774 | 186.3 |
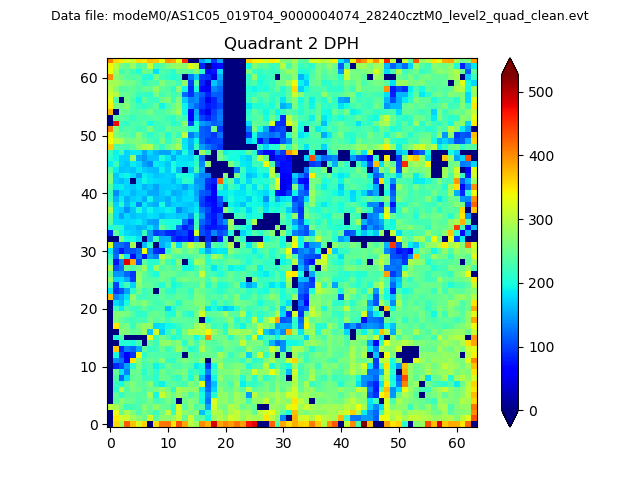
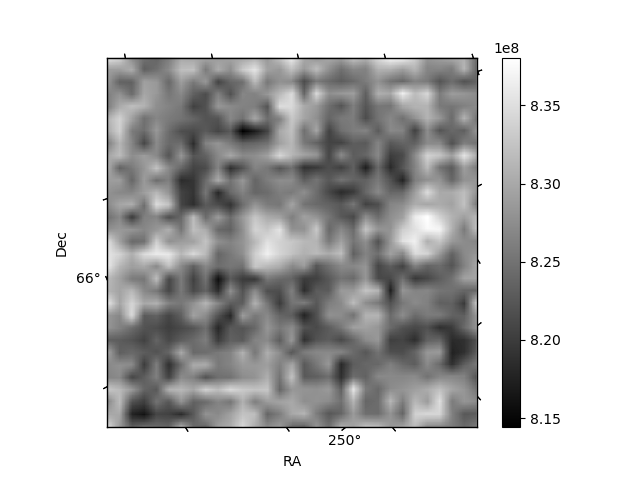
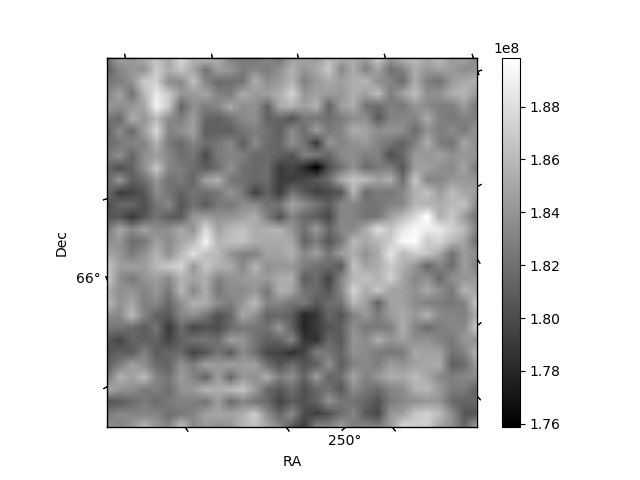
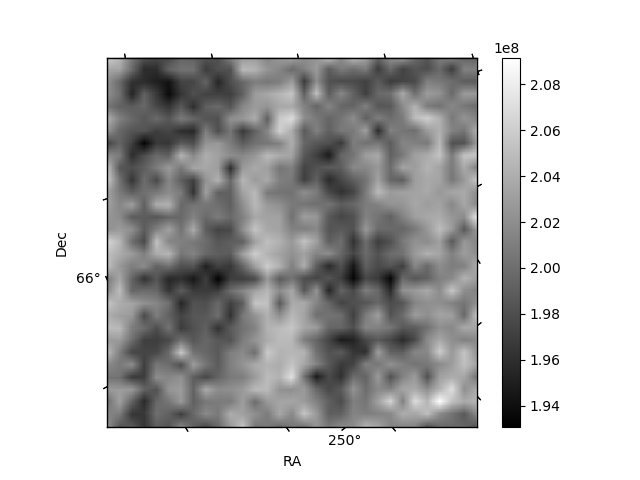
Histogram calculated using DETX and DETY for each event in the final _common_clean file
| Quadrant A | 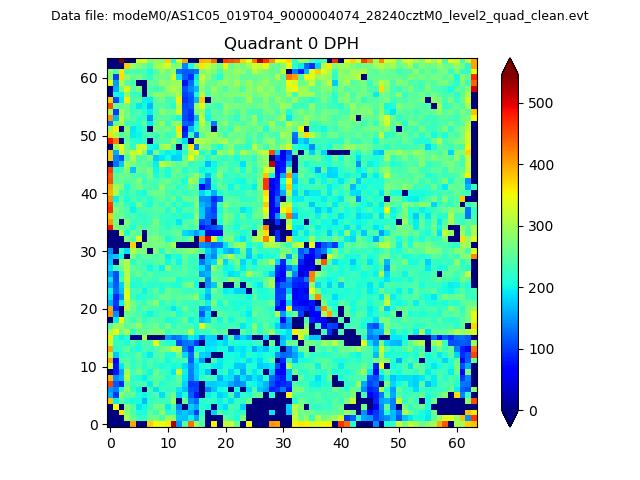 |
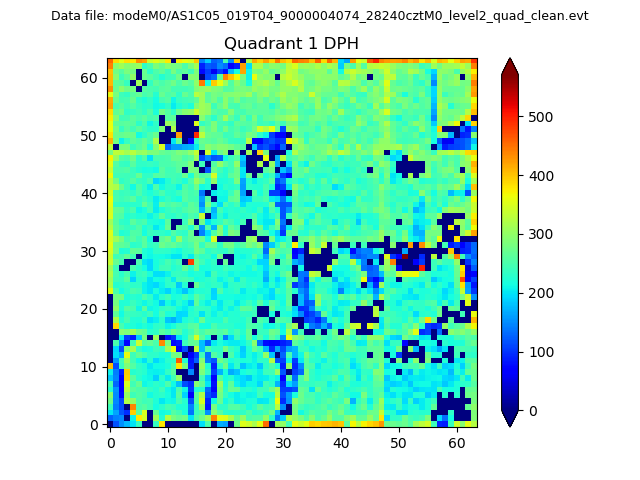 |
Quadrant B |
|---|---|---|---|
| Quadrant D | 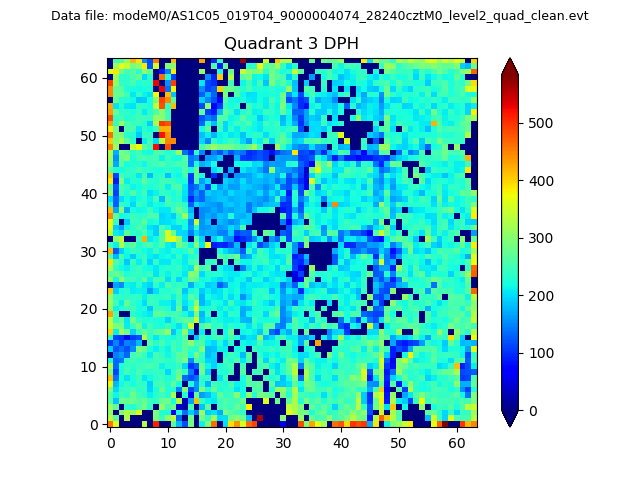 |
 |
Quadrant C |
| Plot type | Count rate plots | Images |
|---|---|---|
| Comparison with Poisson distribution Blue bars denote a histogram of data divided into 1 sec bins. Red curve is a Poisson curve with rate = median count rate of data. |
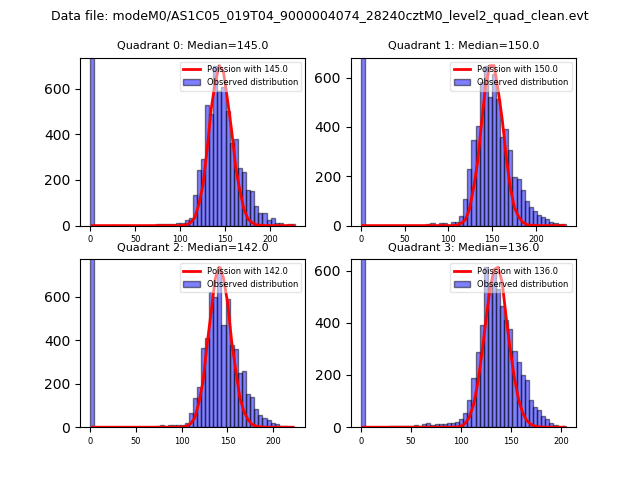 |
 |
| Quadrant-wise count rates Data is divided into 100 sec bins |
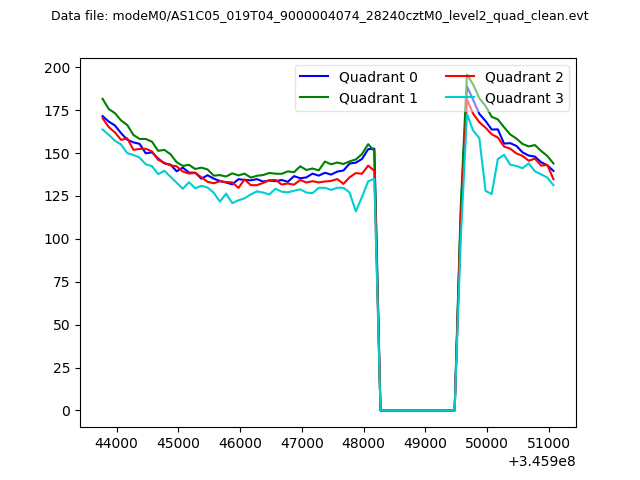 |
|
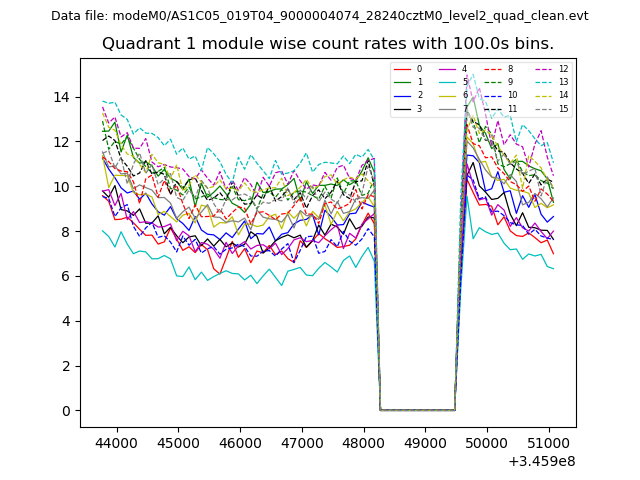
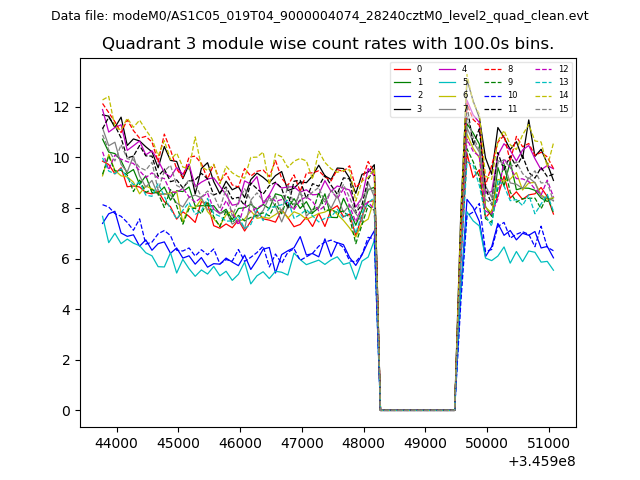
| Module-wise count rates for Quadrant A Data is divided into 100 sec bins |
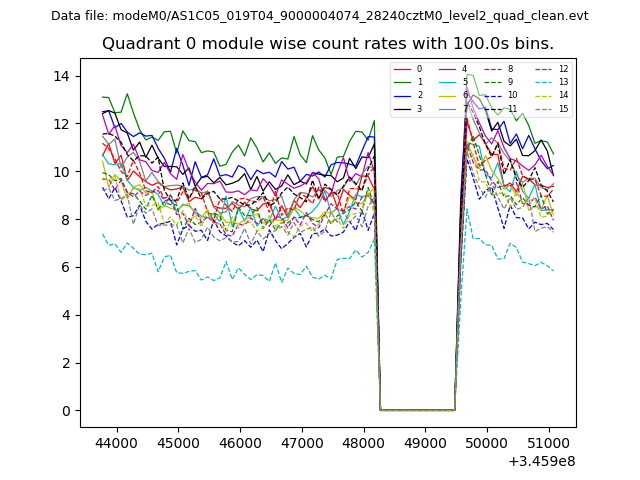 |
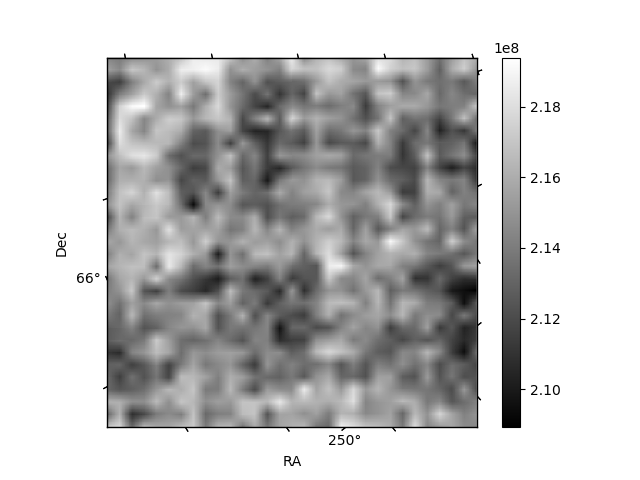 |
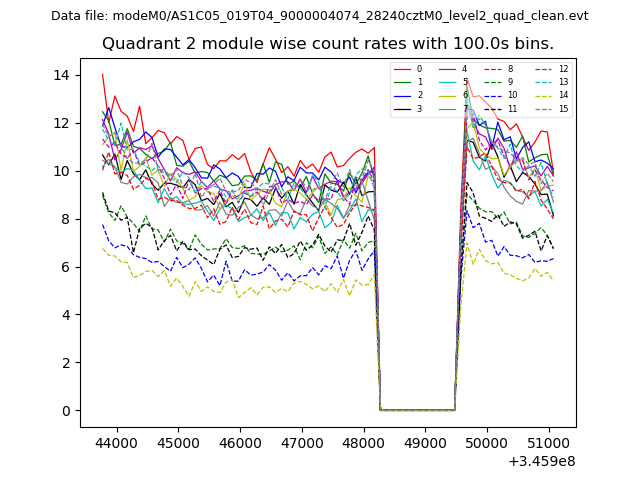
| Module-wise count rates for Quadrant B Data is divided into 100 sec bins |
 |
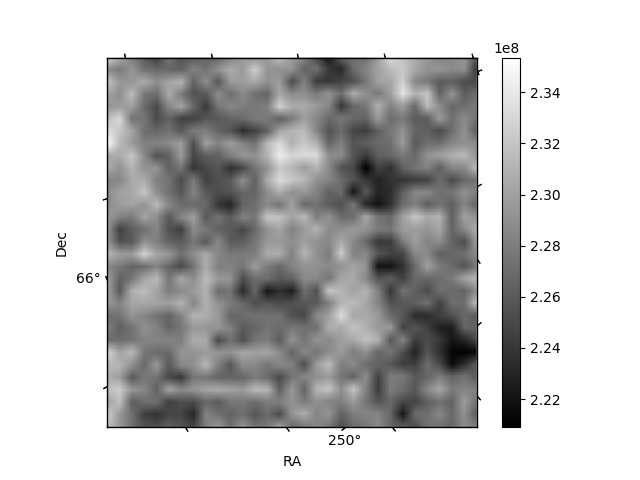 |
| Module-wise count rates for Quadrant C Data is divided into 100 sec bins |
 |
 |
| Module-wise count rates for Quadrant D Data is divided into 100 sec bins |
 |
 |
| Parameter | Plot |
|---|---|
| CZT HV Monitor | 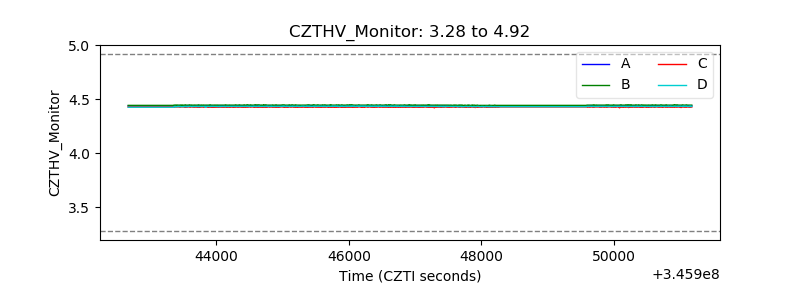 |
| D_VDD | 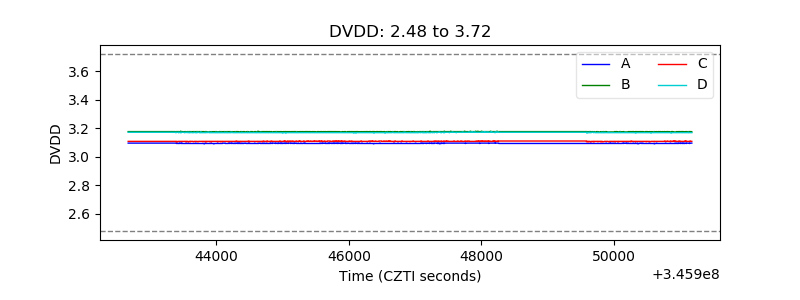 |
| Temperature 1 | 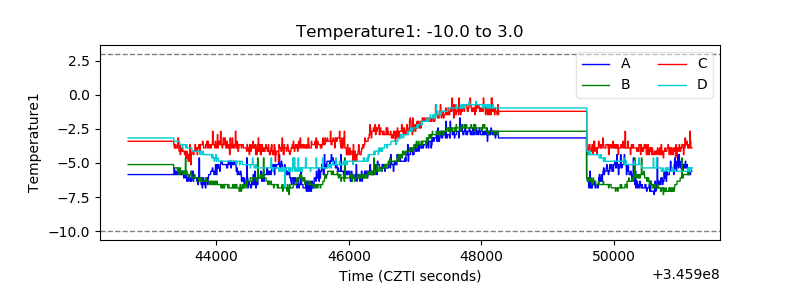 |
| Veto HV Monitor | 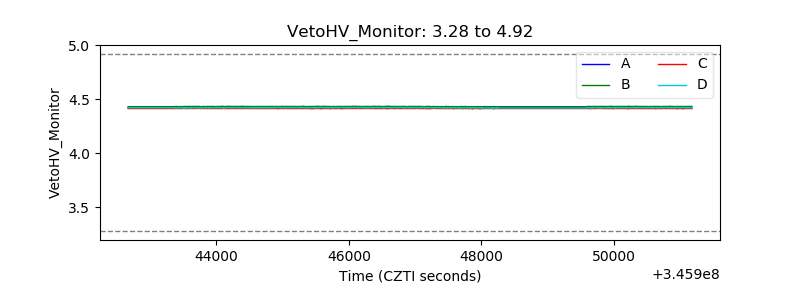 |
| Veto LLD | 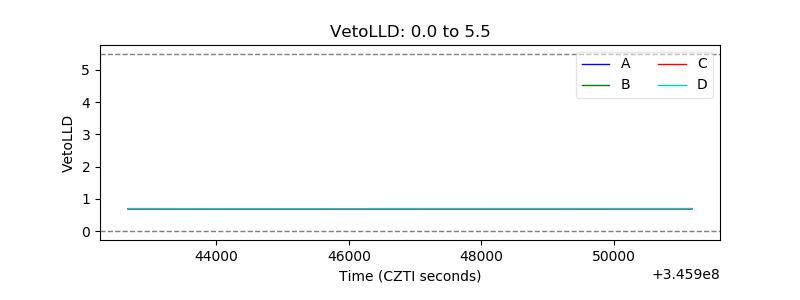 |
| Alpha Counter | 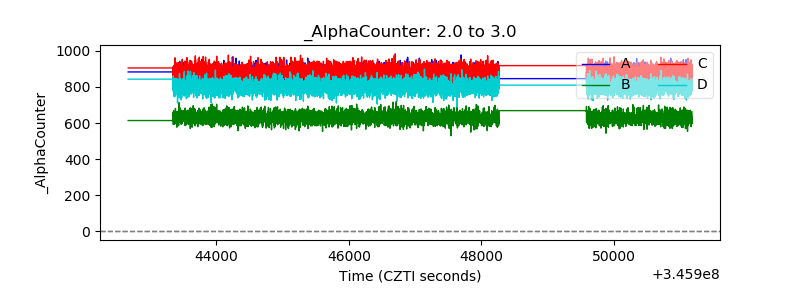 |
| _CPM_Rate | 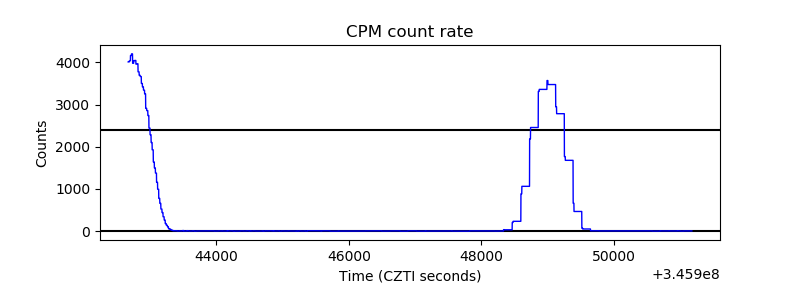 |
| CZT Counter | 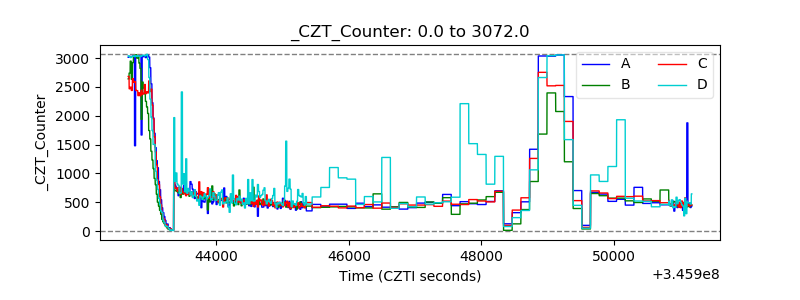 |
| +2.5 Volts monitor |  |
| +5 Volts monitor |  |
| _ROLL_ROT | 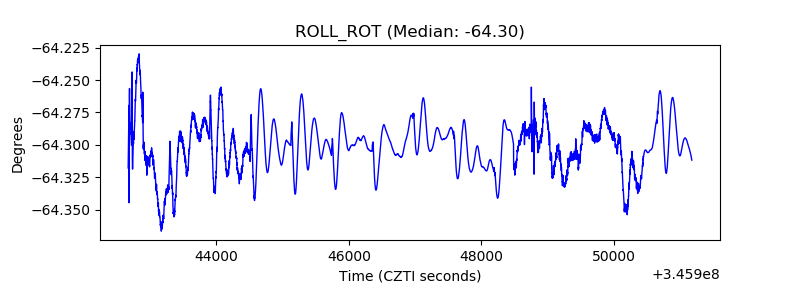 |
| _Roll_DEC | 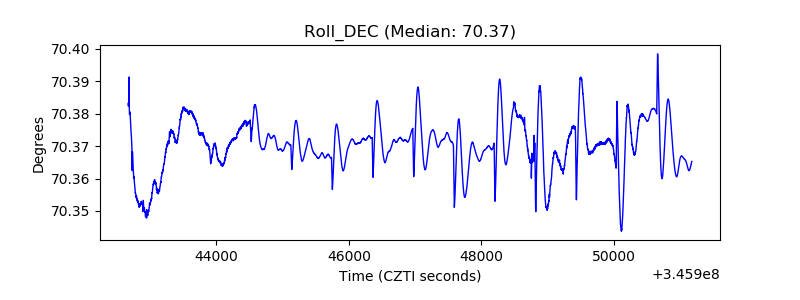 |
| _Roll_RA | 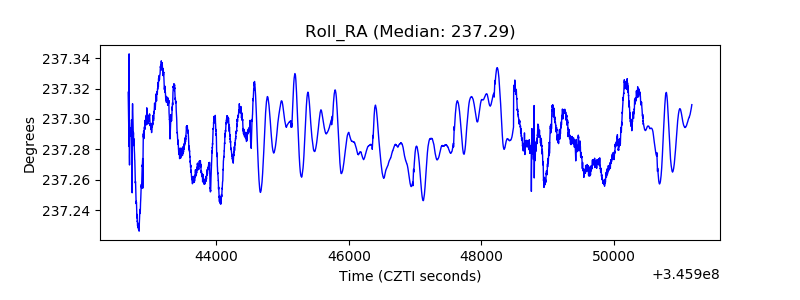 |
| Veto Counter | 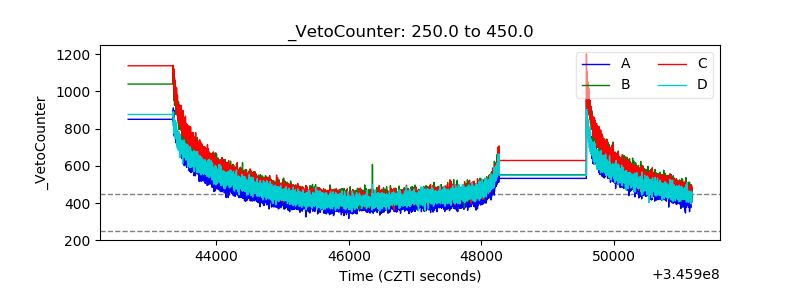 |