| Param | Original file | Final file |
|---|---|---|
| Filename | modeM0/AS1C05_019T04_9000004074_28241cztM0_level2.evt | modeM0/AS1C05_019T04_9000004074_28241cztM0_level2_quad_clean.evt |
| Size (bytes) | 423,469,440 | 108,028,800 |
| Size | 403.9 MB | 103.0 MB |
| Events in quadrant A | 2,683,797 | 739,955 |
| Events in quadrant B | 2,669,501 | 765,686 |
| Events in quadrant C | 2,672,313 | 719,309 |
| Events in quadrant D | 4,429,985 | 666,690 |
| Mode M9 | |||
|---|---|---|---|
| Quadrant | BADHDUFLAG | Total packets | Discarded packets |
| A | 0 | 13 | 0 |
| B | 0 | 13 | 0 |
| C | 0 | 13 | 0 |
| D | 0 | 13 | 0 |
| Mode M0 | |||
|---|---|---|---|
| Quadrant | BADHDUFLAG | Total packets | Discarded packets |
| A | 0 | 11434 | 0 |
| B | 0 | 11284 | 0 |
| C | 0 | 11375 | 0 |
| D | 0 | 16794 | 0 |
| Quadrant | Total seconds | Saturated seconds | Saturation percentage |
|---|---|---|---|
| A | 5431 | 38 | 0.699687% |
| B | 5432 | 54 | 0.994109% |
| C | 5432 | 74 | 1.362297% |
| D | 5432 | 440 | 8.100147% |
Noise dominated data is calculated using 1-second bins in cleaned event files. If a bin has >2000 counts, and if more than 50% of those come from <1% of pixels, then it is considered to be noise-dominated and hence unusable.
| Quadrant | # 1 sec bins | Bins with >0 counts | Bins with >2000 counts | High rate bins dominated by noise | Noise dominated (total time) | Noise dominated (detector-on time) | Marked lightcurve |
|---|---|---|---|---|---|---|---|
| A | 6726 | 5431 | 2 | 2 | 0.03% | 0.04% | 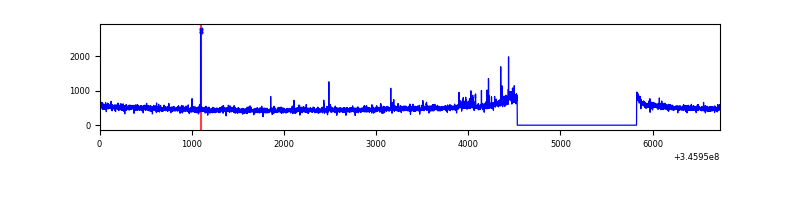 |
| B | 6727 | 5433 | 0 | 0 | 0.00% | 0.00% | 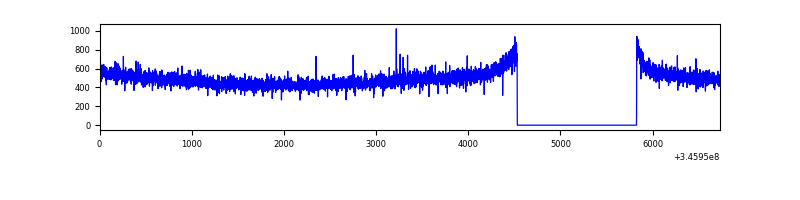 |
| C | 6727 | 5432 | 1 | 1 | 0.01% | 0.02% |  |
| D | 6727 | 5433 | 375 | 375 | 5.57% | 6.90% | 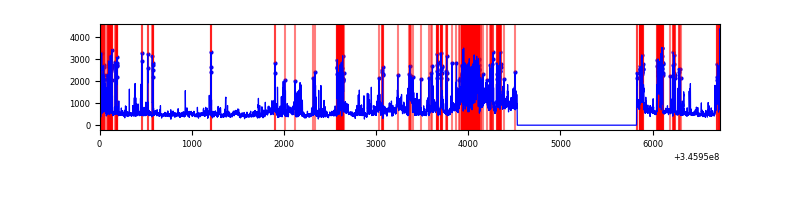 |
Top three noisy pixels from each quadrant. If the there are fewer than three noisy pixels in the level2.evt file, extra rows are filled as -1
| Pixel properties | Quadrant properties | ||||||
|---|---|---|---|---|---|---|---|
| Quadrant | DetID | PixID | Counts | Sigma | Mean | Median | Sigma |
| A | 12 | 96 | 40227 | 295.42 | 680 | 668 | 133.9 |
| A | 1 | 113 | 16970 | 121.74 | 680 | 668 | 133.9 |
| A | 13 | 254 | 8235 | 56.51 | 680 | 668 | 133.9 |
| B | 12 | 111 | 15223 | 114.08 | 679 | 663 | 127.6 |
| B | 11 | 111 | 13786 | 102.82 | 679 | 663 | 127.6 |
| B | 14 | 111 | 13290 | 98.94 | 679 | 663 | 127.6 |
| C | 14 | 238 | 107599 | 711.6 | 650 | 653 | 150.3 |
| C | 2 | 16 | 25617 | 166.11 | 650 | 653 | 150.3 |
| C | 3 | 233 | 7417 | 45.01 | 650 | 653 | 150.3 |
| D | 1 | 52 | 1761666 | 11936.39 | 627 | 610 | 147.5 |
| D | 8 | 195 | 125511 | 846.58 | 627 | 610 | 147.5 |
| D | 5 | 222 | 88610 | 596.46 | 627 | 610 | 147.5 |
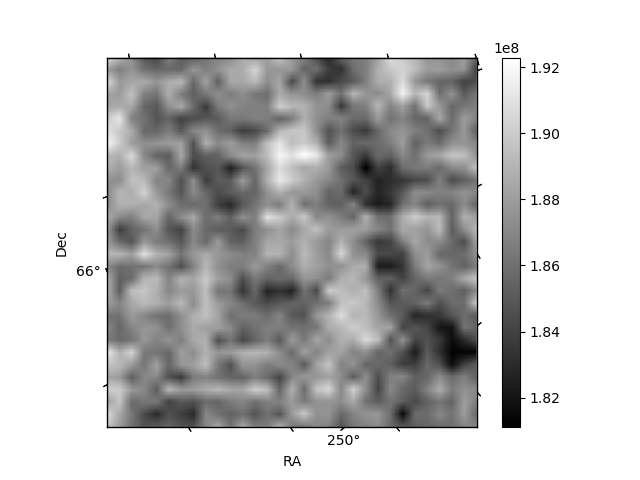
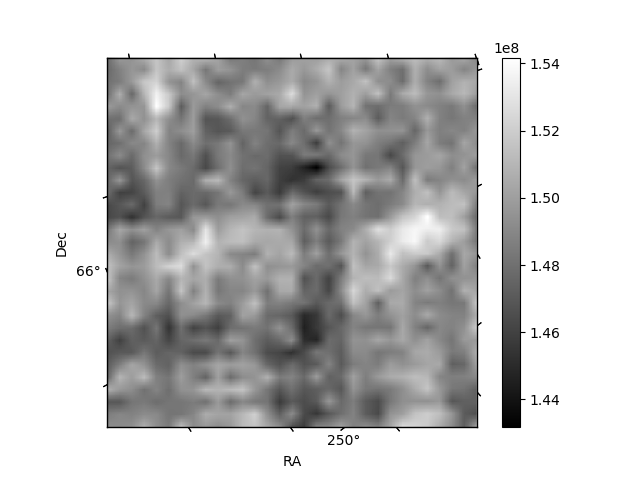
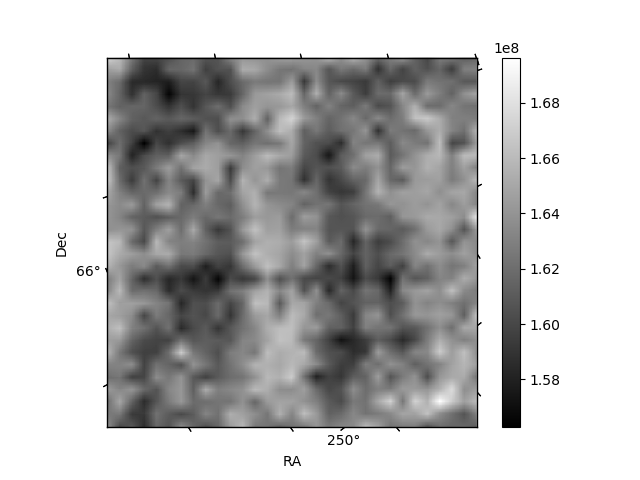
Histogram calculated using DETX and DETY for each event in the final _common_clean file
| Quadrant A | 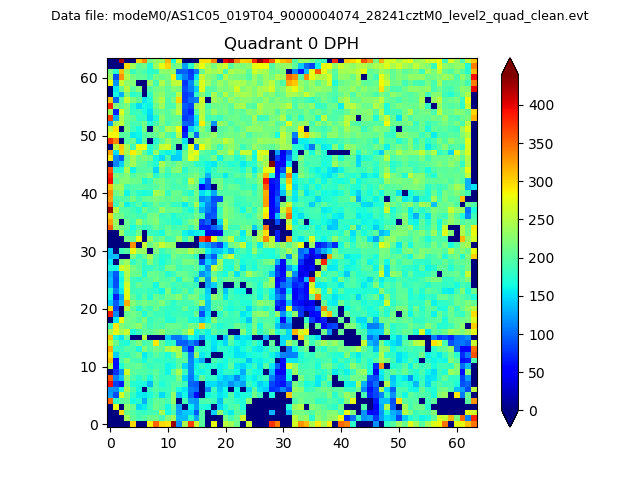 |
 |
Quadrant B |
|---|---|---|---|
| Quadrant D |  |
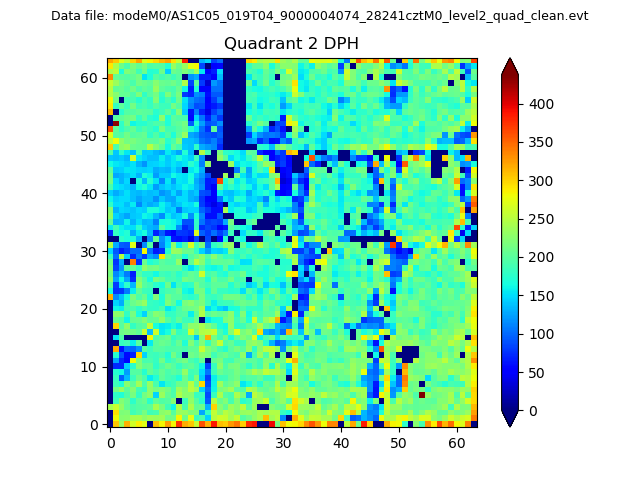 |
Quadrant C |
| Plot type | Count rate plots | Images |
|---|---|---|
| Comparison with Poisson distribution Blue bars denote a histogram of data divided into 1 sec bins. Red curve is a Poisson curve with rate = median count rate of data. |
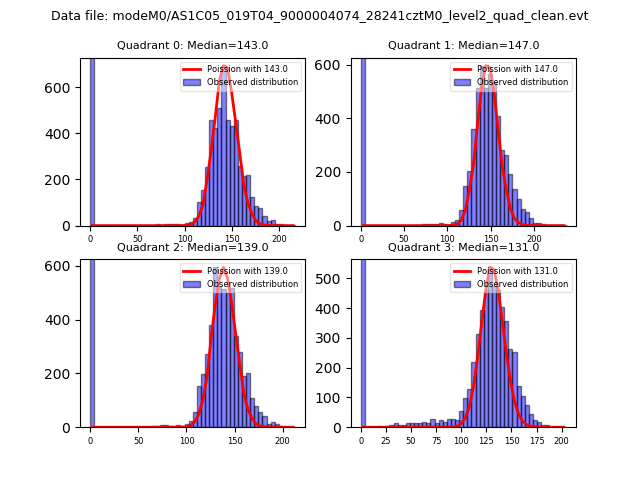 |
 |
| Quadrant-wise count rates Data is divided into 100 sec bins |
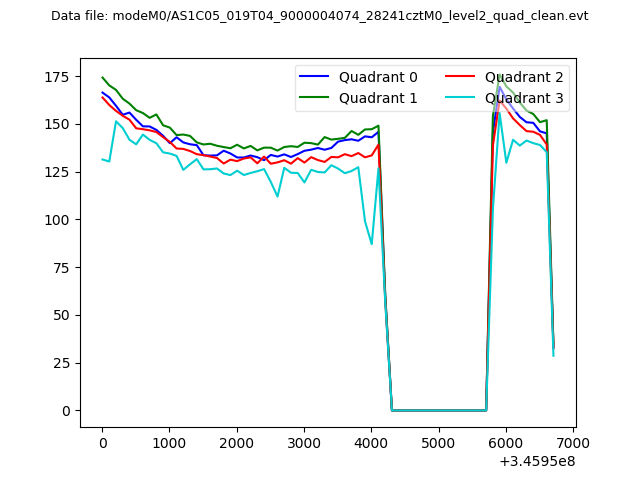 |
|
| Module-wise count rates for Quadrant A Data is divided into 100 sec bins |
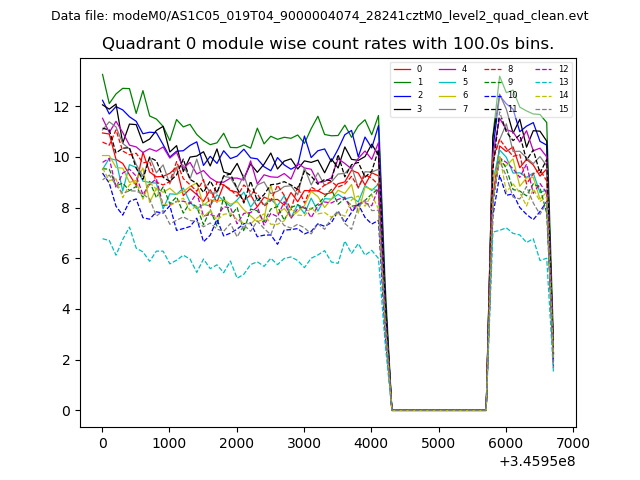 |
 |
| Module-wise count rates for Quadrant B Data is divided into 100 sec bins |
 |
 |
| Module-wise count rates for Quadrant C Data is divided into 100 sec bins |
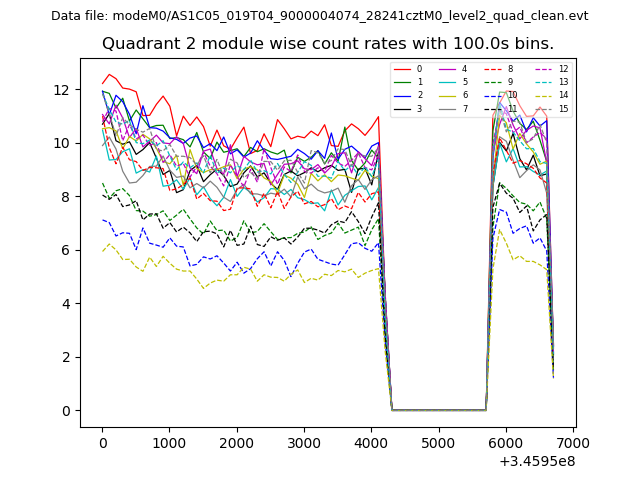 |
 |
| Module-wise count rates for Quadrant D Data is divided into 100 sec bins |
 |
 |
| Parameter | Plot |
|---|---|
| CZT HV Monitor | 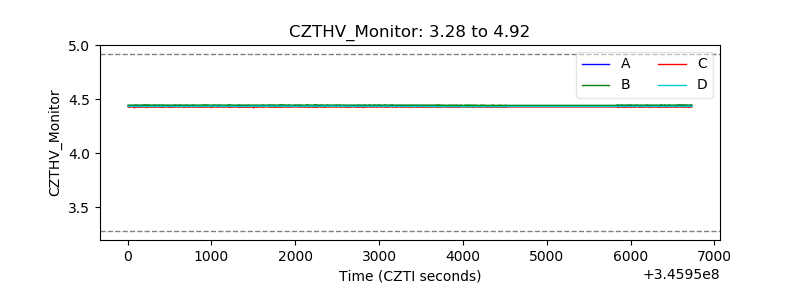 |
| D_VDD | 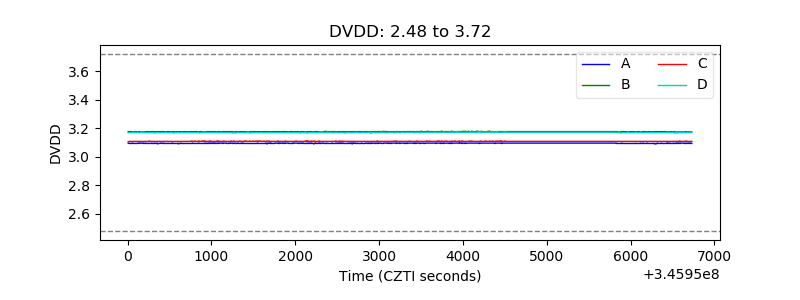 |
| Temperature 1 | 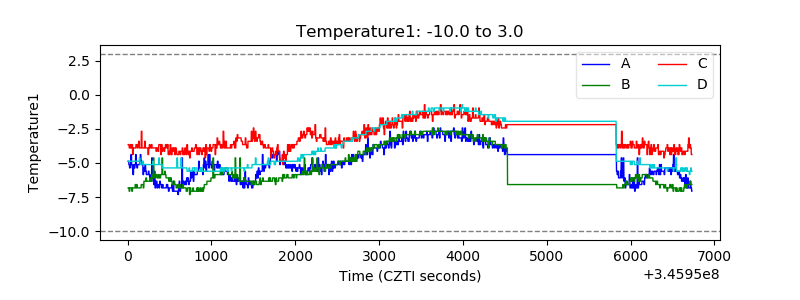 |
| Veto HV Monitor | 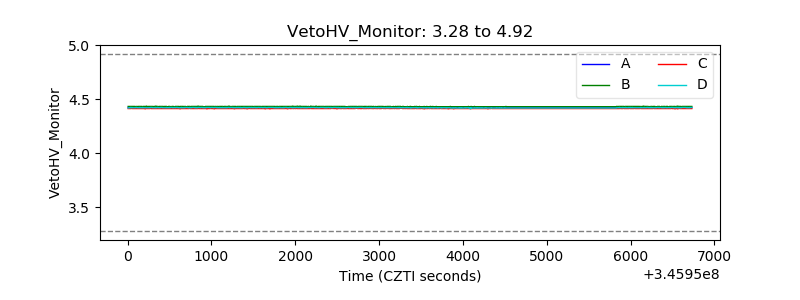 |
| Veto LLD | 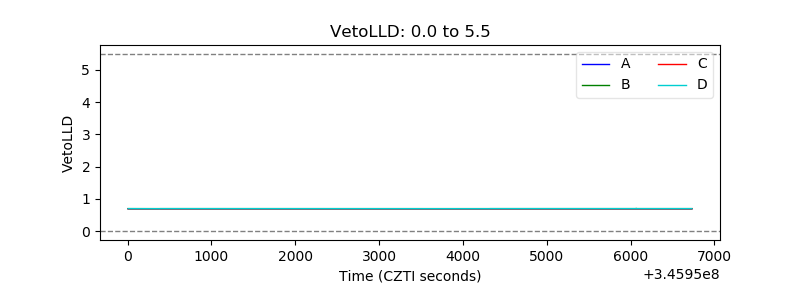 |
| Alpha Counter | 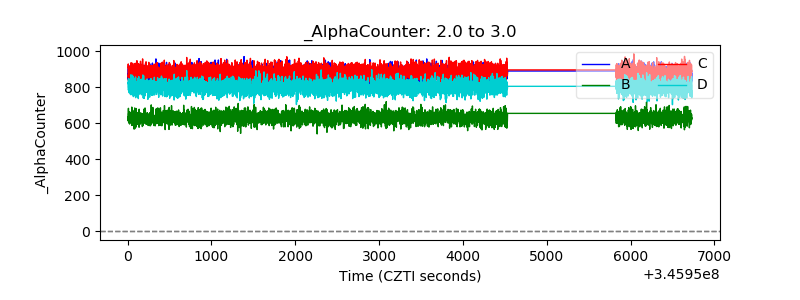 |
| _CPM_Rate | 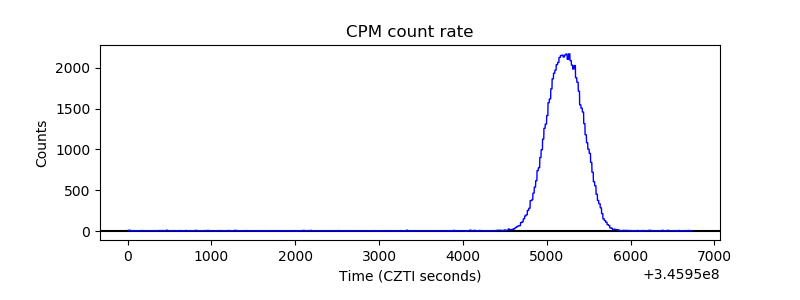 |
| CZT Counter | 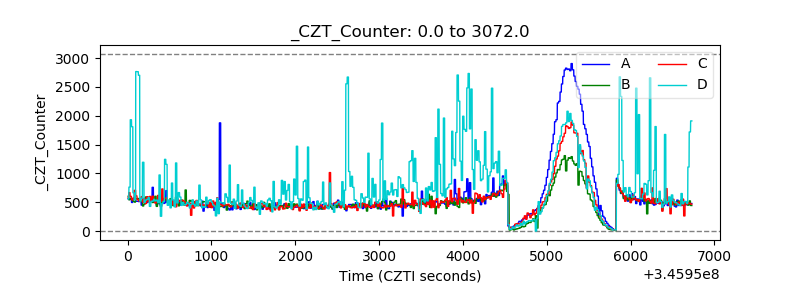 |
| +2.5 Volts monitor |  |
| +5 Volts monitor |  |
| _ROLL_ROT | 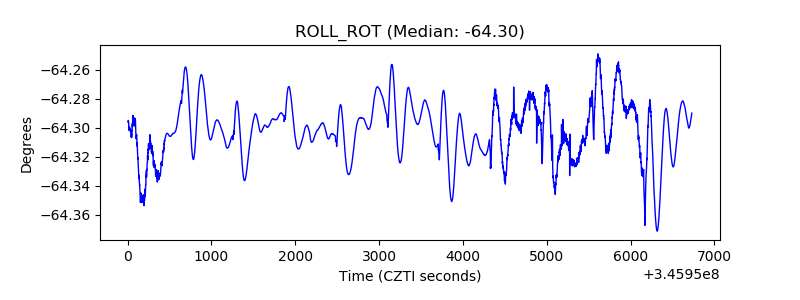 |
| _Roll_DEC | 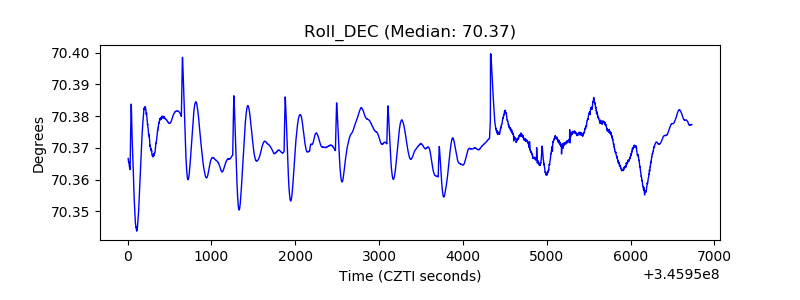 |
| _Roll_RA | 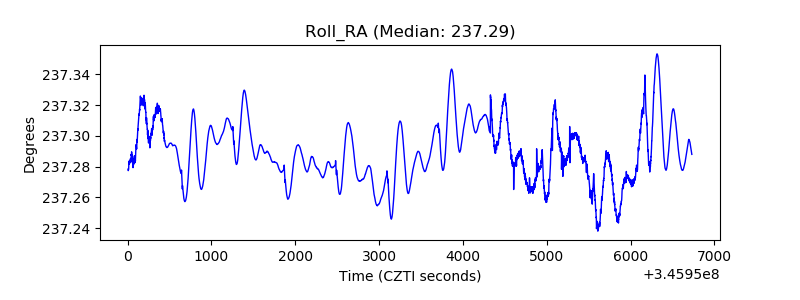 |
| Veto Counter | 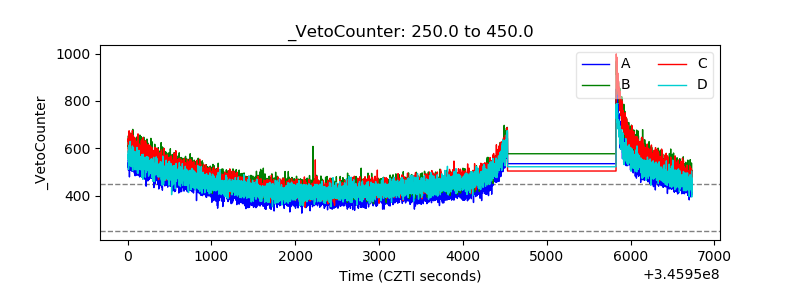 |