| Param | Original file | Final file |
|---|---|---|
| Filename | modeM0/AS1A10_067T01_9000004076cztM0_level2.fits | modeM0/AS1A10_067T01_9000004076cztM0_level2_quad_clean.evt |
| Size (bytes) | 177,341,760 | 142,963,200 |
| Size | 169.1 MB | 136.3 MB |
| Events in quadrant A | 1,107,562 | 816,483 |
| Events in quadrant B | 1,057,416 | 816,885 |
| Events in quadrant C | 1,067,592 | 768,162 |
| Events in quadrant D | 893,742 | 683,166 |
| Mode M0 | |||
|---|---|---|---|
| Quadrant | BADHDUFLAG | Total packets | Discarded packets |
| A | 0 | 37435 | 0 |
| B | 0 | 37449 | 0 |
| C | 0 | 37494 | 0 |
| D | 0 | 62270 | 0 |
| Mode SS | |||
|---|---|---|---|
| Quadrant | BADHDUFLAG | Total packets | Discarded packets |
| A | 0 | 374 | 0 |
| B | 0 | 374 | 0 |
| C | 0 | 374 | 0 |
| D | 0 | 374 | 0 |
| Mode M9 | |||
|---|---|---|---|
| Quadrant | BADHDUFLAG | Total packets | Discarded packets |
| A | 0 | 31 | 0 |
| B | 0 | 28 | 0 |
| C | 0 | 31 | 0 |
| D | 0 | 30 | 0 |
| Quadrant | Total seconds | Saturated seconds | Saturation percentage |
|---|---|---|---|
| A | 18040 | 319 | 1.768293% |
| B | 18040 | 324 | 1.796009% |
| C | 18035 | 373 | 2.068201% |
| D | 18023 | 2215 | 12.289852% |
Noise dominated data is calculated using 1-second bins in cleaned event files. If a bin has >2000 counts, and if more than 50% of those come from <1% of pixels, then it is considered to be noise-dominated and hence unusable.
| Quadrant | # 1 sec bins | Bins with >0 counts | Bins with >2000 counts | High rate bins dominated by noise | Noise dominated (total time) | Noise dominated (detector-on time) | Marked lightcurve |
|---|---|---|---|---|---|---|---|
| A | 18326 | 16310 | 0 | 0 | 0.00% | 0.00% |  |
| B | 18326 | 16309 | 0 | 0 | 0.00% | 0.00% |  |
| C | 18326 | 16310 | 0 | 0 | 0.00% | 0.00% | 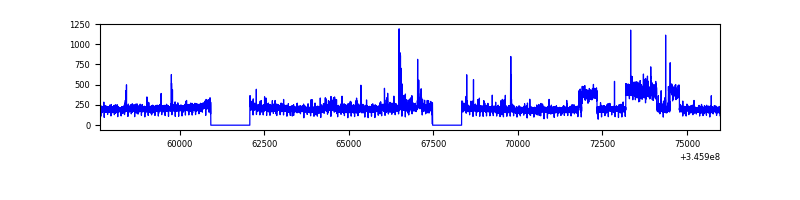 |
| D | 18326 | 16290 | 0 | 0 | 0.00% | 0.00% | 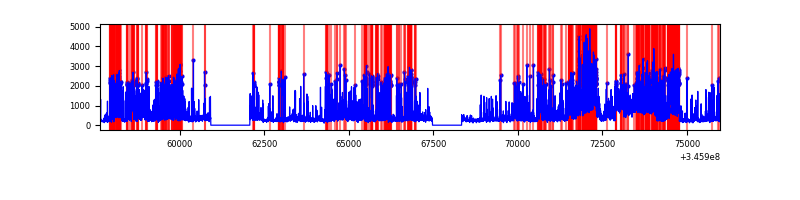 |
Top three noisy pixels from each quadrant. If the there are fewer than three noisy pixels in the level2.evt file, extra rows are filled as -1
| Pixel properties | Quadrant properties | ||||||
|---|---|---|---|---|---|---|---|
| Quadrant | DetID | PixID | Counts | Sigma | Mean | Median | Sigma |
| A | 0 | 29 | 902 | 8.68 | 288 | 270 | 72.8 |
| A | 7 | 110 | 891 | 8.53 | 288 | 270 | 72.8 |
| A | 14 | 95 | 859 | 8.09 | 288 | 270 | 72.8 |
| B | 2 | 9 | 839 | 10.05 | 279 | 266 | 57.0 |
| B | 2 | 8 | 732 | 8.18 | 279 | 266 | 57.0 |
| B | 5 | 128 | 728 | 8.11 | 279 | 266 | 57.0 |
| C | 12 | 241 | 755 | 6.86 | 281 | 263 | 71.7 |
| C | 3 | 126 | 749 | 6.78 | 281 | 263 | 71.7 |
| C | 9 | 209 | 721 | 6.39 | 281 | 263 | 71.7 |
| D | 3 | 14 | 691 | 6.63 | 254 | 231 | 69.4 |
| D | 4 | 246 | 686 | 6.56 | 254 | 231 | 69.4 |
| D | 7 | 3 | 641 | 5.91 | 254 | 231 | 69.4 |
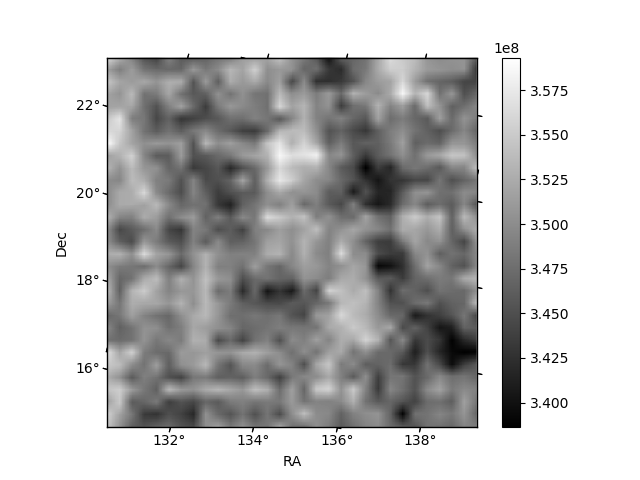
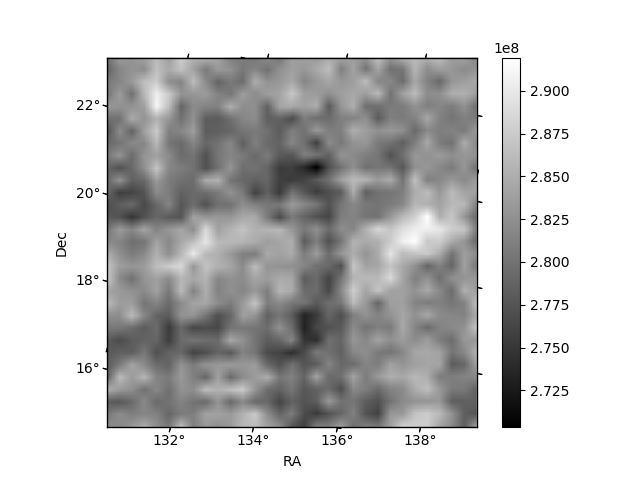
Histogram calculated using DETX and DETY for each event in the final _common_clean file
| Quadrant A |  |
 |
Quadrant B |
|---|---|---|---|
| Quadrant D |  |
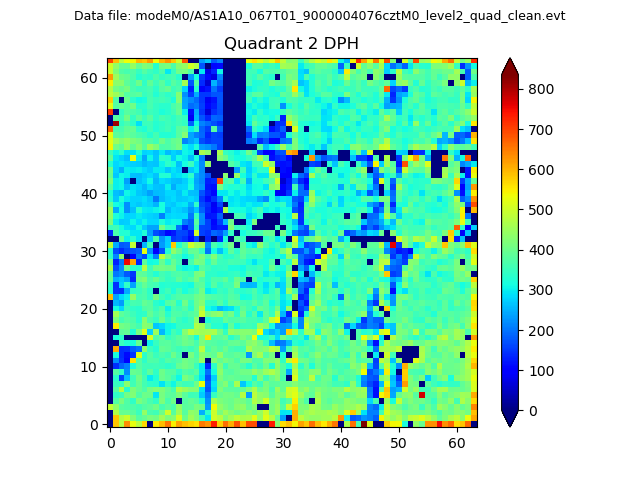 |
Quadrant C |
| Plot type | Count rate plots | Images |
|---|---|---|
| Comparison with Poisson distribution Blue bars denote a histogram of data divided into 1 sec bins. Red curve is a Poisson curve with rate = median count rate of data. |
 |
 |
| Quadrant-wise count rates Data is divided into 100 sec bins |
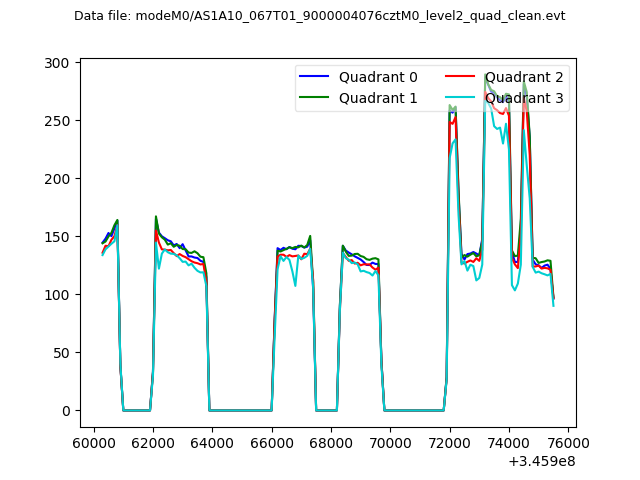 |
|
| Module-wise count rates for Quadrant A Data is divided into 100 sec bins |
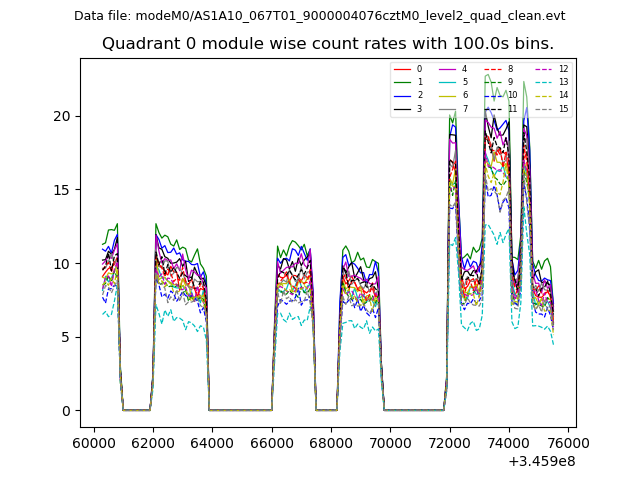 |
 |
| Module-wise count rates for Quadrant B Data is divided into 100 sec bins |
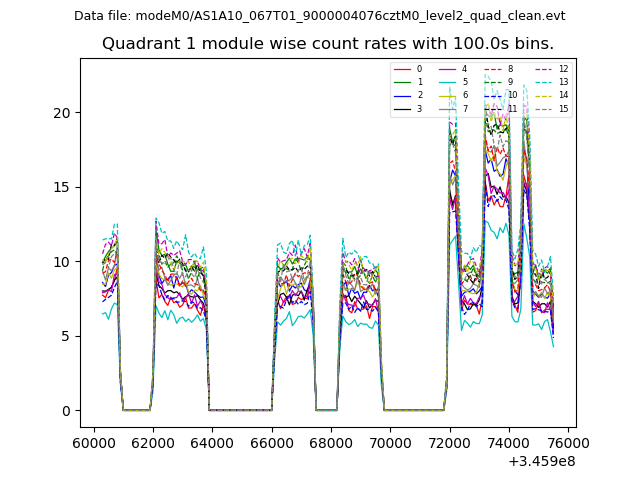 |
 |
| Module-wise count rates for Quadrant C Data is divided into 100 sec bins |
 |
 |
| Module-wise count rates for Quadrant D Data is divided into 100 sec bins |
 |
 |
| Parameter | Plot |
|---|---|
| CZT HV Monitor |  |
| D_VDD |  |
| Temperature 1 | 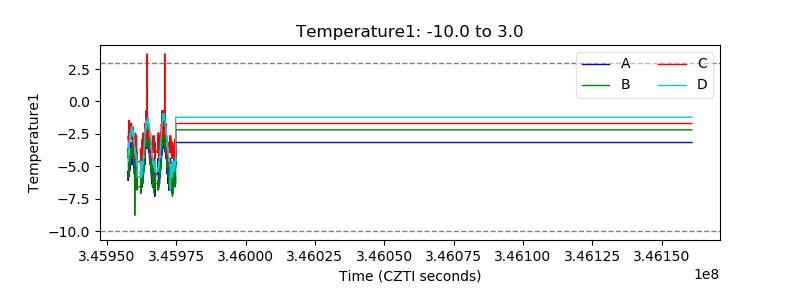 |
| Veto HV Monitor | 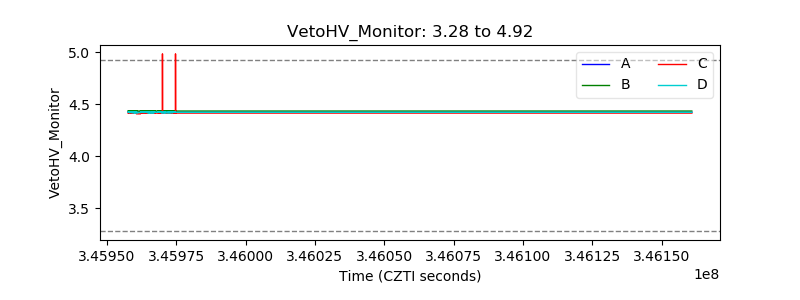 |
| Veto LLD |  |
| Alpha Counter |  |
| _CPM_Rate |  |
| CZT Counter | 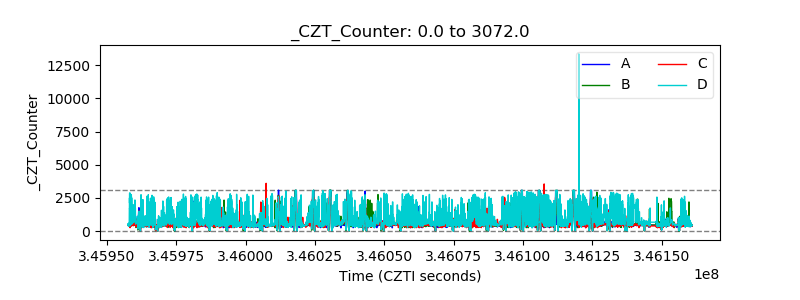 |
| +2.5 Volts monitor |  |
| +5 Volts monitor |  |
| _ROLL_ROT |  |
| _Roll_DEC |  |
| _Roll_RA | 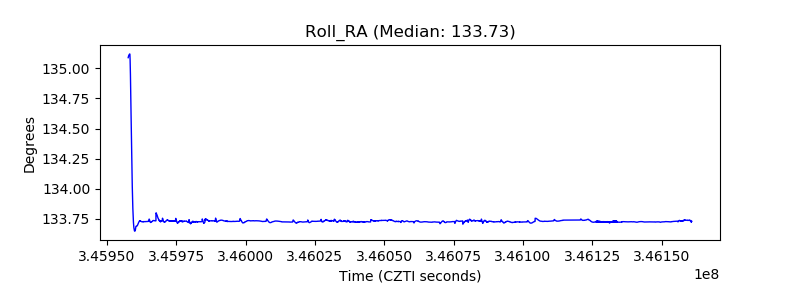 |
| Veto Counter | 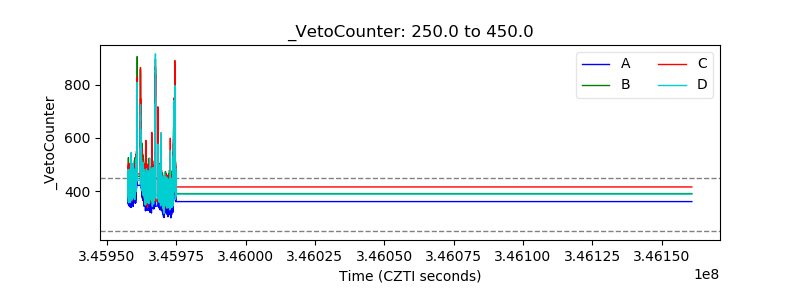 |