| Param | Original file | Final file |
|---|---|---|
| Filename | modeM0/AS1A10_067T01_9000004076_28243cztM0_level2.evt | modeM0/AS1A10_067T01_9000004076_28243cztM0_level2_quad_clean.evt |
| Size (bytes) | 512,657,280 | 95,869,440 |
| Size | 488.9 MB | 91.4 MB |
| Events in quadrant A | 3,347,161 | 624,283 |
| Events in quadrant B | 3,316,677 | 630,325 |
| Events in quadrant C | 3,365,661 | 598,212 |
| Events in quadrant D | 5,036,001 | 577,587 |
| Mode M0 | |||
|---|---|---|---|
| Quadrant | BADHDUFLAG | Total packets | Discarded packets |
| A | 0 | 14073 | 0 |
| B | 0 | 13951 | 0 |
| C | 0 | 14099 | 0 |
| D | 0 | 19342 | 0 |
| Mode M9 | |||
|---|---|---|---|
| Quadrant | BADHDUFLAG | Total packets | Discarded packets |
| A | 0 | 11 | 0 |
| B | 0 | 12 | 0 |
| C | 0 | 12 | 0 |
| D | 0 | 12 | 0 |
| Quadrant | Total seconds | Saturated seconds | Saturation percentage |
|---|---|---|---|
| A | 6783 | 97 | 1.430046% |
| B | 6783 | 93 | 1.371075% |
| C | 6782 | 101 | 1.489236% |
| D | 6782 | 409 | 6.030669% |
Noise dominated data is calculated using 1-second bins in cleaned event files. If a bin has >2000 counts, and if more than 50% of those come from <1% of pixels, then it is considered to be noise-dominated and hence unusable.
| Quadrant | # 1 sec bins | Bins with >0 counts | Bins with >2000 counts | High rate bins dominated by noise | Noise dominated (total time) | Noise dominated (detector-on time) | Marked lightcurve |
|---|---|---|---|---|---|---|---|
| A | 7643 | 6783 | 1 | 1 | 0.01% | 0.01% | 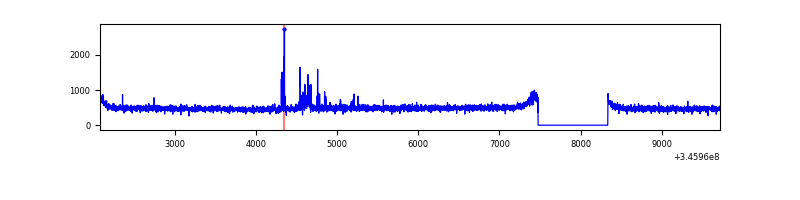 |
| B | 7643 | 6783 | 1 | 1 | 0.01% | 0.01% | 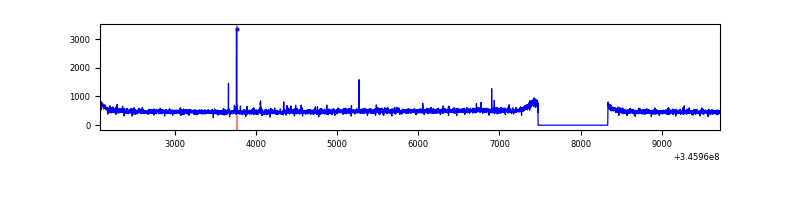 |
| C | 7642 | 6782 | 0 | 0 | 0.00% | 0.00% | 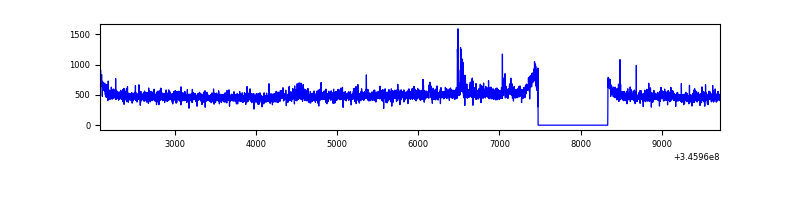 |
| D | 7642 | 6782 | 338 | 338 | 4.42% | 4.98% | 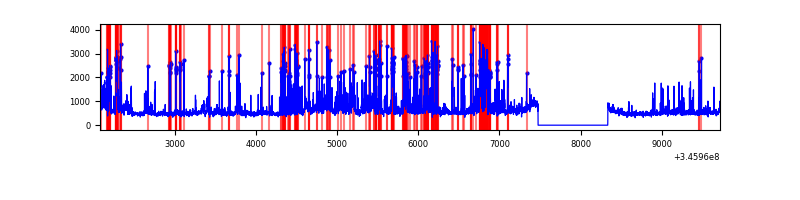 |
Top three noisy pixels from each quadrant. If the there are fewer than three noisy pixels in the level2.evt file, extra rows are filled as -1
| Pixel properties | Quadrant properties | ||||||
|---|---|---|---|---|---|---|---|
| Quadrant | DetID | PixID | Counts | Sigma | Mean | Median | Sigma |
| A | 12 | 96 | 75267 | 438.77 | 847 | 830 | 169.6 |
| A | 13 | 254 | 10239 | 55.46 | 847 | 830 | 169.6 |
| A | 3 | 137 | 8243 | 43.7 | 847 | 830 | 169.6 |
| B | 12 | 111 | 20070 | 120.08 | 835 | 812 | 160.4 |
| B | 11 | 111 | 18461 | 110.04 | 835 | 812 | 160.4 |
| B | 14 | 111 | 17226 | 102.34 | 835 | 812 | 160.4 |
| C | 14 | 238 | 129638 | 684.54 | 806 | 809 | 188.2 |
| C | 3 | 233 | 46137 | 240.85 | 806 | 809 | 188.2 |
| C | 2 | 16 | 44304 | 231.11 | 806 | 809 | 188.2 |
| D | 1 | 52 | 1498278 | 7804.3 | 805 | 785 | 191.9 |
| D | 8 | 195 | 280388 | 1457.17 | 805 | 785 | 191.9 |
| D | 7 | 238 | 135768 | 703.47 | 805 | 785 | 191.9 |
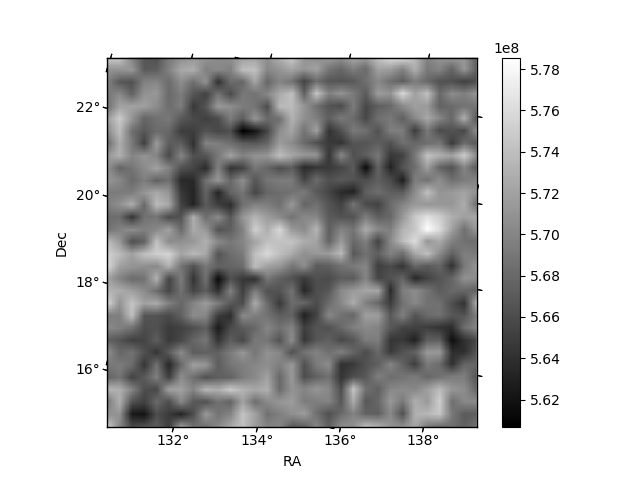
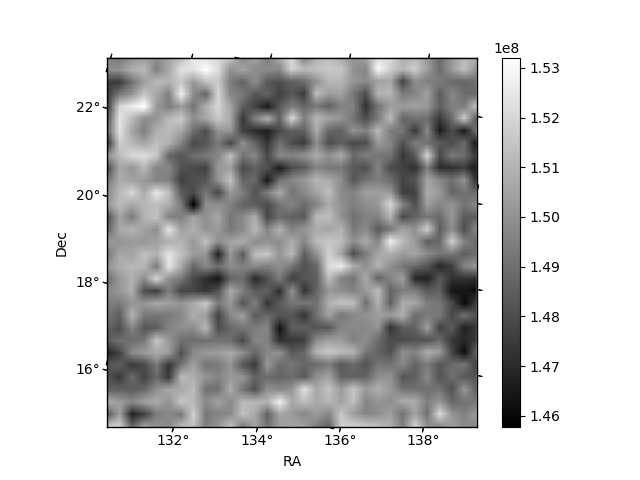
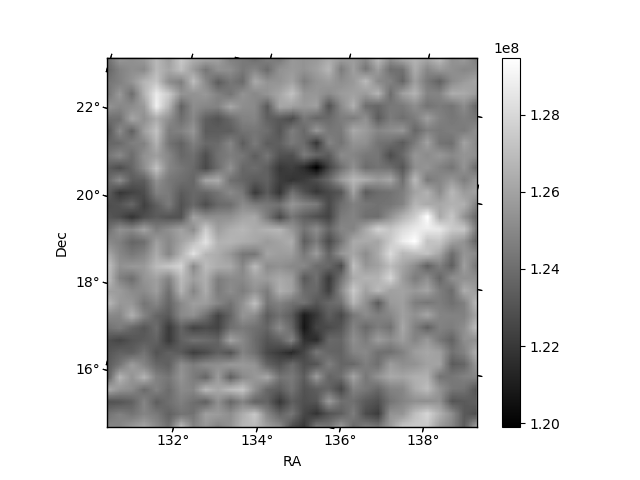
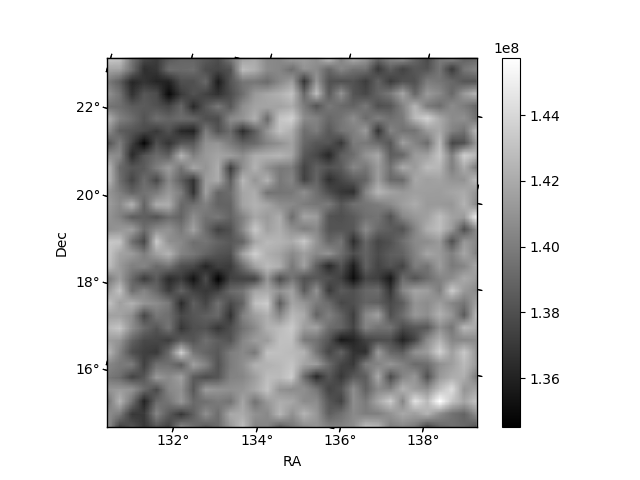
Histogram calculated using DETX and DETY for each event in the final _common_clean file
| Quadrant A | 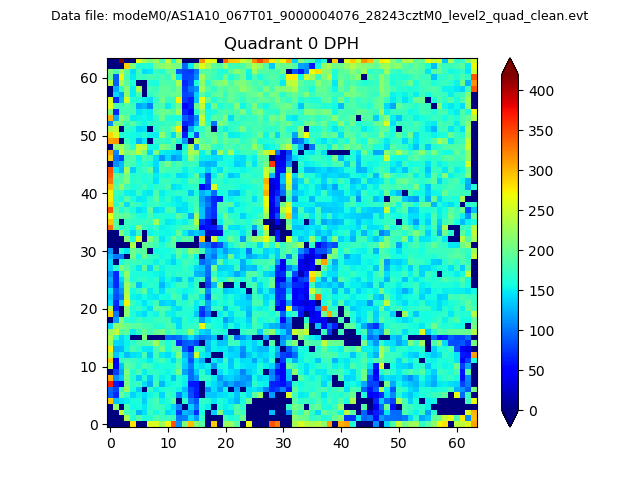 |
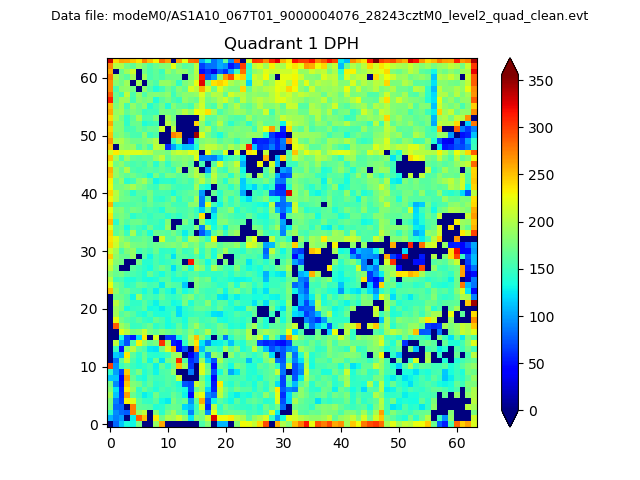 |
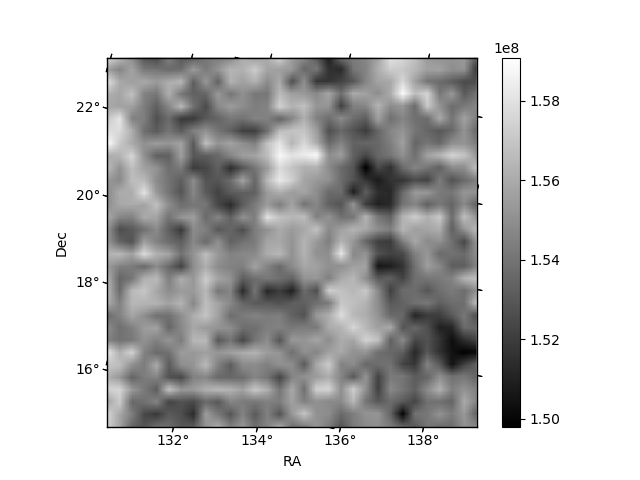
Quadrant B |
|---|---|---|---|
| Quadrant D | 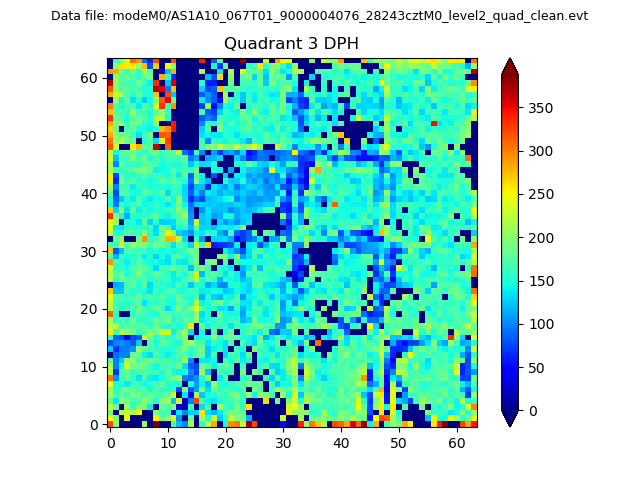 |
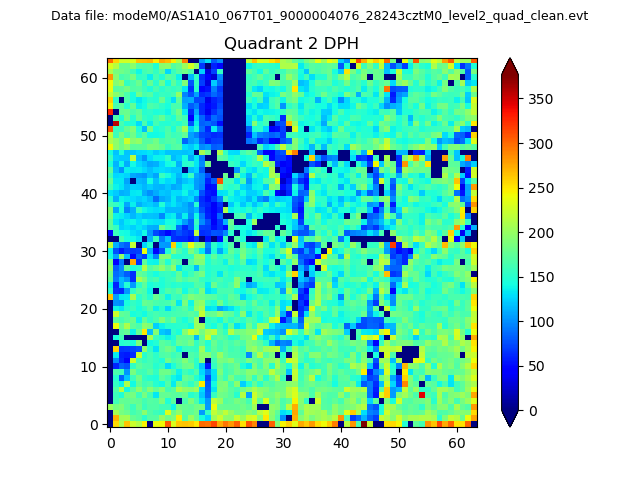 |
Quadrant C |
| Plot type | Count rate plots | Images |
|---|---|---|
| Comparison with Poisson distribution Blue bars denote a histogram of data divided into 1 sec bins. Red curve is a Poisson curve with rate = median count rate of data. |
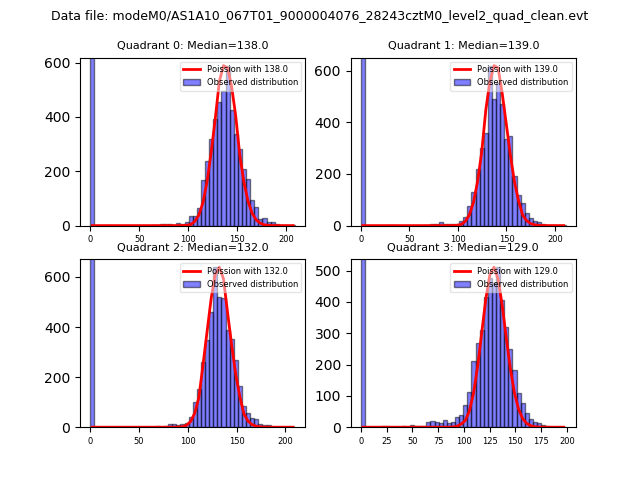 |
 |
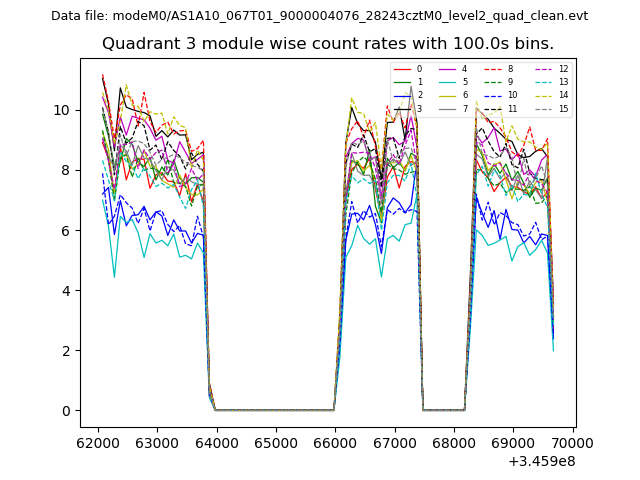
| Quadrant-wise count rates Data is divided into 100 sec bins |
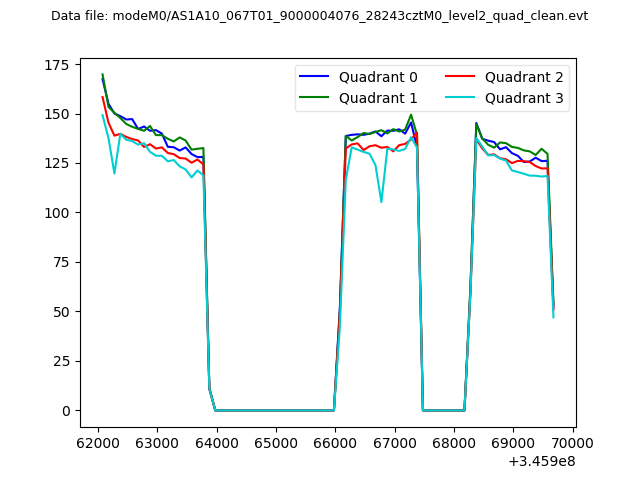 |
|
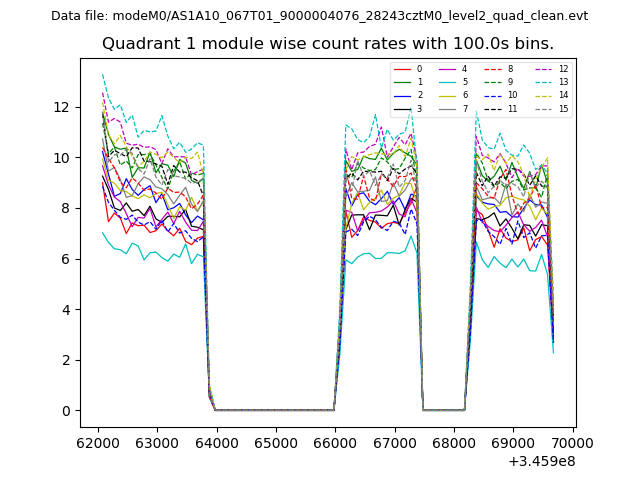
| Module-wise count rates for Quadrant A Data is divided into 100 sec bins |
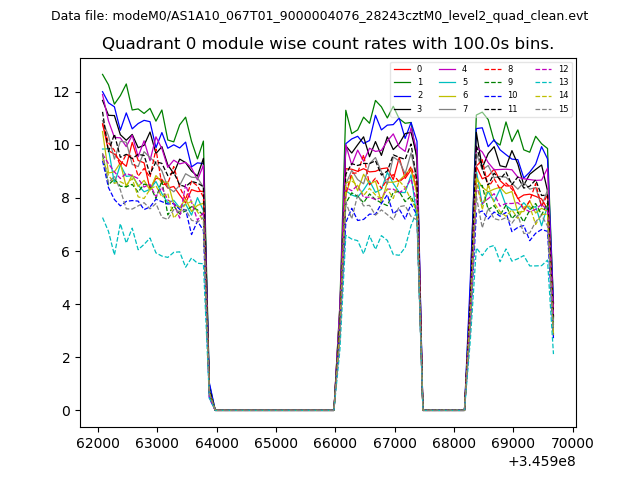 |
 |
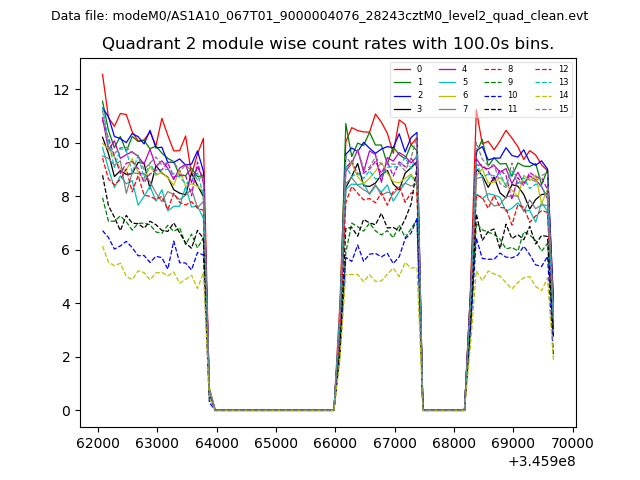
| Module-wise count rates for Quadrant B Data is divided into 100 sec bins |
 |
 |
| Module-wise count rates for Quadrant C Data is divided into 100 sec bins |
 |
 |
| Module-wise count rates for Quadrant D Data is divided into 100 sec bins |
 |
 |
| Parameter | Plot |
|---|---|
| CZT HV Monitor | 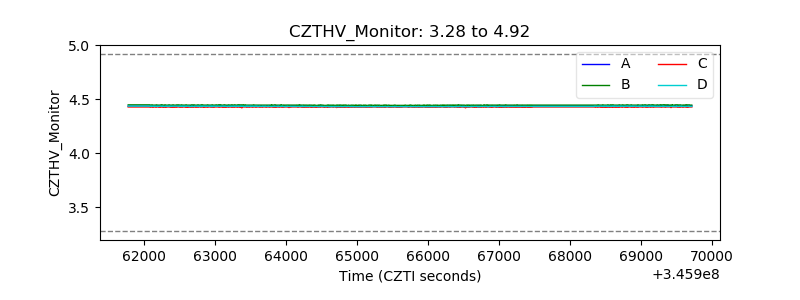 |
| D_VDD | 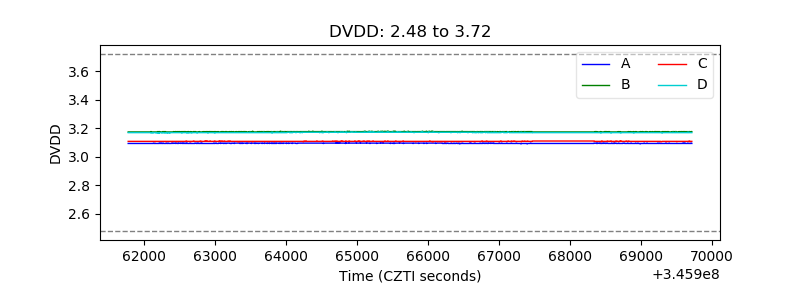 |
| Temperature 1 | 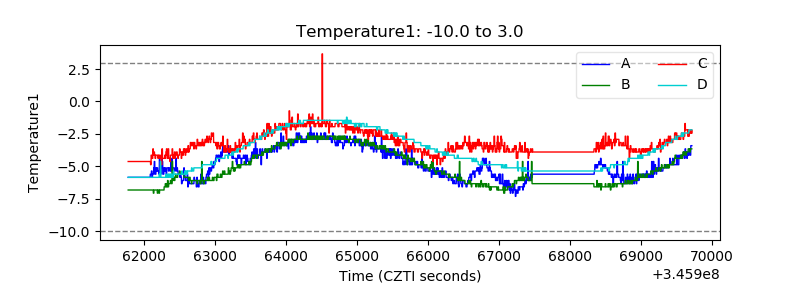 |
| Veto HV Monitor | 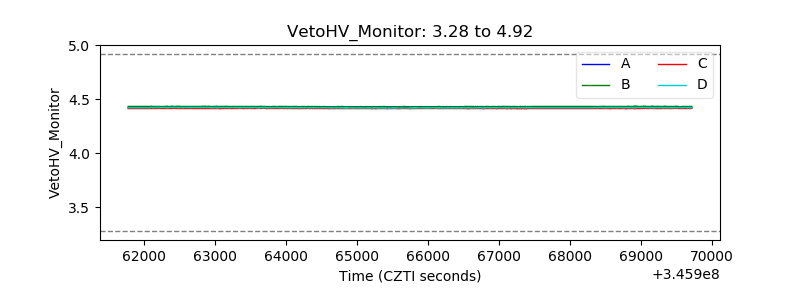 |
| Veto LLD | 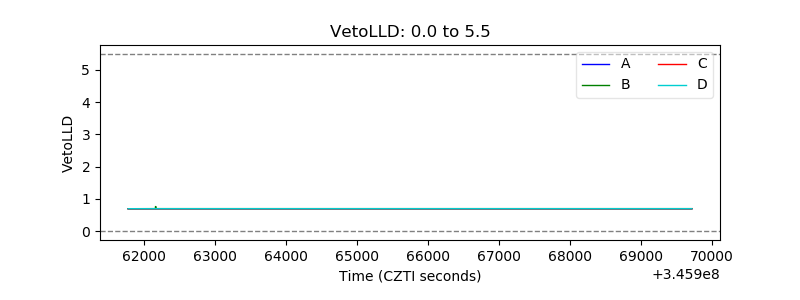 |
| Alpha Counter | 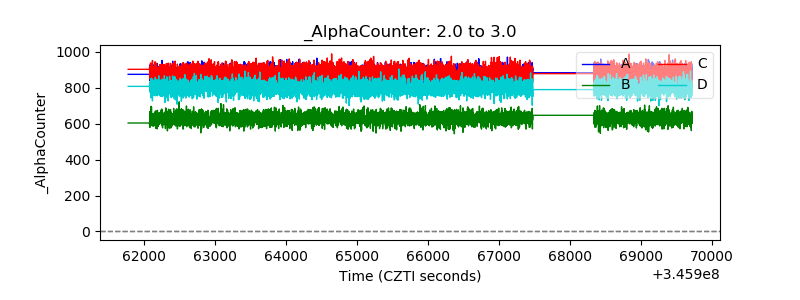 |
| _CPM_Rate | 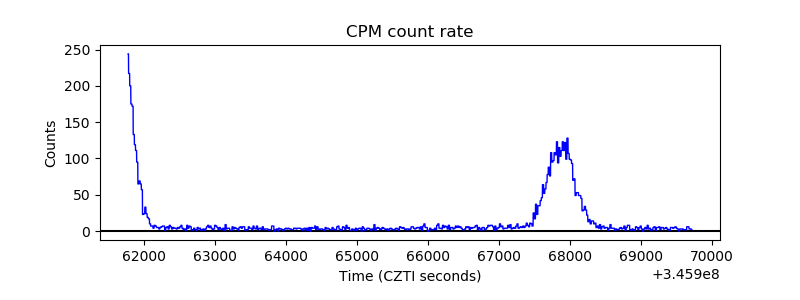 |
| CZT Counter | 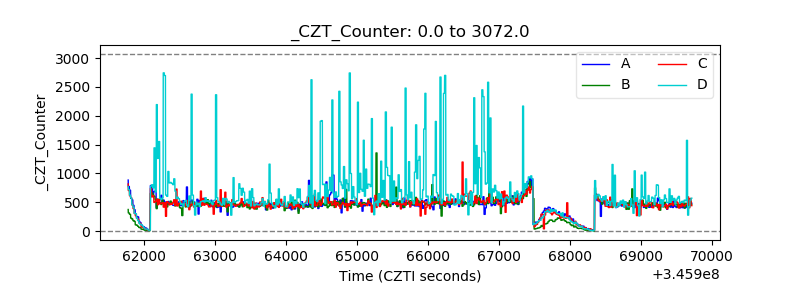 |
| +2.5 Volts monitor | 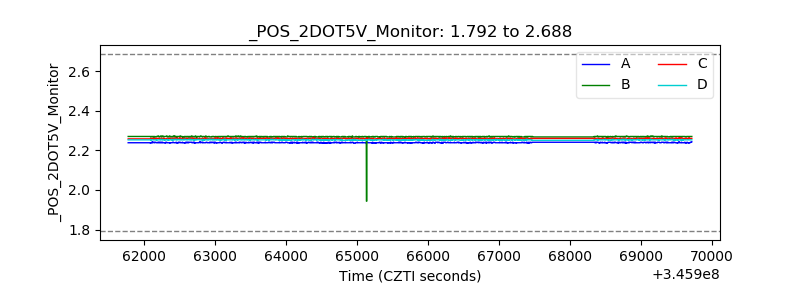 |
| +5 Volts monitor |  |
| _ROLL_ROT | 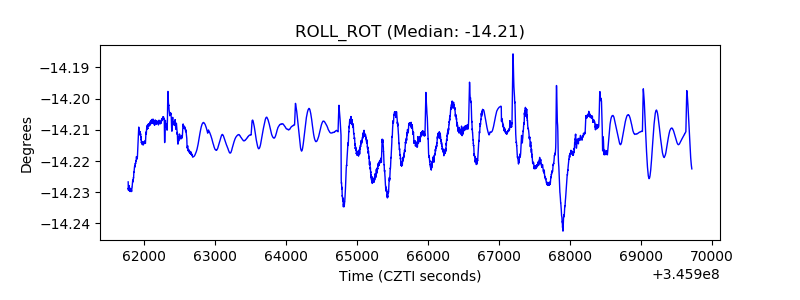 |
| _Roll_DEC | 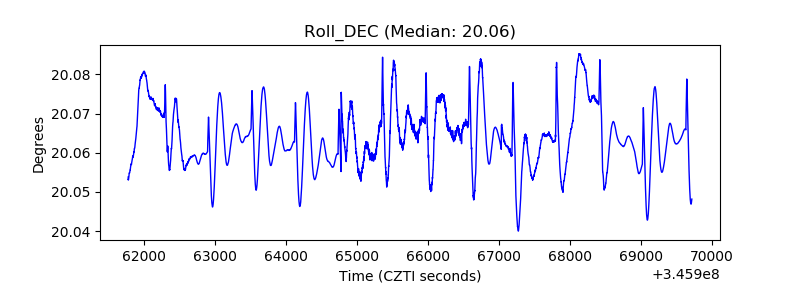 |
| _Roll_RA | 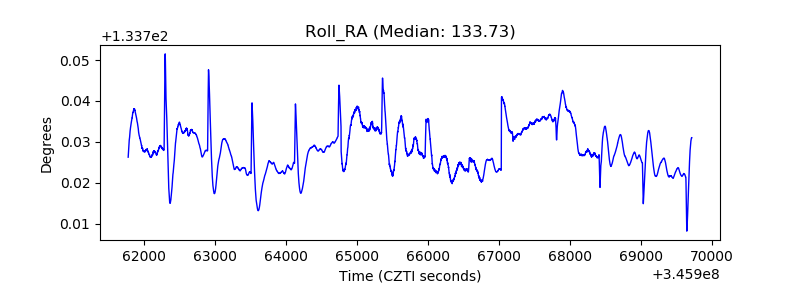 |
| Veto Counter | 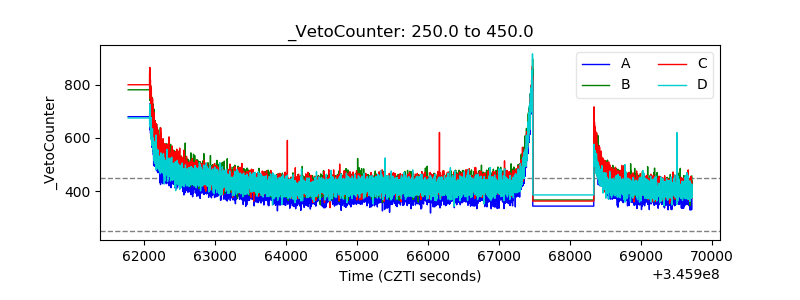 |