| Param | Original file | Final file |
|---|---|---|
| Filename | modeM0/AS1A10_067T01_9000004076_28244cztM0_level2.evt | modeM0/AS1A10_067T01_9000004076_28244cztM0_level2_quad_clean.evt |
| Size (bytes) | 522,313,920 | 80,985,600 |
| Size | 498.1 MB | 77.2 MB |
| Events in quadrant A | 3,125,885 | 511,858 |
| Events in quadrant B | 3,175,779 | 517,676 |
| Events in quadrant C | 3,157,375 | 492,979 |
| Events in quadrant D | 5,914,528 | 472,699 |
| Mode M0 | |||
|---|---|---|---|
| Quadrant | BADHDUFLAG | Total packets | Discarded packets |
| A | 0 | 13471 | 0 |
| B | 0 | 13552 | 0 |
| C | 0 | 13449 | 0 |
| D | 0 | 21949 | 0 |
| Mode M9 | |||
|---|---|---|---|
| Quadrant | BADHDUFLAG | Total packets | Discarded packets |
| A | 0 | 4 | 0 |
| B | 0 | 4 | 0 |
| C | 0 | 4 | 0 |
| D | 0 | 4 | 0 |
| Quadrant | Total seconds | Saturated seconds | Saturation percentage |
|---|---|---|---|
| A | 6546 | 142 | 2.169264% |
| B | 6547 | 141 | 2.153658% |
| C | 6547 | 164 | 2.504964% |
| D | 6547 | 581 | 8.874294% |
Noise dominated data is calculated using 1-second bins in cleaned event files. If a bin has >2000 counts, and if more than 50% of those come from <1% of pixels, then it is considered to be noise-dominated and hence unusable.
| Quadrant | # 1 sec bins | Bins with >0 counts | Bins with >2000 counts | High rate bins dominated by noise | Noise dominated (total time) | Noise dominated (detector-on time) | Marked lightcurve |
|---|---|---|---|---|---|---|---|
| A | 6916 | 6547 | 0 | 0 | 0.00% | 0.00% | 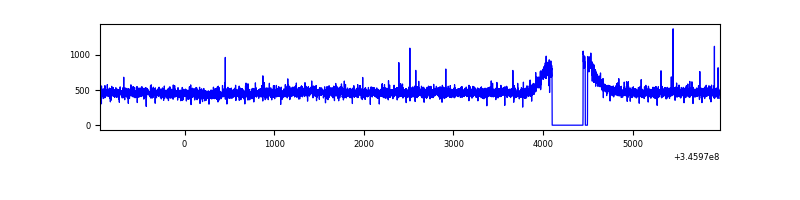 |
| B | 6917 | 6548 | 0 | 0 | 0.00% | 0.00% | 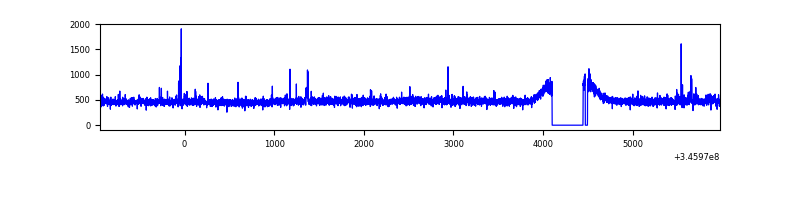 |
| C | 6917 | 6547 | 0 | 0 | 0.00% | 0.00% | 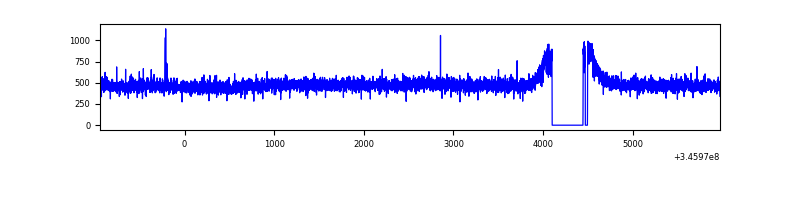 |
| D | 6917 | 6548 | 445 | 445 | 6.43% | 6.80% | 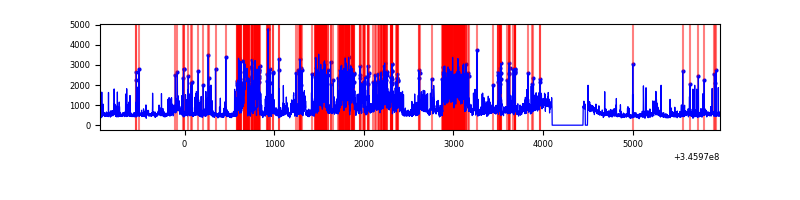 |
Top three noisy pixels from each quadrant. If the there are fewer than three noisy pixels in the level2.evt file, extra rows are filled as -1
| Pixel properties | Quadrant properties | ||||||
|---|---|---|---|---|---|---|---|
| Quadrant | DetID | PixID | Counts | Sigma | Mean | Median | Sigma |
| A | 13 | 254 | 9485 | 53.1 | 808 | 791 | 163.7 |
| A | 3 | 137 | 8230 | 45.44 | 808 | 791 | 163.7 |
| A | 0 | 226 | 6808 | 36.75 | 808 | 791 | 163.7 |
| B | 12 | 111 | 19722 | 121.52 | 795 | 774 | 155.9 |
| B | 0 | 183 | 18737 | 115.21 | 795 | 774 | 155.9 |
| B | 11 | 111 | 17907 | 109.88 | 795 | 774 | 155.9 |
| C | 14 | 238 | 124142 | 677.66 | 770 | 775 | 182.0 |
| C | 3 | 233 | 22017 | 116.68 | 770 | 775 | 182.0 |
| C | 9 | 54 | 6229 | 29.96 | 770 | 775 | 182.0 |
| D | 5 | 222 | 1423790 | 7925.54 | 761 | 739 | 179.6 |
| D | 1 | 52 | 1019610 | 5674.5 | 761 | 739 | 179.6 |
| D | 8 | 195 | 265224 | 1473.02 | 761 | 739 | 179.6 |
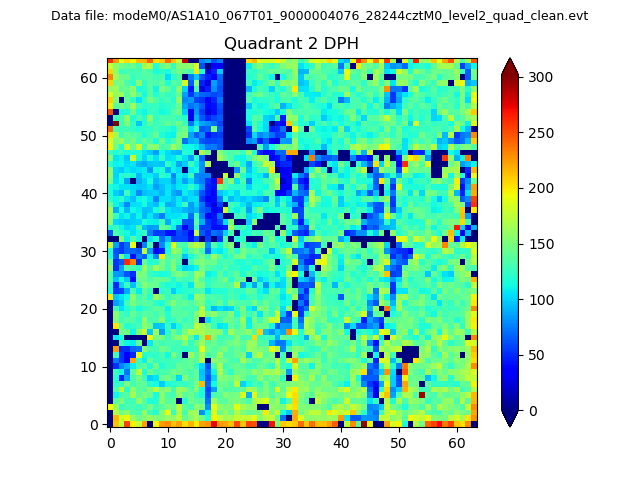
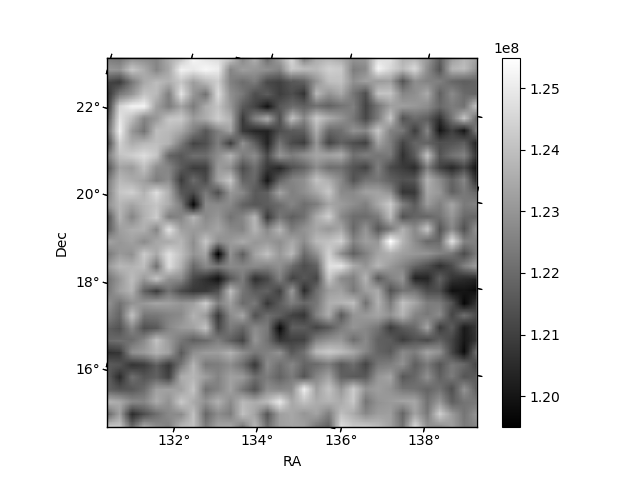
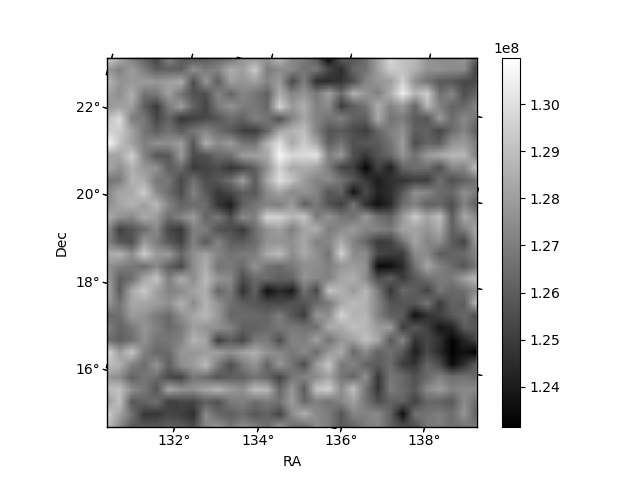
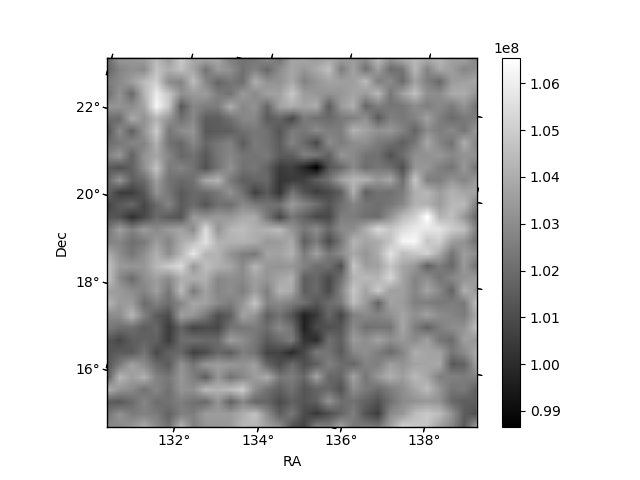
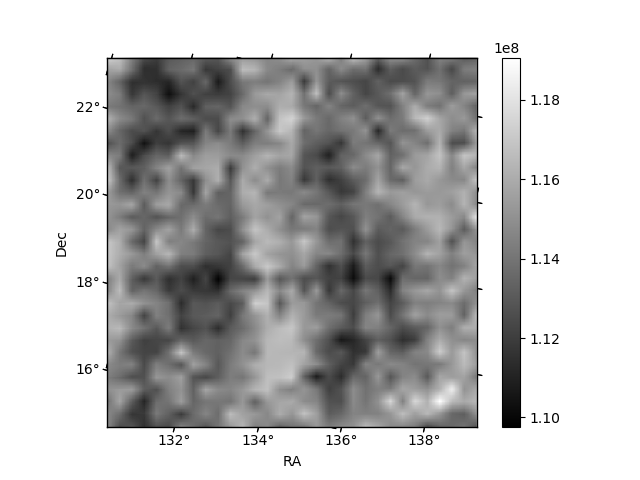
Histogram calculated using DETX and DETY for each event in the final _common_clean file
| Quadrant A | 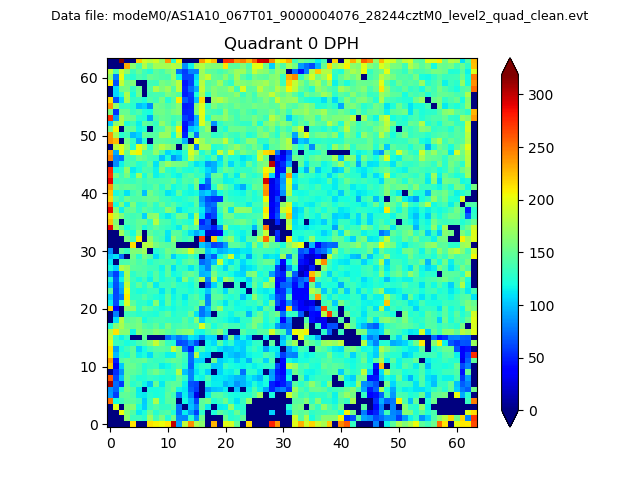 |
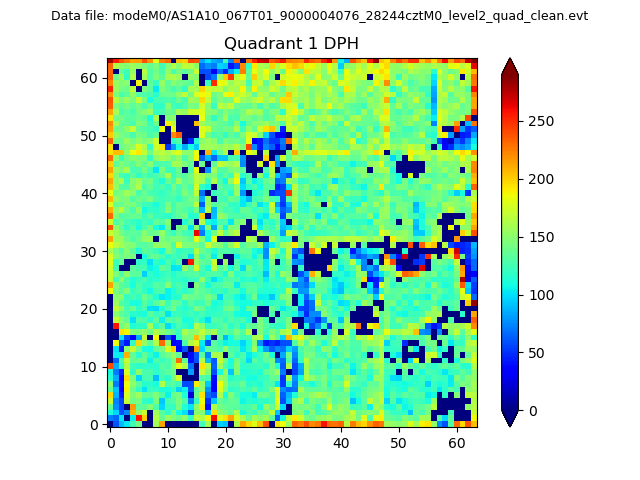 |
Quadrant B |
|---|---|---|---|
| Quadrant D | 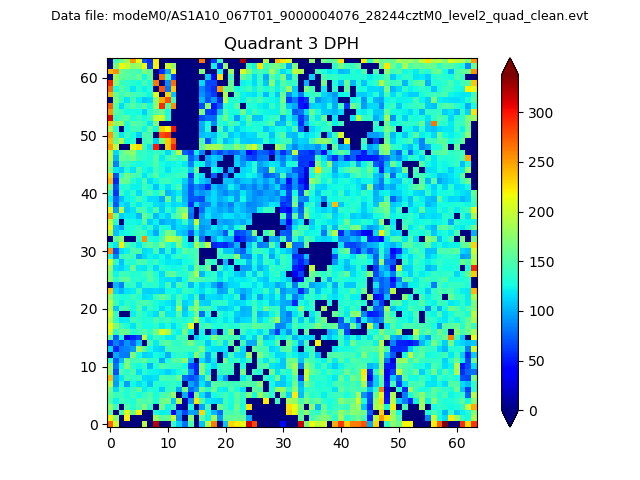 |
 |
Quadrant C |
| Plot type | Count rate plots | Images |
|---|---|---|
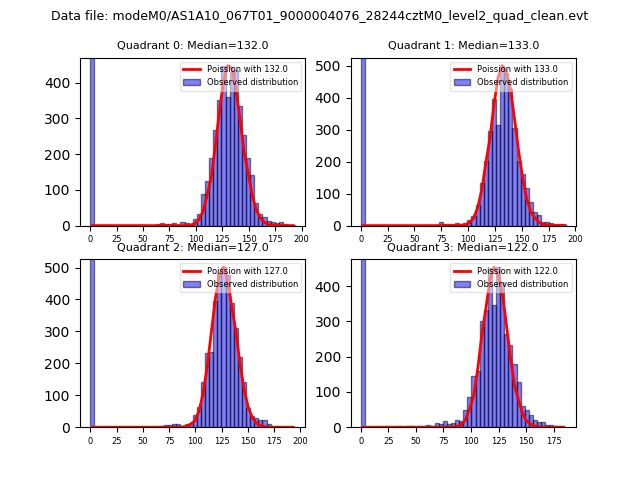
| Comparison with Poisson distribution Blue bars denote a histogram of data divided into 1 sec bins. Red curve is a Poisson curve with rate = median count rate of data. |
 |
 |
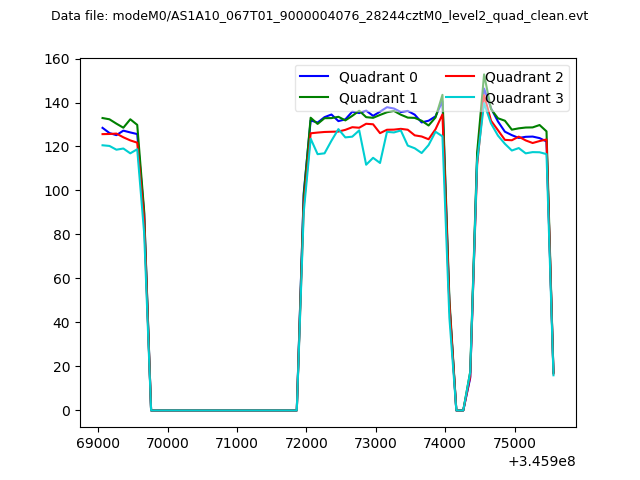
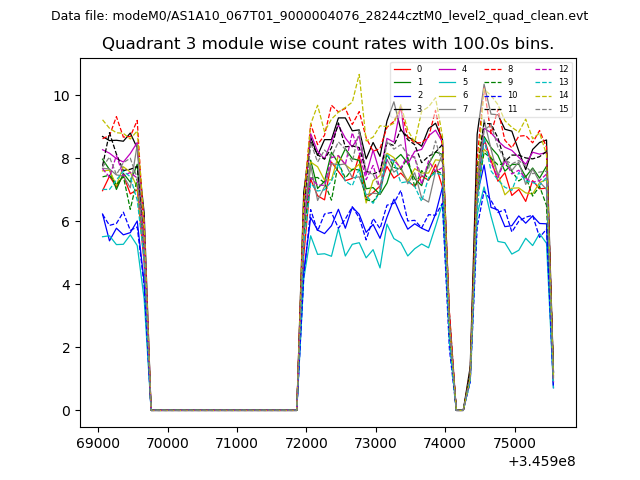
| Quadrant-wise count rates Data is divided into 100 sec bins |
 |
|
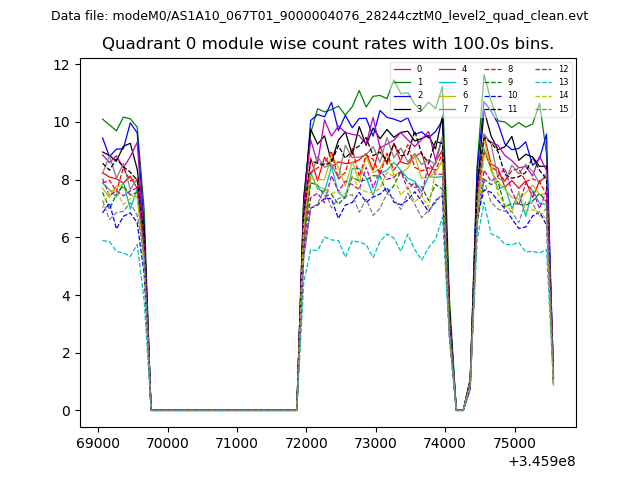
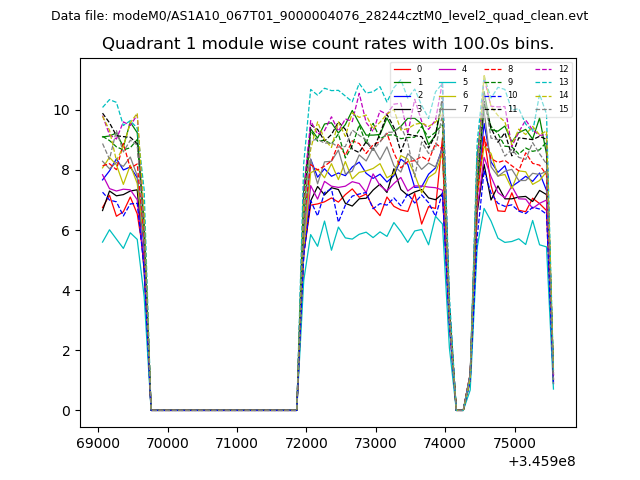
| Module-wise count rates for Quadrant A Data is divided into 100 sec bins |
 |
 |
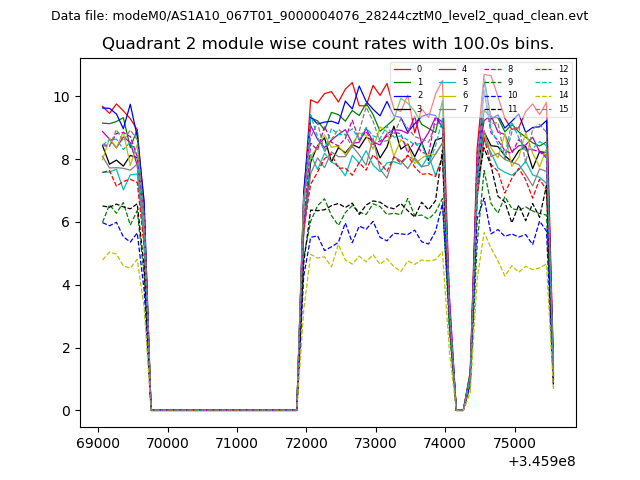
| Module-wise count rates for Quadrant B Data is divided into 100 sec bins |
 |
 |
| Module-wise count rates for Quadrant C Data is divided into 100 sec bins |
 |
 |
| Module-wise count rates for Quadrant D Data is divided into 100 sec bins |
 |
 |
| Parameter | Plot |
|---|---|
| CZT HV Monitor | 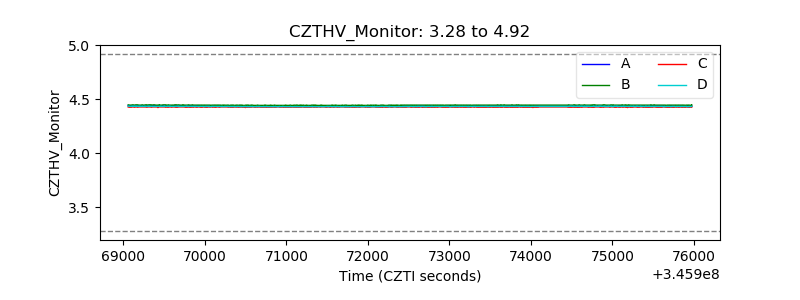 |
| D_VDD | 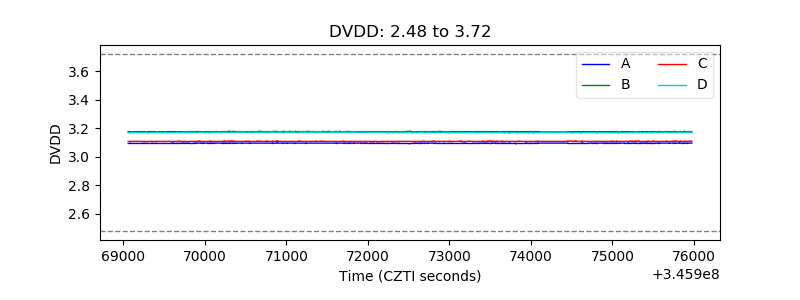 |
| Temperature 1 | 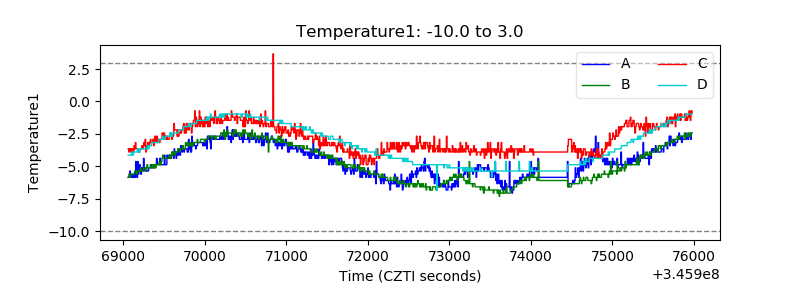 |
| Veto HV Monitor |  |
| Veto LLD | 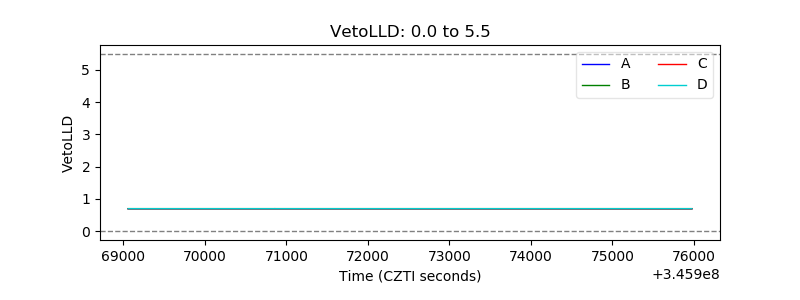 |
| Alpha Counter | 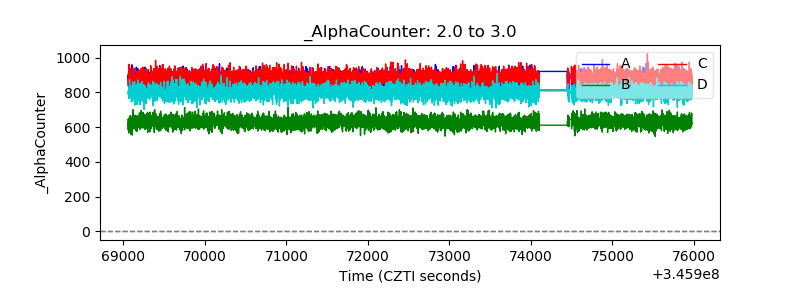 |
| _CPM_Rate |  |
| CZT Counter | 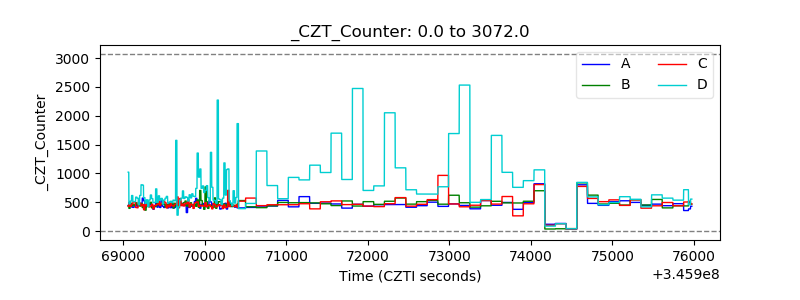 |
| +2.5 Volts monitor | 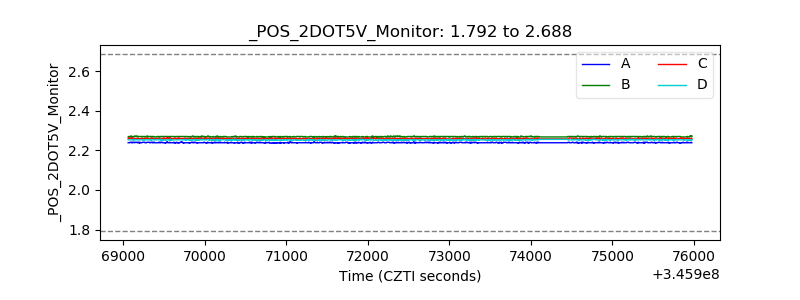 |
| +5 Volts monitor |  |
| _ROLL_ROT | 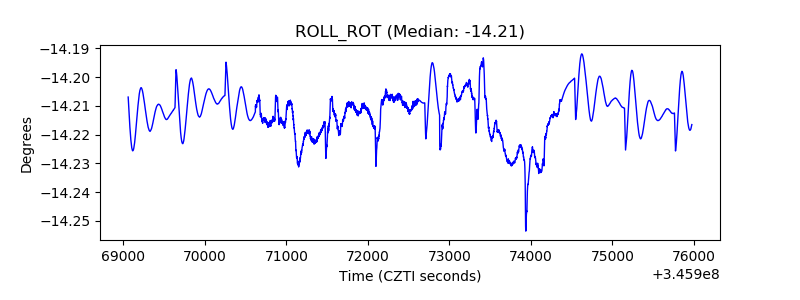 |
| _Roll_DEC | 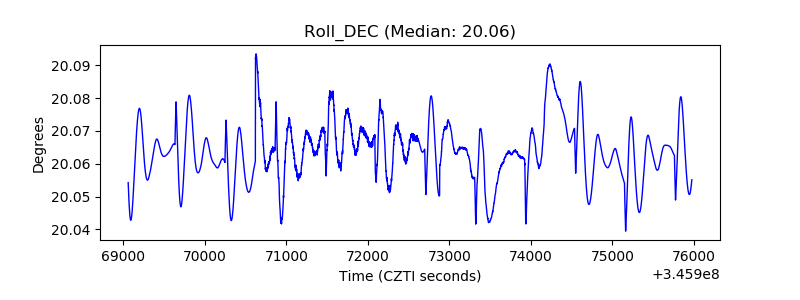 |
| _Roll_RA | 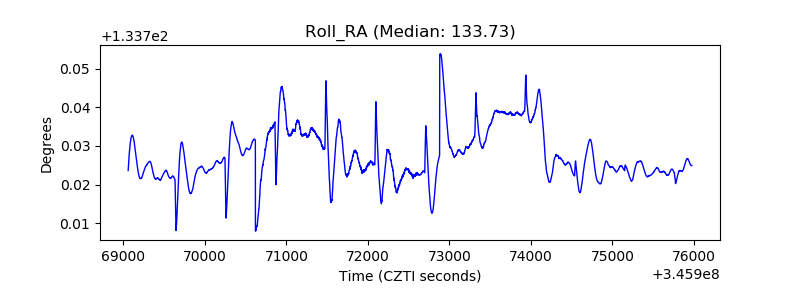 |
| Veto Counter | 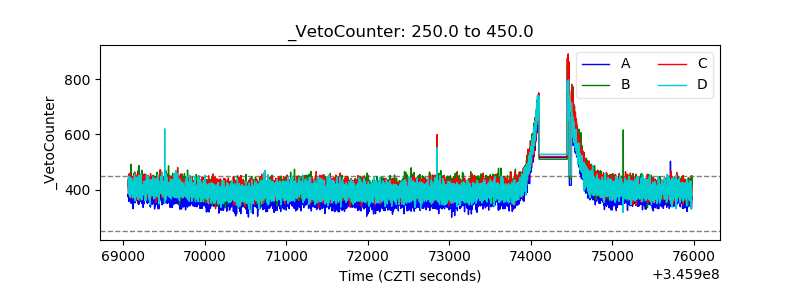 |