| Param | Original file | Final file |
|---|---|---|
| Filename | modeM0/AS1A10_067T01_9000004076_28245cztM0_level2.evt | modeM0/AS1A10_067T01_9000004076_28245cztM0_level2_quad_clean.evt |
| Size (bytes) | 605,969,280 | 89,089,920 |
| Size | 577.9 MB | 85.0 MB |
| Events in quadrant A | 3,764,285 | 557,445 |
| Events in quadrant B | 3,747,314 | 562,472 |
| Events in quadrant C | 3,704,396 | 535,401 |
| Events in quadrant D | 6,624,887 | 518,008 |
| Mode M0 | |||
|---|---|---|---|
| Quadrant | BADHDUFLAG | Total packets | Discarded packets |
| A | 0 | 16022 | 0 |
| B | 0 | 15857 | 0 |
| C | 0 | 15721 | 0 |
| D | 0 | 24651 | 0 |
| Mode M9 | |||
|---|---|---|---|
| Quadrant | BADHDUFLAG | Total packets | Discarded packets |
| A | 0 | 3 | 0 |
| B | 0 | 3 | 0 |
| C | 0 | 3 | 0 |
| D | 0 | 3 | 0 |
| Quadrant | Total seconds | Saturated seconds | Saturation percentage |
|---|---|---|---|
| A | 7549 | 230 | 3.046761% |
| B | 7549 | 243 | 3.218969% |
| C | 7549 | 262 | 3.470658% |
| D | 7550 | 922 | 12.211921% |
Noise dominated data is calculated using 1-second bins in cleaned event files. If a bin has >2000 counts, and if more than 50% of those come from <1% of pixels, then it is considered to be noise-dominated and hence unusable.
| Quadrant | # 1 sec bins | Bins with >0 counts | Bins with >2000 counts | High rate bins dominated by noise | Noise dominated (total time) | Noise dominated (detector-on time) | Marked lightcurve |
|---|---|---|---|---|---|---|---|
| A | 7639 | 7549 | 1 | 1 | 0.01% | 0.01% | 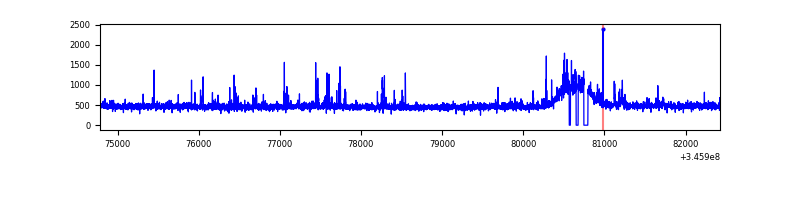 |
| B | 7639 | 7552 | 2 | 2 | 0.03% | 0.03% | 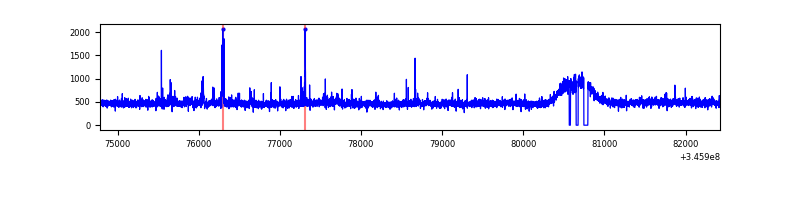 |
| C | 7639 | 7550 | 0 | 0 | 0.00% | 0.00% | 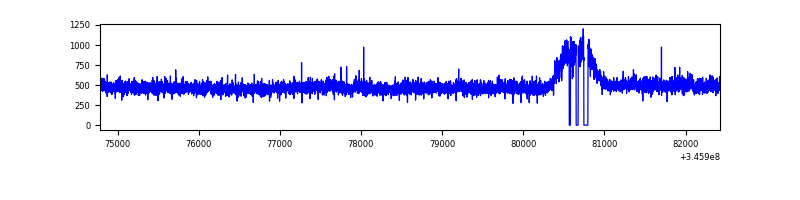 |
| D | 7640 | 7551 | 645 | 645 | 8.44% | 8.54% | 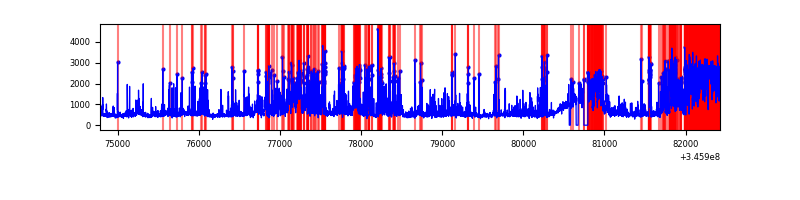 |
Top three noisy pixels from each quadrant. If the there are fewer than three noisy pixels in the level2.evt file, extra rows are filled as -1
| Pixel properties | Quadrant properties | ||||||
|---|---|---|---|---|---|---|---|
| Quadrant | DetID | PixID | Counts | Sigma | Mean | Median | Sigma |
| A | 15 | 192 | 75548 | 391.04 | 937 | 915 | 190.9 |
| A | 1 | 113 | 46536 | 239.03 | 937 | 915 | 190.9 |
| A | 12 | 96 | 22643 | 113.84 | 937 | 915 | 190.9 |
| B | 10 | 245 | 60964 | 332.04 | 924 | 900 | 180.9 |
| B | 0 | 230 | 24928 | 132.83 | 924 | 900 | 180.9 |
| B | 12 | 111 | 23082 | 122.62 | 924 | 900 | 180.9 |
| C | 14 | 238 | 140986 | 661.19 | 895 | 901 | 211.9 |
| C | 3 | 233 | 64671 | 300.99 | 895 | 901 | 211.9 |
| C | 13 | 61 | 6178 | 24.9 | 895 | 901 | 211.9 |
| D | 1 | 52 | 2136438 | 10019.7 | 878 | 851 | 213.1 |
| D | 5 | 222 | 341168 | 1596.69 | 878 | 851 | 213.1 |
| D | 12 | 250 | 298300 | 1395.56 | 878 | 851 | 213.1 |
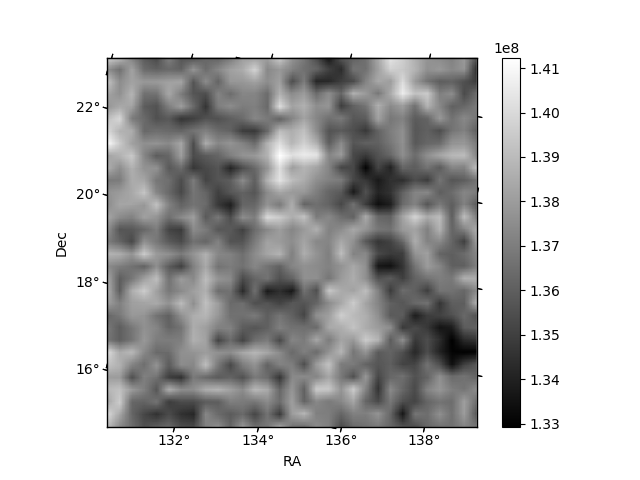
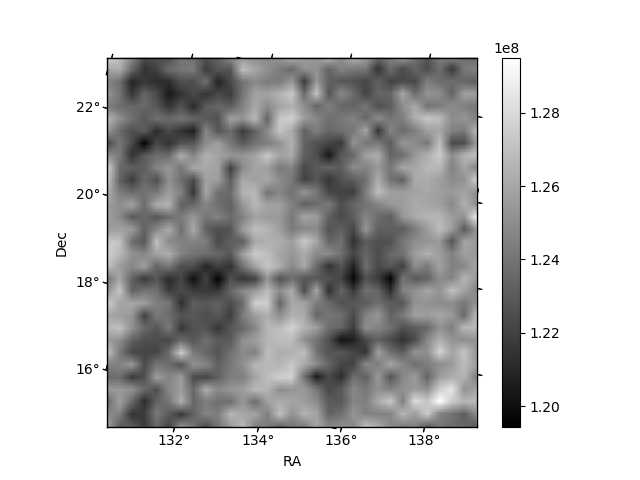
Histogram calculated using DETX and DETY for each event in the final _common_clean file
| Quadrant A |  |
 |
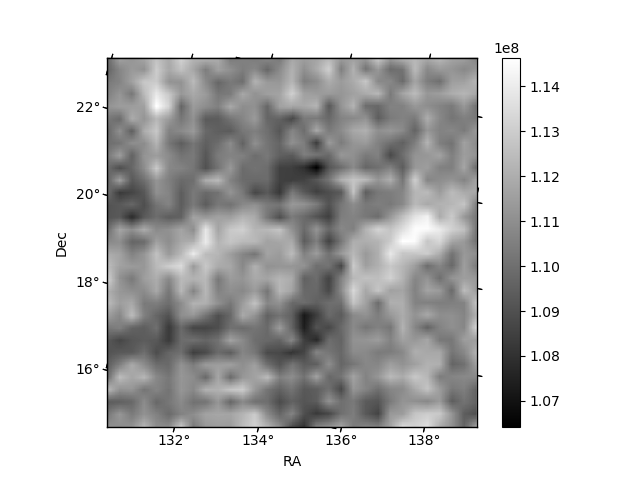
Quadrant B |
|---|---|---|---|
| Quadrant D |  |
 |
Quadrant C |
| Plot type | Count rate plots | Images |
|---|---|---|
| Comparison with Poisson distribution Blue bars denote a histogram of data divided into 1 sec bins. Red curve is a Poisson curve with rate = median count rate of data. |
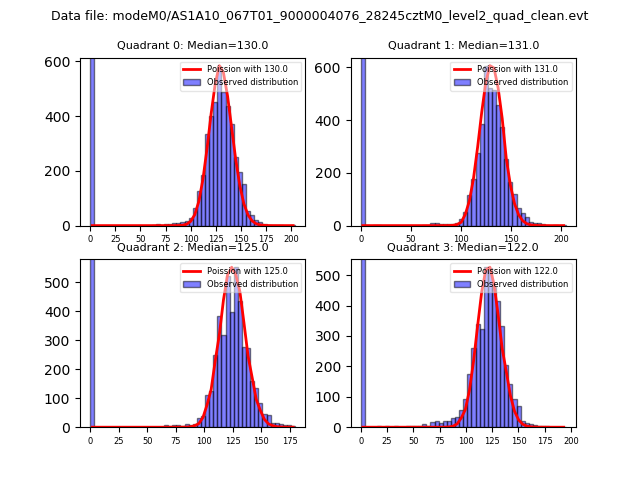 |
 |
| Quadrant-wise count rates Data is divided into 100 sec bins |
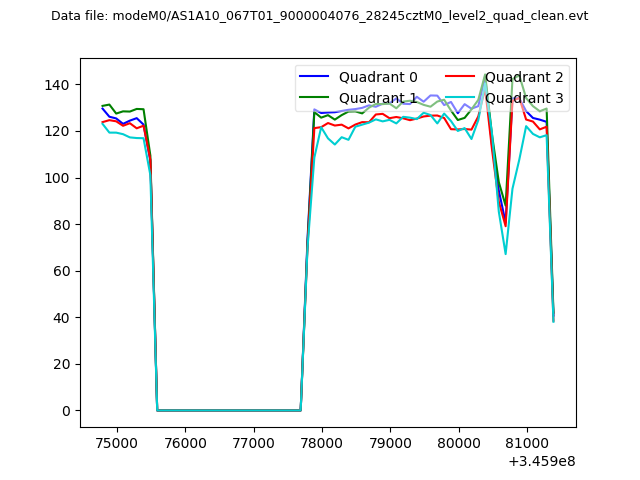 |
|
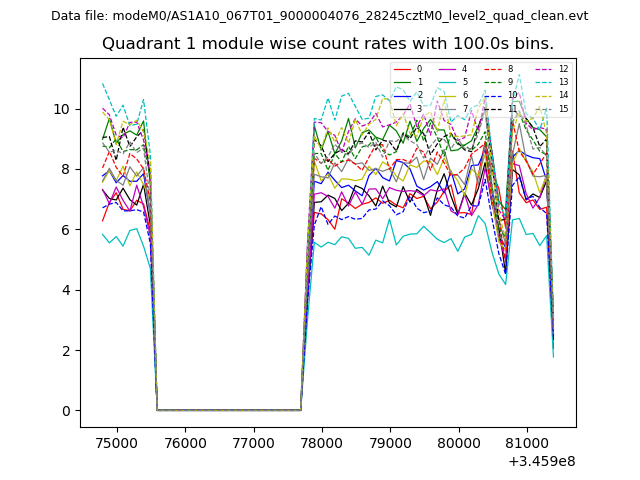
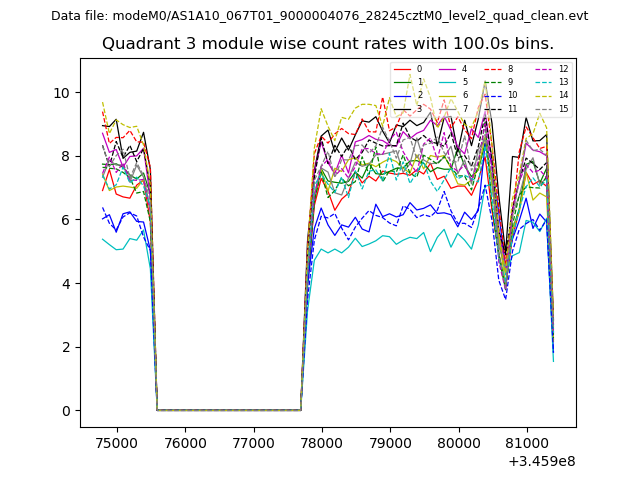
| Module-wise count rates for Quadrant A Data is divided into 100 sec bins |
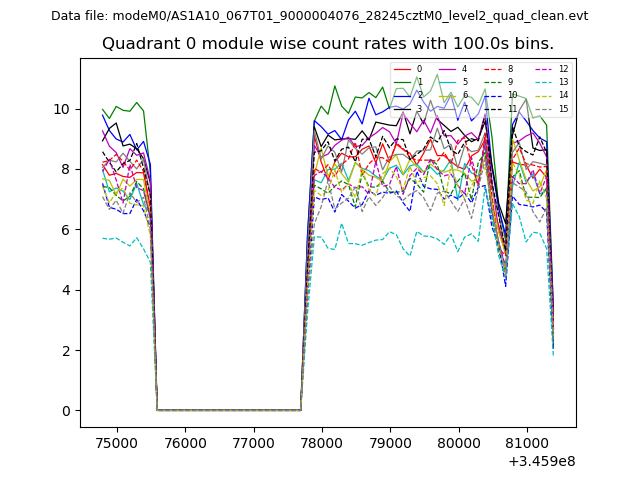 |
 |
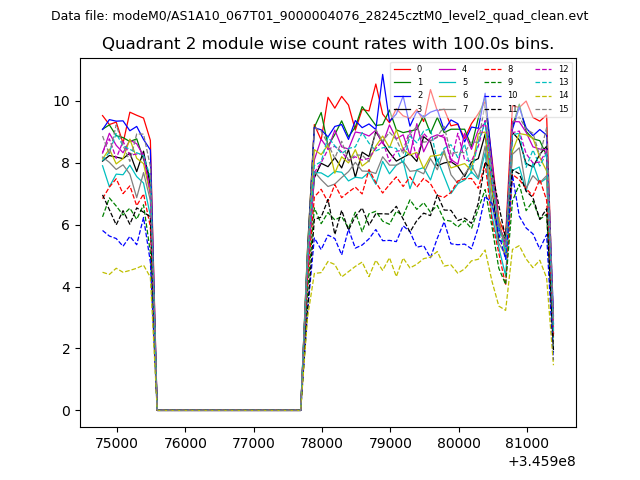
| Module-wise count rates for Quadrant B Data is divided into 100 sec bins |
 |
 |
| Module-wise count rates for Quadrant C Data is divided into 100 sec bins |
 |
 |
| Module-wise count rates for Quadrant D Data is divided into 100 sec bins |
 |
 |
| Parameter | Plot |
|---|---|
| CZT HV Monitor | 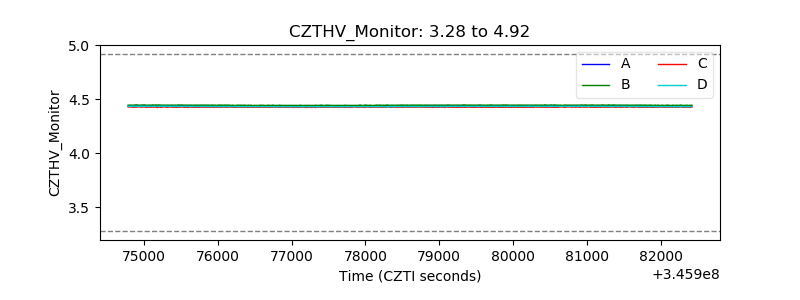 |
| D_VDD | 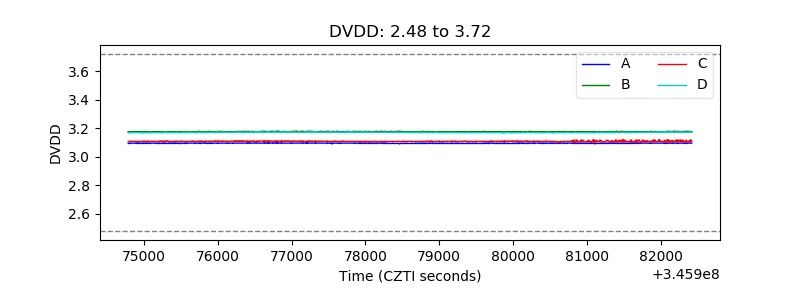 |
| Temperature 1 | 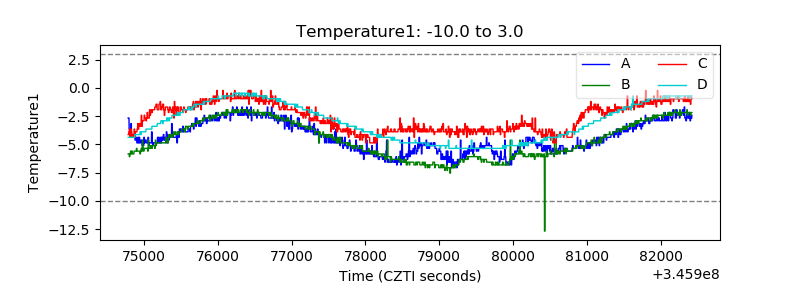 |
| Veto HV Monitor |  |
| Veto LLD | 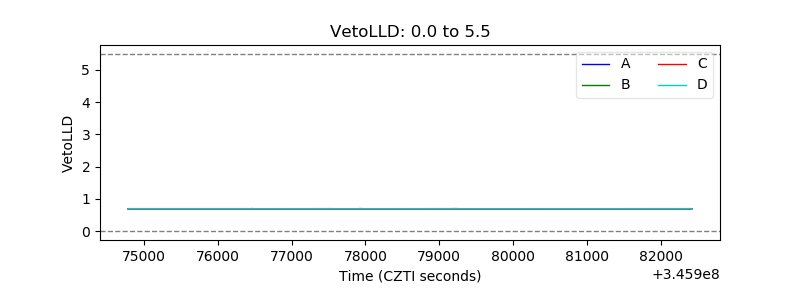 |
| Alpha Counter | 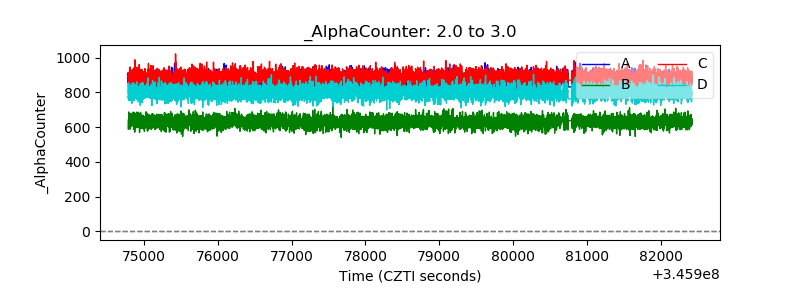 |
| _CPM_Rate | 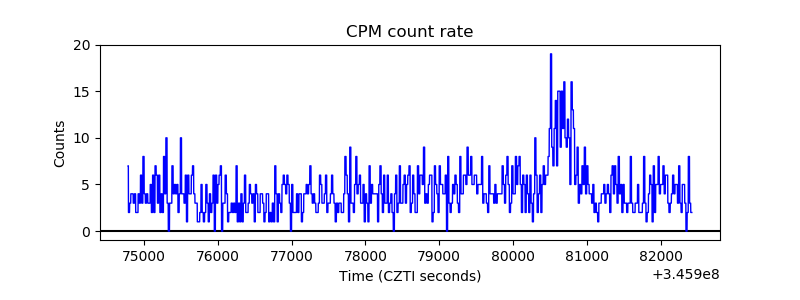 |
| CZT Counter |  |
| +2.5 Volts monitor |  |
| +5 Volts monitor | 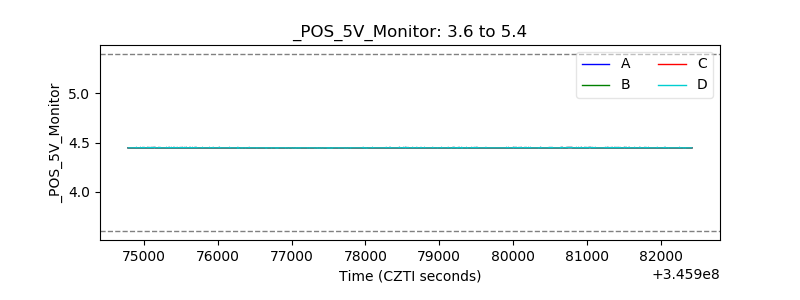 |
| _ROLL_ROT | 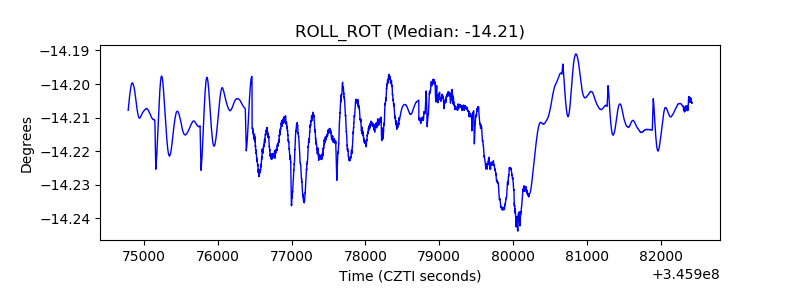 |
| _Roll_DEC |  |
| _Roll_RA |  |
| Veto Counter | 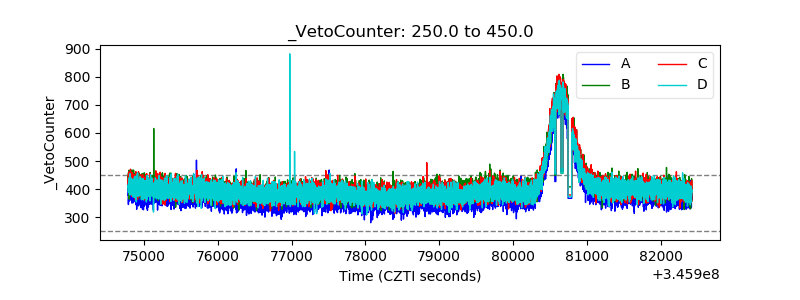 |