| Param | Original file | Final file |
|---|---|---|
| Filename | modeM0/AS1A10_067T01_9000004076_28246cztM0_level2.evt | modeM0/AS1A10_067T01_9000004076_28246cztM0_level2_quad_clean.evt |
| Size (bytes) | 696,386,880 | 85,170,240 |
| Size | 664.1 MB | 81.2 MB |
| Events in quadrant A | 3,854,072 | 529,695 |
| Events in quadrant B | 3,922,848 | 531,904 |
| Events in quadrant C | 3,954,549 | 503,499 |
| Events in quadrant D | 8,832,846 | 473,563 |
| Mode M0 | |||
|---|---|---|---|
| Quadrant | BADHDUFLAG | Total packets | Discarded packets |
| A | 0 | 16418 | 0 |
| B | 0 | 16531 | 0 |
| C | 0 | 16514 | 0 |
| D | 0 | 31523 | 0 |
| Mode M9 | |||
|---|---|---|---|
| Quadrant | BADHDUFLAG | Total packets | Discarded packets |
| A | 0 | 6 | 0 |
| B | 0 | 6 | 0 |
| C | 0 | 6 | 0 |
| D | 0 | 6 | 0 |
| Quadrant | Total seconds | Saturated seconds | Saturation percentage |
|---|---|---|---|
| A | 7774 | 268 | 3.447389% |
| B | 7774 | 282 | 3.627476% |
| C | 7774 | 323 | 4.154875% |
| D | 7774 | 1710 | 21.996398% |
Noise dominated data is calculated using 1-second bins in cleaned event files. If a bin has >2000 counts, and if more than 50% of those come from <1% of pixels, then it is considered to be noise-dominated and hence unusable.
| Quadrant | # 1 sec bins | Bins with >0 counts | Bins with >2000 counts | High rate bins dominated by noise | Noise dominated (total time) | Noise dominated (detector-on time) | Marked lightcurve |
|---|---|---|---|---|---|---|---|
| A | 8179 | 7775 | 1 | 1 | 0.01% | 0.01% | 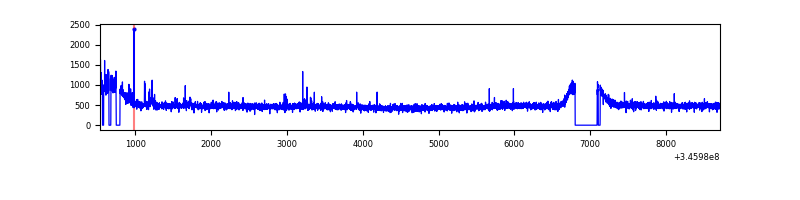 |
| B | 8179 | 7778 | 2 | 2 | 0.02% | 0.03% | 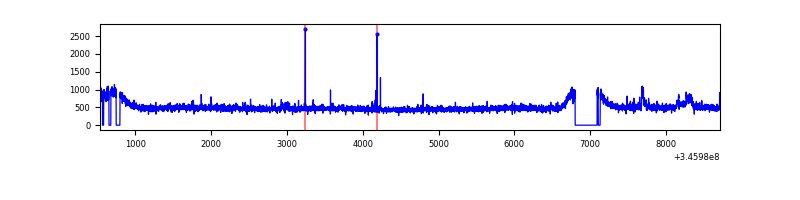 |
| C | 8179 | 7776 | 1 | 1 | 0.01% | 0.01% | 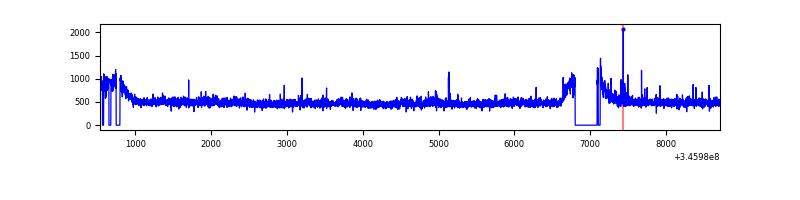 |
| D | 8179 | 7776 | 1273 | 1273 | 15.56% | 16.37% | 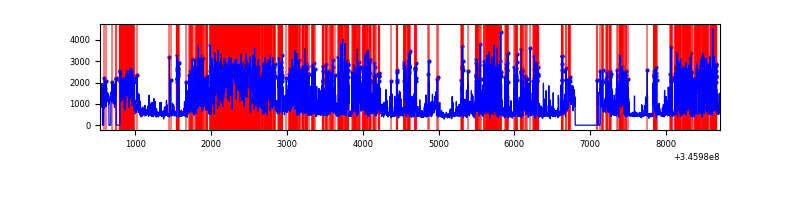 |
Top three noisy pixels from each quadrant. If the there are fewer than three noisy pixels in the level2.evt file, extra rows are filled as -1
| Pixel properties | Quadrant properties | ||||||
|---|---|---|---|---|---|---|---|
| Quadrant | DetID | PixID | Counts | Sigma | Mean | Median | Sigma |
| A | 15 | 192 | 54666 | 267.97 | 980 | 958 | 200.4 |
| A | 13 | 254 | 12065 | 55.42 | 980 | 958 | 200.4 |
| A | 3 | 137 | 10144 | 45.83 | 980 | 958 | 200.4 |
| B | 10 | 245 | 79929 | 417.66 | 964 | 937 | 189.1 |
| B | 12 | 111 | 24084 | 122.39 | 964 | 937 | 189.1 |
| B | 11 | 111 | 21816 | 110.39 | 964 | 937 | 189.1 |
| C | 14 | 238 | 146623 | 657.5 | 934 | 937 | 221.6 |
| C | 3 | 233 | 133455 | 598.07 | 934 | 937 | 221.6 |
| C | 2 | 16 | 17541 | 74.94 | 934 | 937 | 221.6 |
| D | 1 | 52 | 4035707 | 18807.92 | 884 | 859 | 214.5 |
| D | 5 | 222 | 700018 | 3259.04 | 884 | 859 | 214.5 |
| D | 12 | 250 | 349836 | 1626.71 | 884 | 859 | 214.5 |
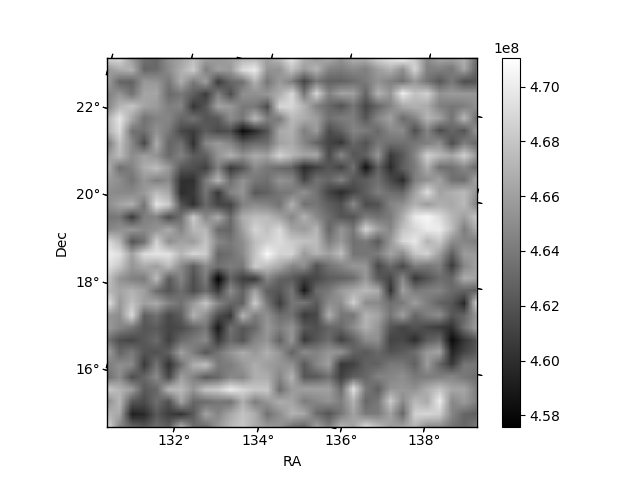
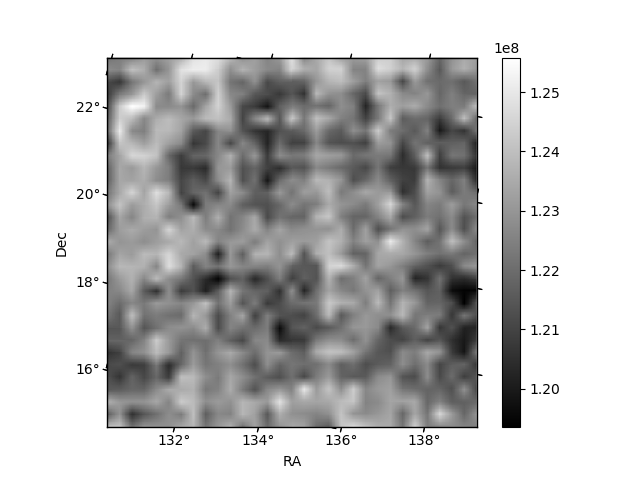
Histogram calculated using DETX and DETY for each event in the final _common_clean file
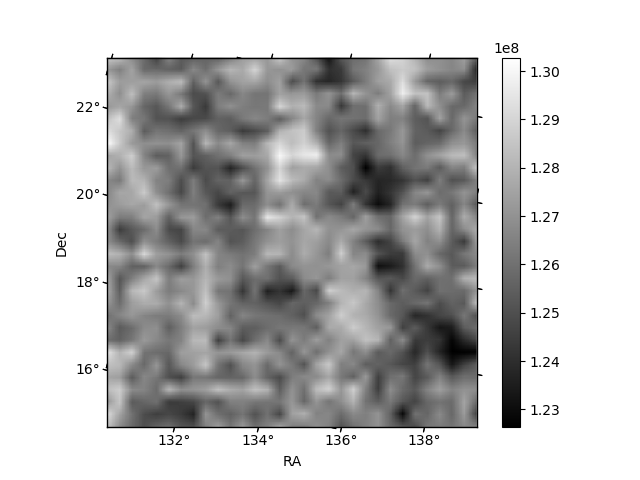
| Quadrant A | 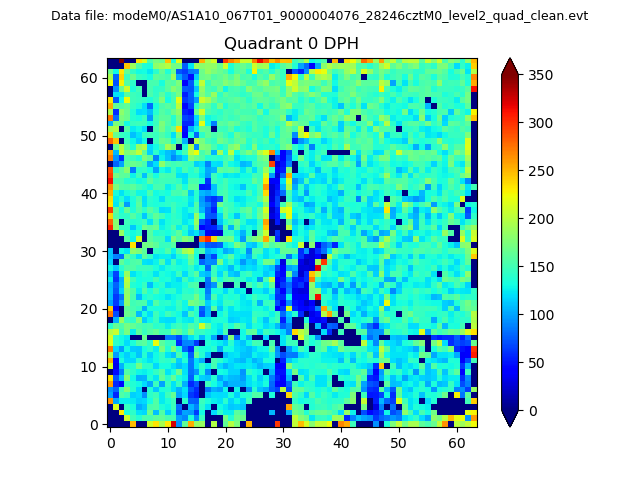 |
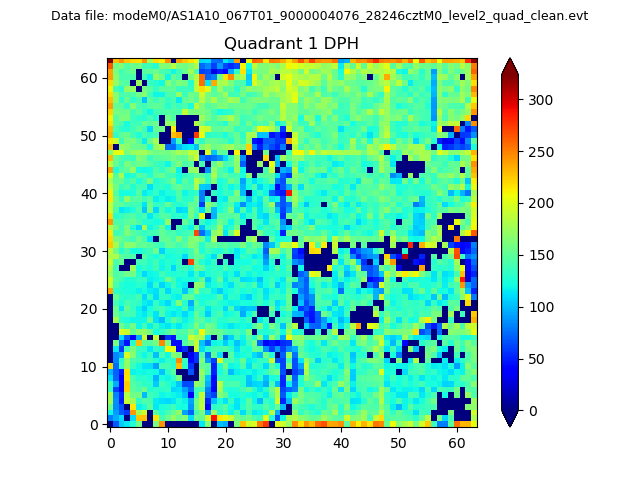 |
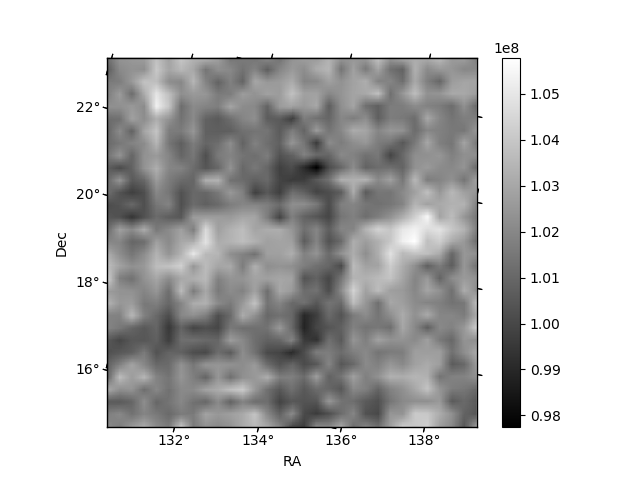
Quadrant B |
|---|---|---|---|
| Quadrant D | 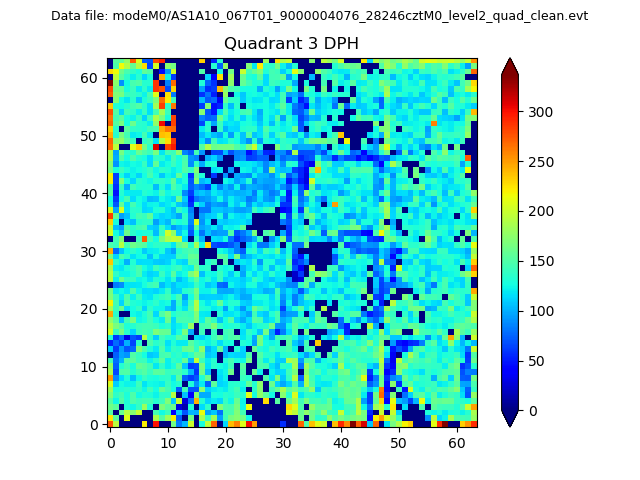 |
 |
Quadrant C |
| Plot type | Count rate plots | Images |
|---|---|---|
| Comparison with Poisson distribution Blue bars denote a histogram of data divided into 1 sec bins. Red curve is a Poisson curve with rate = median count rate of data. |
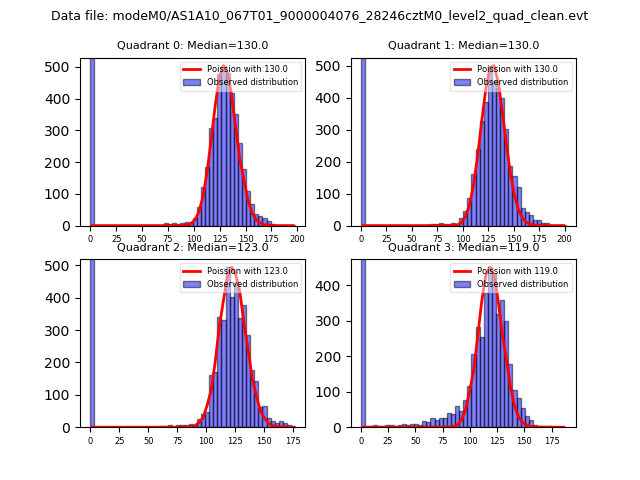 |
 |
| Quadrant-wise count rates Data is divided into 100 sec bins |
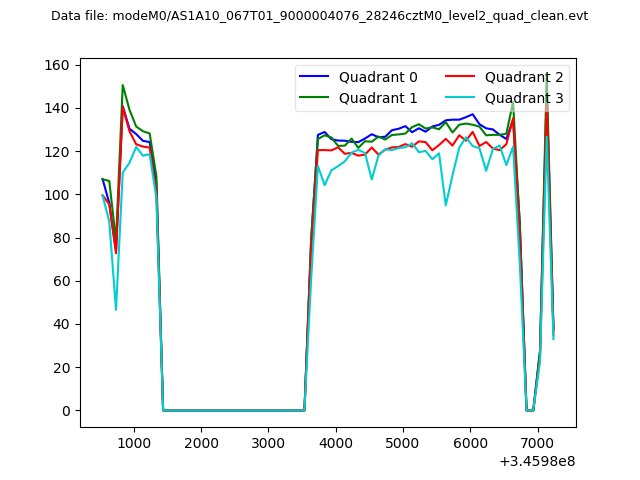 |
|
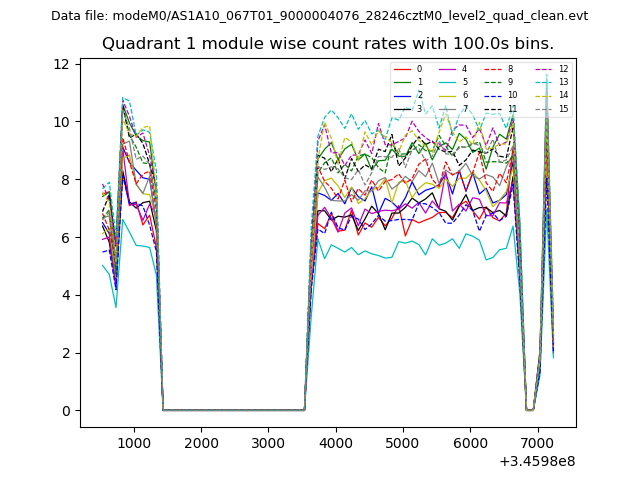
| Module-wise count rates for Quadrant A Data is divided into 100 sec bins |
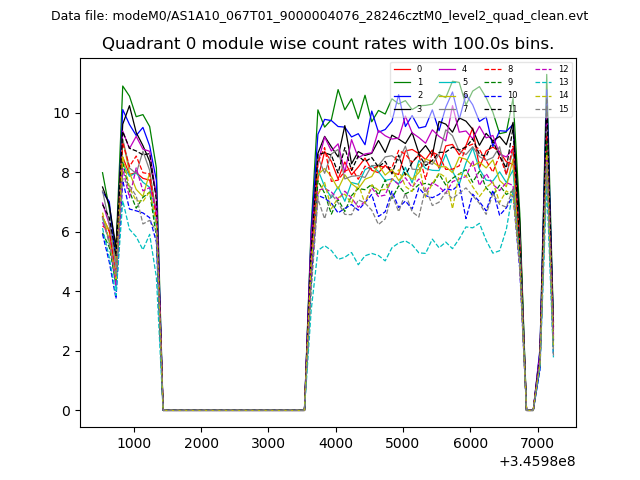 |
 |
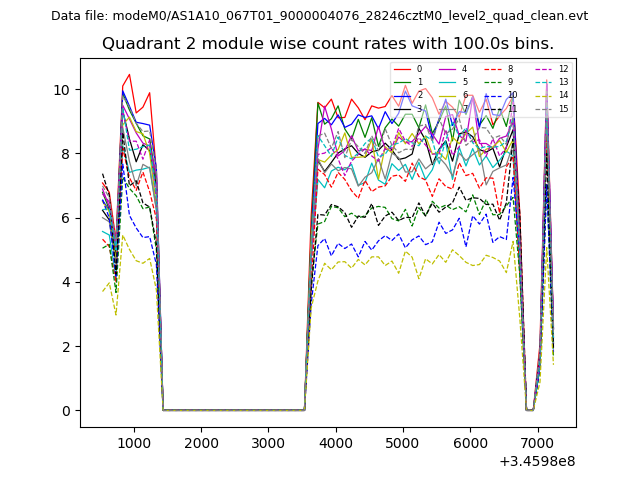
| Module-wise count rates for Quadrant B Data is divided into 100 sec bins |
 |
 |
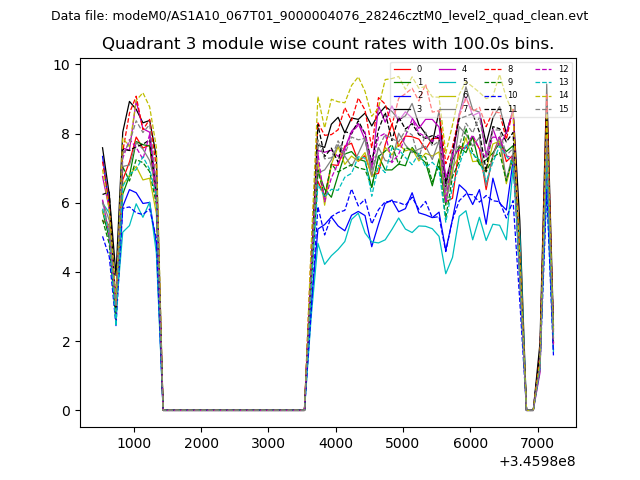
| Module-wise count rates for Quadrant C Data is divided into 100 sec bins |
 |
 |
| Module-wise count rates for Quadrant D Data is divided into 100 sec bins |
 |
 |
| Parameter | Plot |
|---|---|
| CZT HV Monitor | 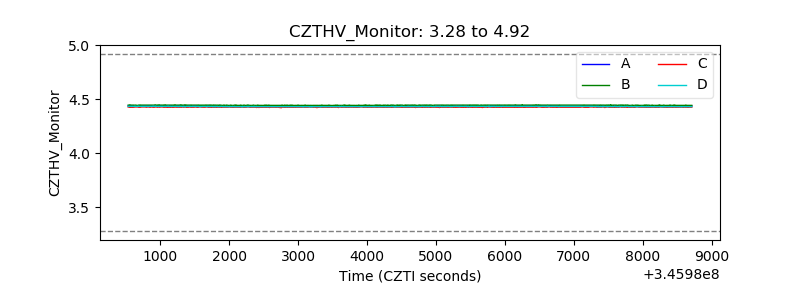 |
| D_VDD | 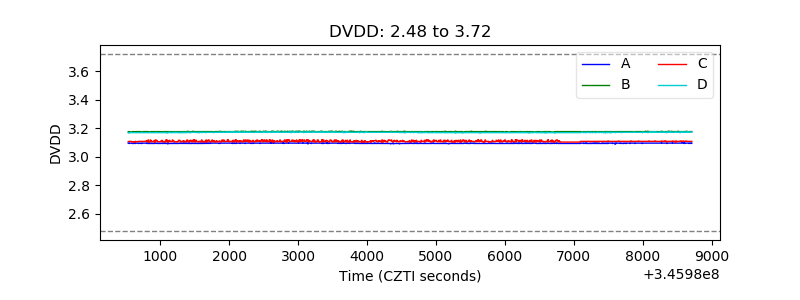 |
| Temperature 1 | 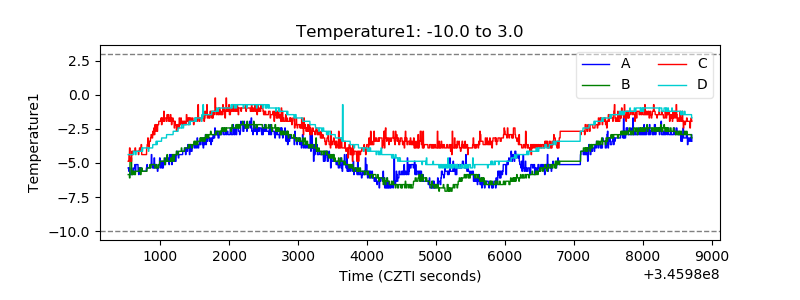 |
| Veto HV Monitor |  |
| Veto LLD | 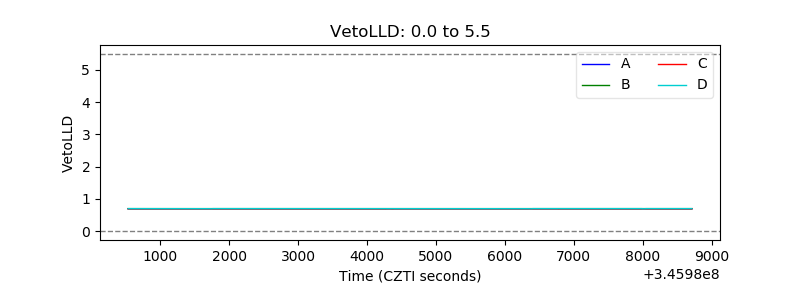 |
| Alpha Counter |  |
| _CPM_Rate | 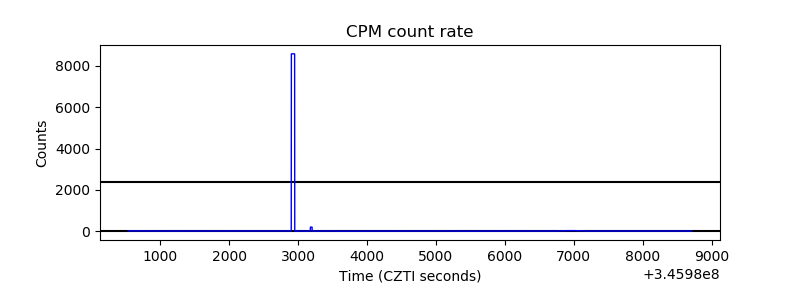 |
| CZT Counter | 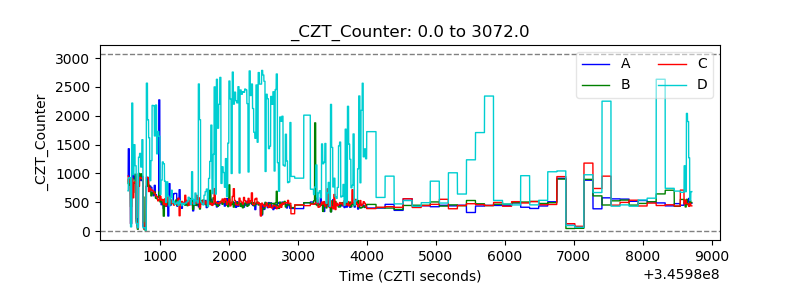 |
| +2.5 Volts monitor |  |
| +5 Volts monitor | 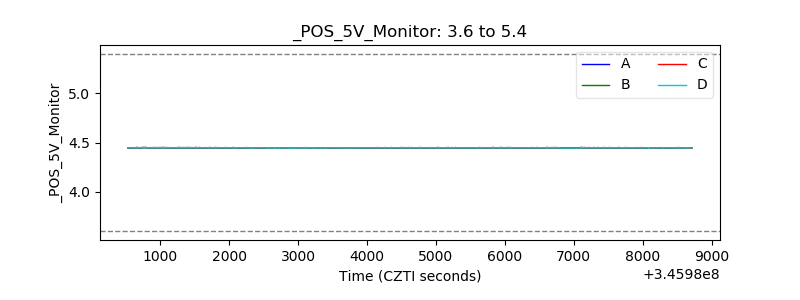 |
| _ROLL_ROT |  |
| _Roll_DEC | 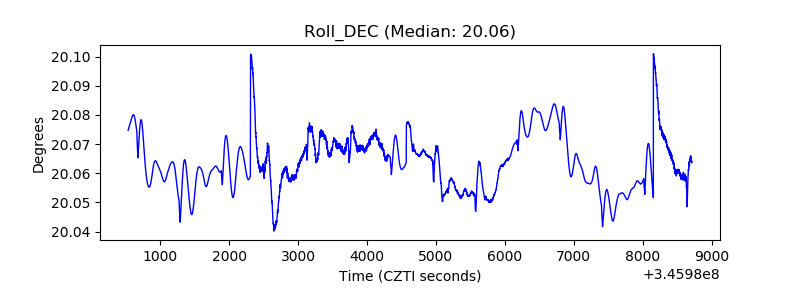 |
| _Roll_RA | 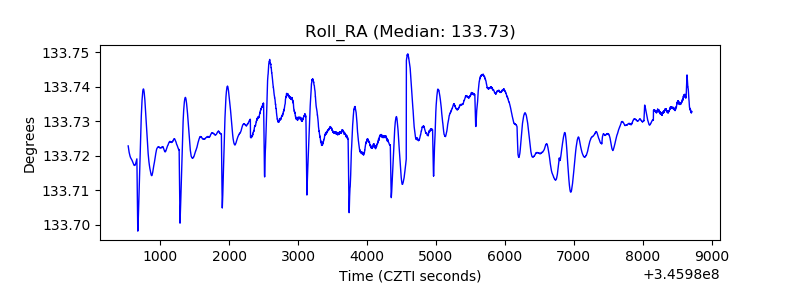 |
| Veto Counter | 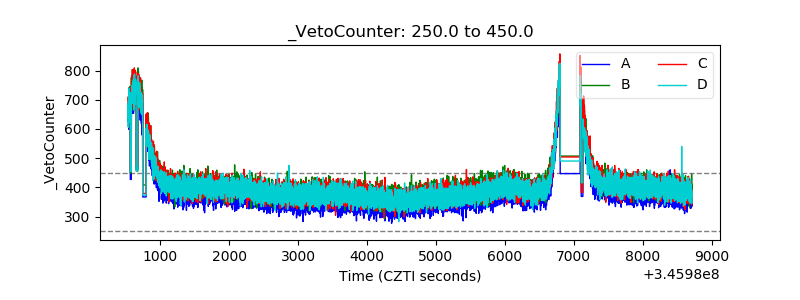 |