| Param | Original file | Final file |
|---|---|---|
| Filename | modeM0/AS1A10_067T01_9000004076_28249cztM0_level2.evt | modeM0/AS1A10_067T01_9000004076_28249cztM0_level2_quad_clean.evt |
| Size (bytes) | 1,411,292,160 | 230,284,800 |
| Size | 1.3 GB | 219.6 MB |
| Events in quadrant A | 8,833,214 | 1,465,207 |
| Events in quadrant B | 9,266,713 | 1,454,401 |
| Events in quadrant C | 9,549,691 | 1,393,693 |
| Events in quadrant D | 13,832,549 | 1,377,003 |
| Mode M0 | |||
|---|---|---|---|
| Quadrant | BADHDUFLAG | Total packets | Discarded packets |
| A | 0 | 38274 | 0 |
| B | 0 | 39563 | 0 |
| C | 0 | 40136 | 0 |
| D | 0 | 53794 | 0 |
| Mode M9 | |||
|---|---|---|---|
| Quadrant | BADHDUFLAG | Total packets | Discarded packets |
| A | 0 | 23 | 0 |
| B | 0 | 23 | 0 |
| C | 0 | 23 | 0 |
| D | 0 | 23 | 0 |
| Quadrant | Total seconds | Saturated seconds | Saturation percentage |
|---|---|---|---|
| A | 18626 | 212 | 1.138194% |
| B | 18626 | 283 | 1.519382% |
| C | 18626 | 419 | 2.249544% |
| D | 18626 | 1370 | 7.355310% |
Noise dominated data is calculated using 1-second bins in cleaned event files. If a bin has >2000 counts, and if more than 50% of those come from <1% of pixels, then it is considered to be noise-dominated and hence unusable.
| Quadrant | # 1 sec bins | Bins with >0 counts | Bins with >2000 counts | High rate bins dominated by noise | Noise dominated (total time) | Noise dominated (detector-on time) | Marked lightcurve |
|---|---|---|---|---|---|---|---|
| A | 21021 | 18628 | 0 | 0 | 0.00% | 0.00% | 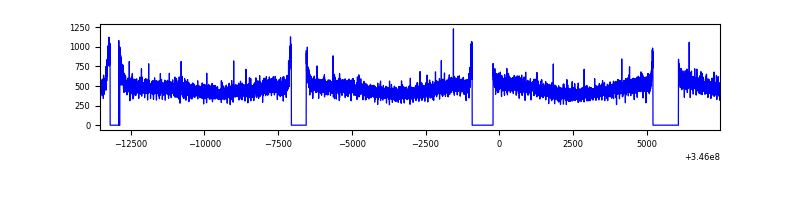 |
| B | 21021 | 18627 | 19 | 19 | 0.09% | 0.10% | 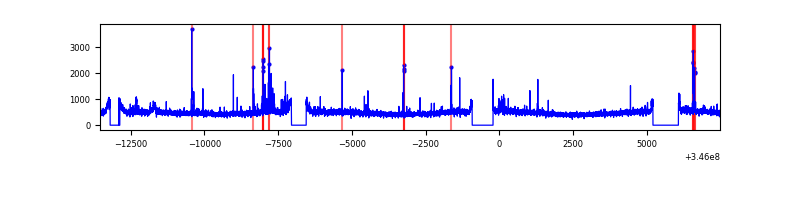 |
| C | 21021 | 18627 | 11 | 11 | 0.05% | 0.06% | 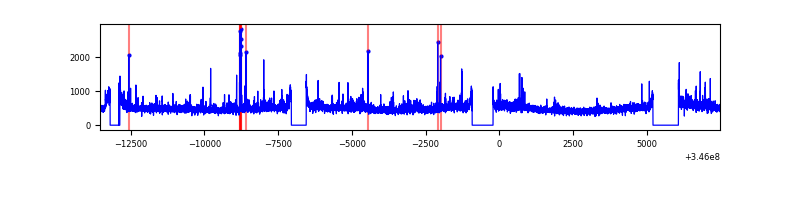 |
| D | 21021 | 18627 | 930 | 930 | 4.42% | 4.99% | 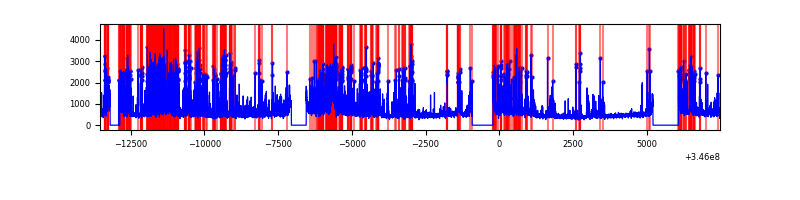 |
Top three noisy pixels from each quadrant. If the there are fewer than three noisy pixels in the level2.evt file, extra rows are filled as -1
| Pixel properties | Quadrant properties | ||||||
|---|---|---|---|---|---|---|---|
| Quadrant | DetID | PixID | Counts | Sigma | Mean | Median | Sigma |
| A | 13 | 254 | 30683 | 62.05 | 2284 | 2235 | 458.5 |
| A | 3 | 137 | 23263 | 45.87 | 2284 | 2235 | 458.5 |
| A | 0 | 226 | 19100 | 36.79 | 2284 | 2235 | 458.5 |
| B | 10 | 245 | 244698 | 559.52 | 2248 | 2186 | 433.4 |
| B | 4 | 200 | 87381 | 196.56 | 2248 | 2186 | 433.4 |
| B | 12 | 111 | 55227 | 122.37 | 2248 | 2186 | 433.4 |
| C | 3 | 233 | 685900 | 1337.65 | 2175 | 2193 | 511.1 |
| C | 14 | 238 | 347237 | 675.07 | 2175 | 2193 | 511.1 |
| C | 2 | 16 | 35776 | 65.7 | 2175 | 2193 | 511.1 |
| D | 1 | 52 | 3586191 | 6962.69 | 2153 | 2094 | 514.8 |
| D | 2 | 250 | 743165 | 1439.65 | 2153 | 2094 | 514.8 |
| D | 5 | 222 | 486470 | 940.98 | 2153 | 2094 | 514.8 |
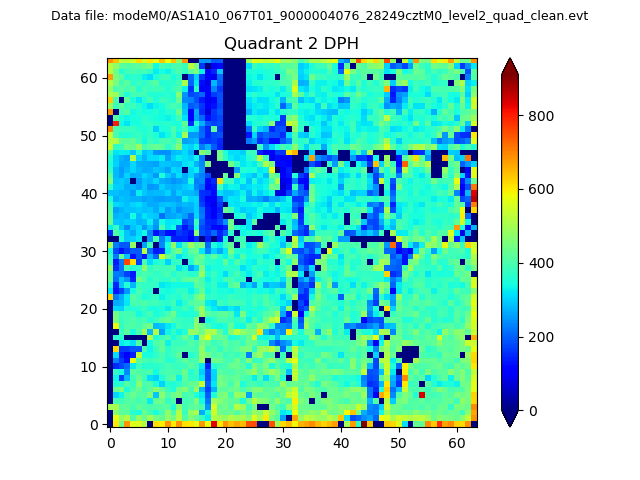
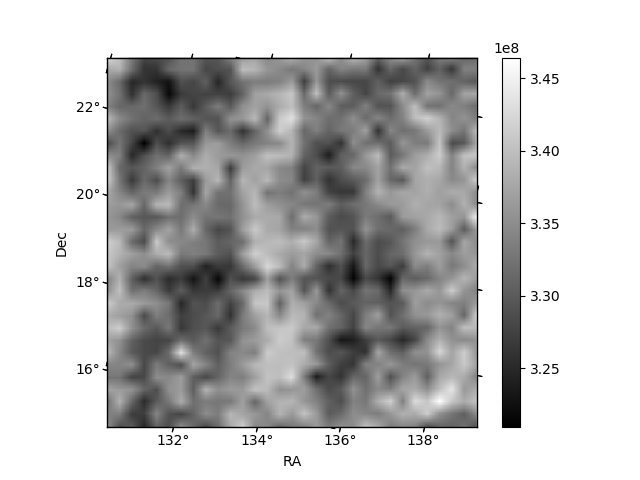
Histogram calculated using DETX and DETY for each event in the final _common_clean file
| Quadrant A | 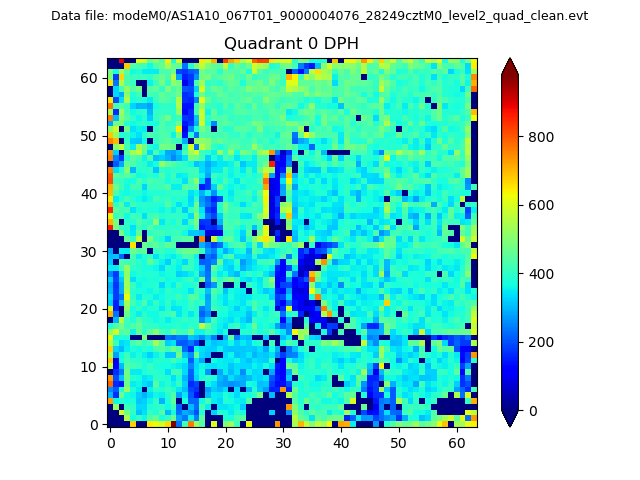 |
 |
Quadrant B |
|---|---|---|---|
| Quadrant D |  |
 |
Quadrant C |
| Plot type | Count rate plots | Images |
|---|---|---|
| Comparison with Poisson distribution Blue bars denote a histogram of data divided into 1 sec bins. Red curve is a Poisson curve with rate = median count rate of data. |
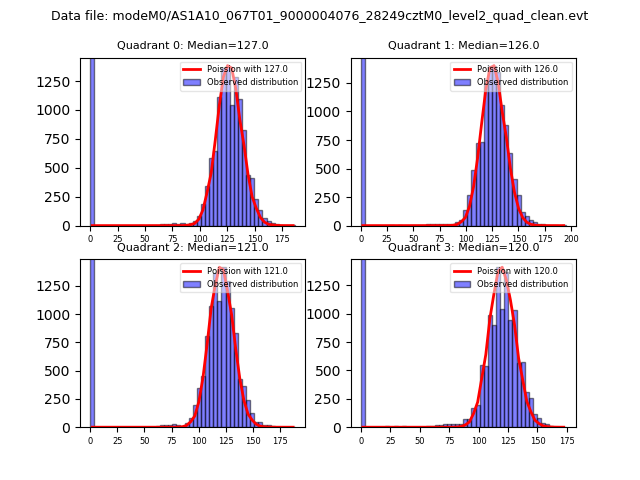 |
 |
| Quadrant-wise count rates Data is divided into 100 sec bins |
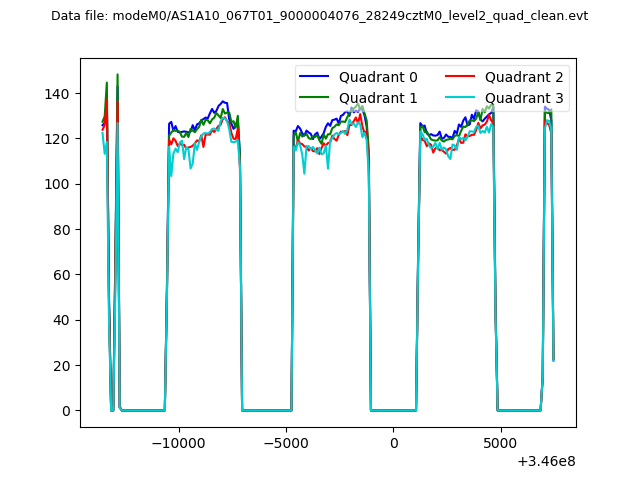 |
|
| Module-wise count rates for Quadrant A Data is divided into 100 sec bins |
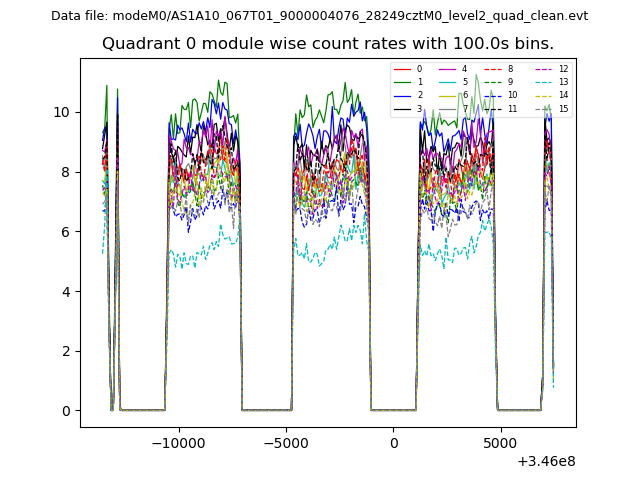 |
 |
| Module-wise count rates for Quadrant B Data is divided into 100 sec bins |
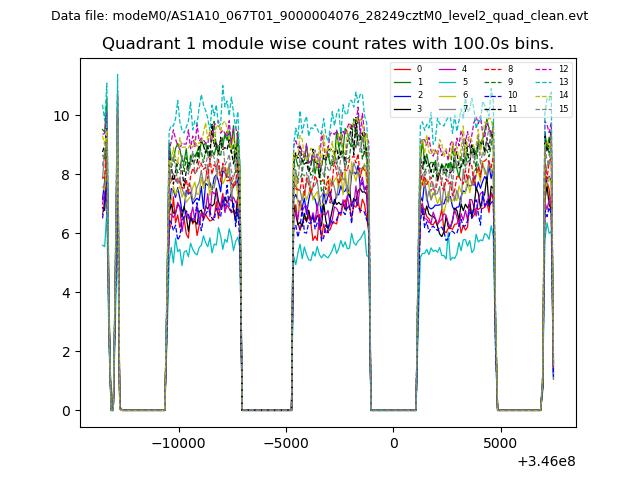 |
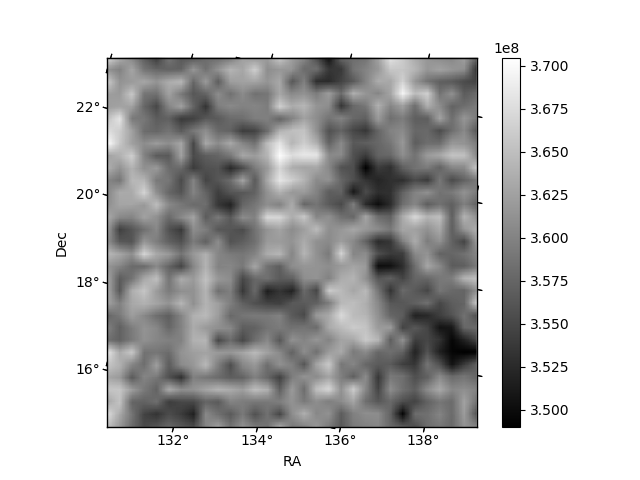 |
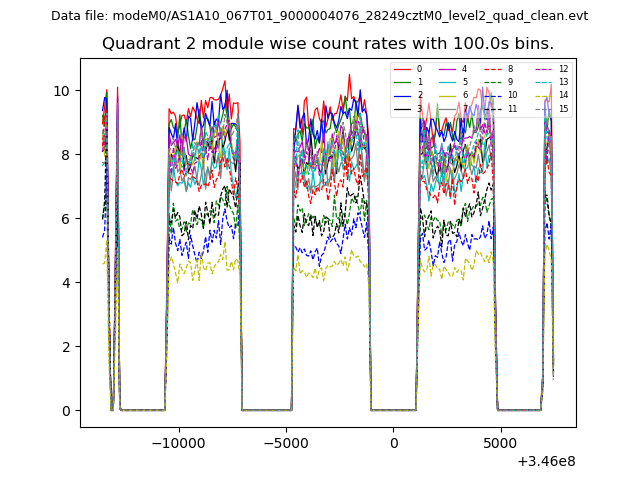
| Module-wise count rates for Quadrant C Data is divided into 100 sec bins |
 |
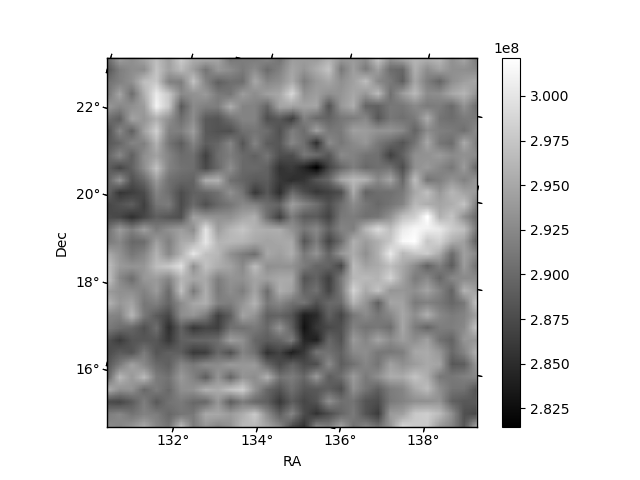 |
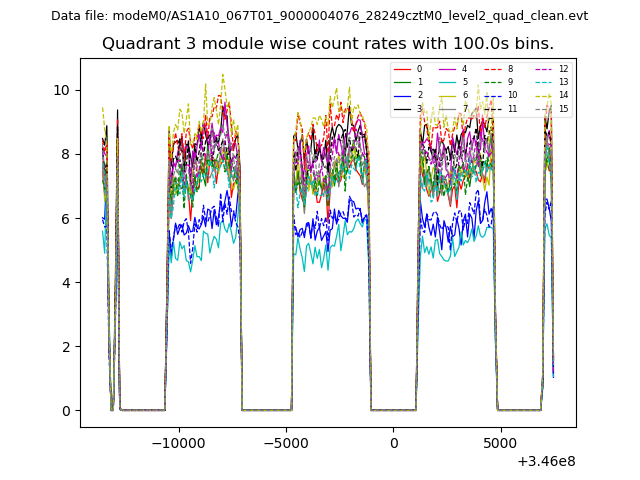
| Module-wise count rates for Quadrant D Data is divided into 100 sec bins |
 |
 |
| Parameter | Plot |
|---|---|
| CZT HV Monitor | 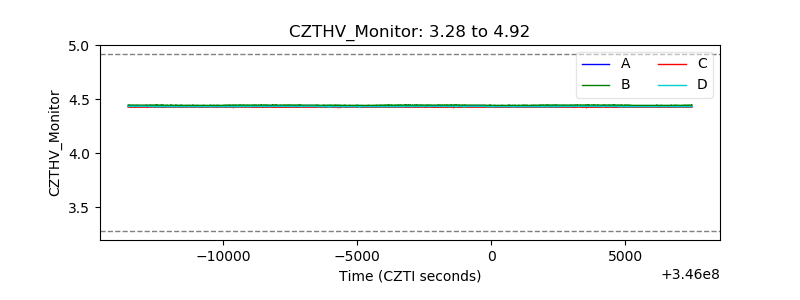 |
| D_VDD | 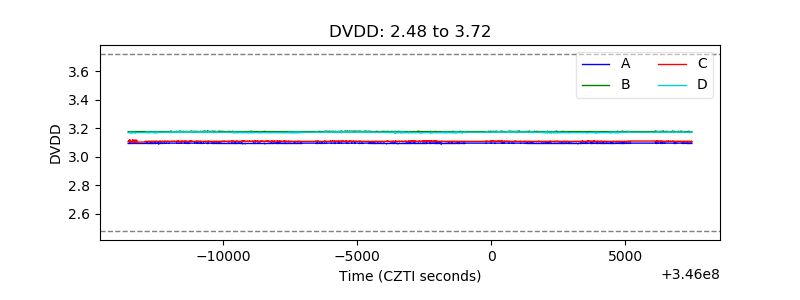 |
| Temperature 1 | 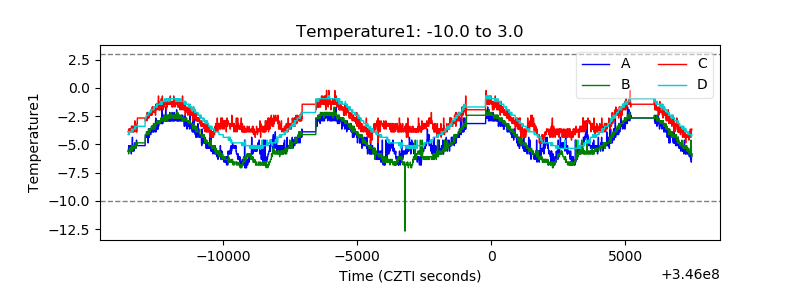 |
| Veto HV Monitor | 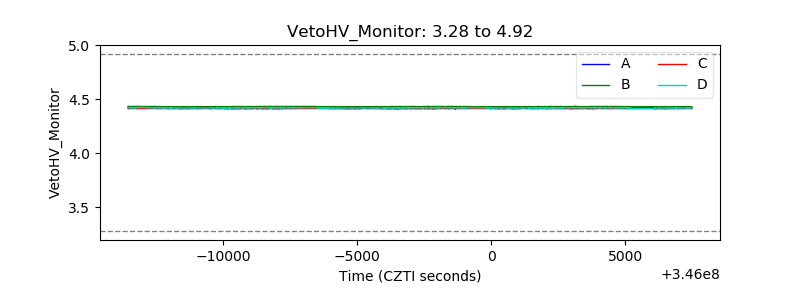 |
| Veto LLD | 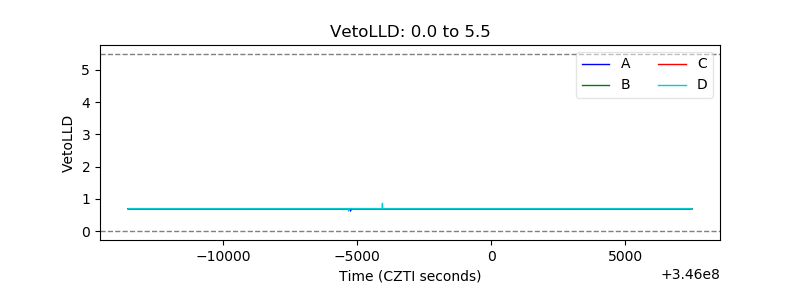 |
| Alpha Counter | 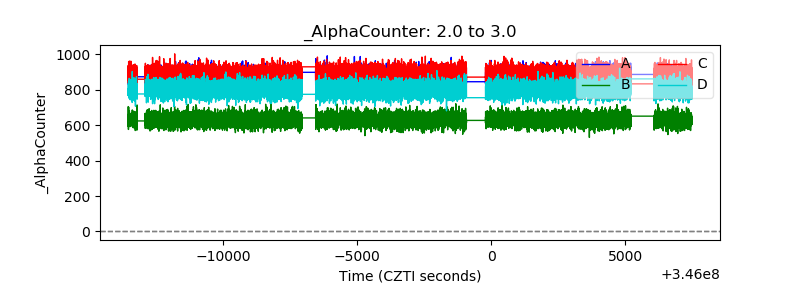 |
| _CPM_Rate | 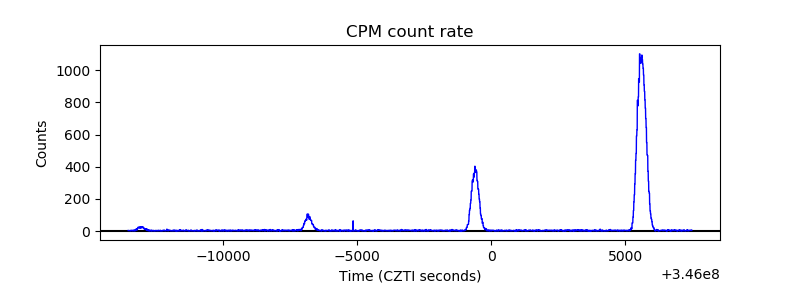 |
| CZT Counter | 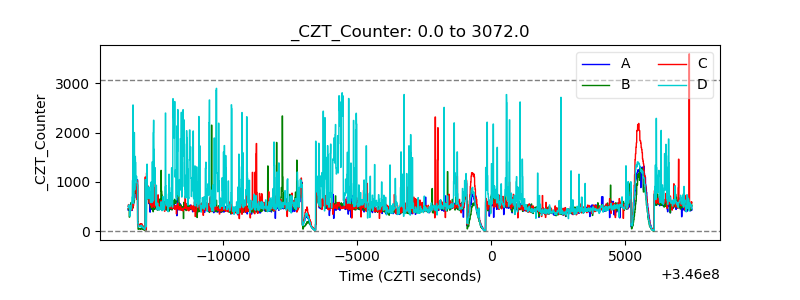 |
| +2.5 Volts monitor |  |
| +5 Volts monitor |  |
| _ROLL_ROT | 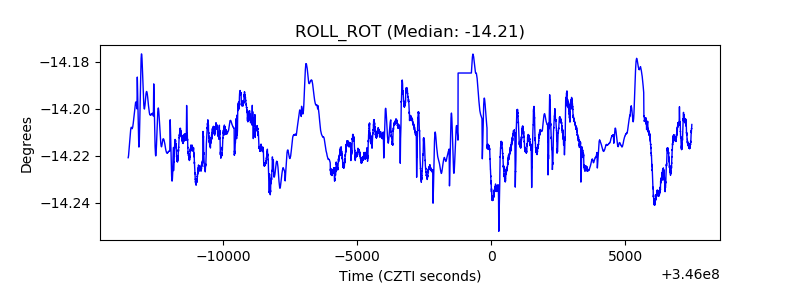 |
| _Roll_DEC | 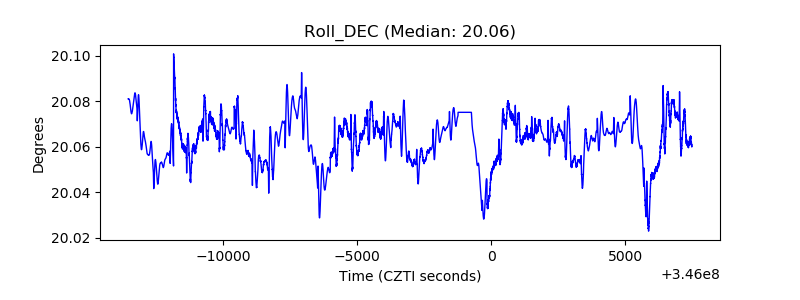 |
| _Roll_RA | 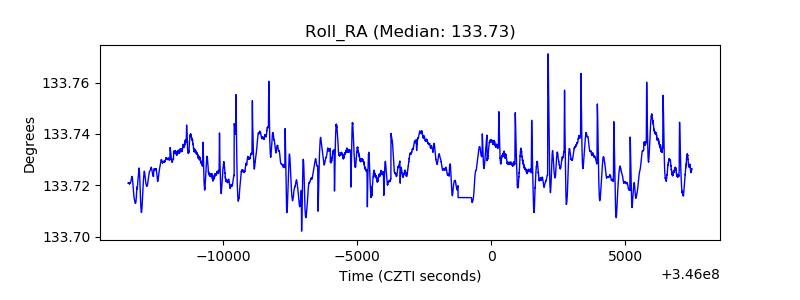 |
| Veto Counter | 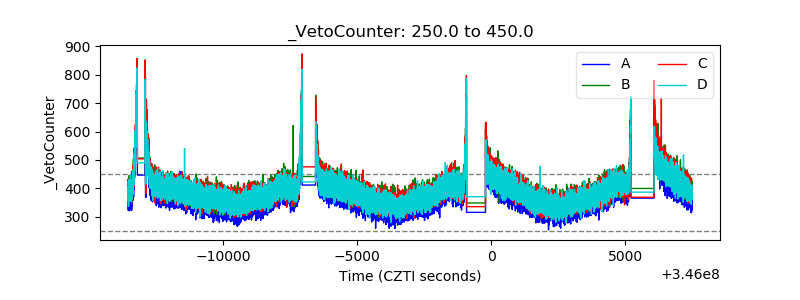 |