| Param | Original file | Final file |
|---|---|---|
| Filename | modeM0/AS1A10_067T01_9000004076_28250cztM0_level2.evt | modeM0/AS1A10_067T01_9000004076_28250cztM0_level2_quad_clean.evt |
| Size (bytes) | 539,233,920 | 87,180,480 |
| Size | 514.3 MB | 83.1 MB |
| Events in quadrant A | 3,355,817 | 559,264 |
| Events in quadrant B | 3,539,192 | 558,281 |
| Events in quadrant C | 3,590,676 | 536,626 |
| Events in quadrant D | 5,375,234 | 503,430 |
| Mode M0 | |||
|---|---|---|---|
| Quadrant | BADHDUFLAG | Total packets | Discarded packets |
| A | 0 | 14440 | 0 |
| B | 0 | 15069 | 0 |
| C | 0 | 15241 | 0 |
| D | 0 | 20748 | 0 |
| Mode M9 | |||
|---|---|---|---|
| Quadrant | BADHDUFLAG | Total packets | Discarded packets |
| A | 0 | 18 | 0 |
| B | 0 | 18 | 0 |
| C | 0 | 18 | 0 |
| D | 0 | 18 | 0 |
| Quadrant | Total seconds | Saturated seconds | Saturation percentage |
|---|---|---|---|
| A | 6917 | 41 | 0.592743% |
| B | 6918 | 92 | 1.329864% |
| C | 6918 | 129 | 1.864701% |
| D | 6918 | 595 | 8.600752% |
Noise dominated data is calculated using 1-second bins in cleaned event files. If a bin has >2000 counts, and if more than 50% of those come from <1% of pixels, then it is considered to be noise-dominated and hence unusable.
| Quadrant | # 1 sec bins | Bins with >0 counts | Bins with >2000 counts | High rate bins dominated by noise | Noise dominated (total time) | Noise dominated (detector-on time) | Marked lightcurve |
|---|---|---|---|---|---|---|---|
| A | 8813 | 6919 | 0 | 0 | 0.00% | 0.00% | 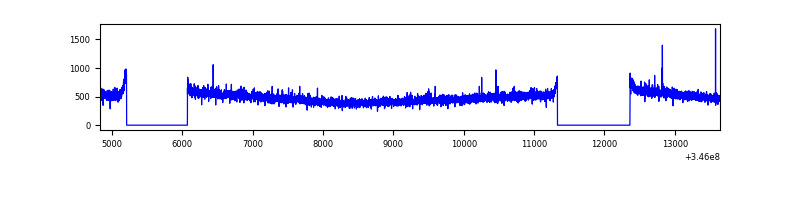 |
| B | 8814 | 6919 | 14 | 14 | 0.16% | 0.20% | 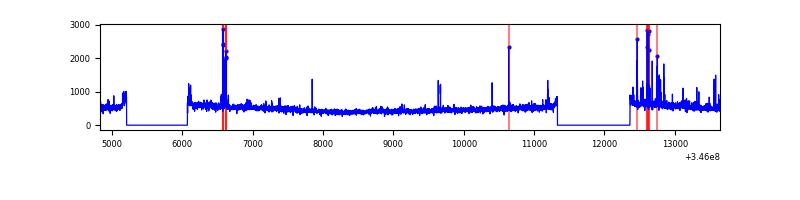 |
| C | 8814 | 6919 | 0 | 0 | 0.00% | 0.00% | 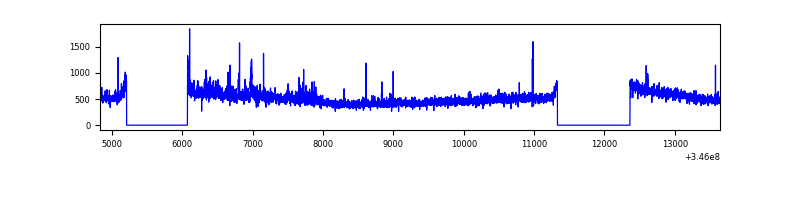 |
| D | 8814 | 6919 | 514 | 514 | 5.83% | 7.43% | 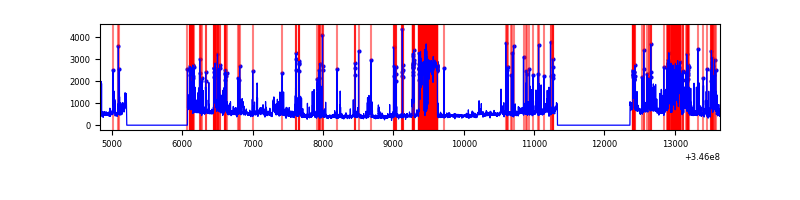 |
Top three noisy pixels from each quadrant. If the there are fewer than three noisy pixels in the level2.evt file, extra rows are filled as -1
| Pixel properties | Quadrant properties | ||||||
|---|---|---|---|---|---|---|---|
| Quadrant | DetID | PixID | Counts | Sigma | Mean | Median | Sigma |
| A | 13 | 254 | 11395 | 60.68 | 865 | 848 | 173.8 |
| A | 3 | 137 | 8548 | 44.3 | 865 | 848 | 173.8 |
| A | 0 | 226 | 7336 | 37.33 | 865 | 848 | 173.8 |
| B | 10 | 246 | 57088 | 339.66 | 855 | 831 | 165.6 |
| B | 4 | 200 | 45923 | 272.25 | 855 | 831 | 165.6 |
| B | 10 | 245 | 31387 | 184.48 | 855 | 831 | 165.6 |
| C | 3 | 233 | 173687 | 890.95 | 828 | 835 | 194.0 |
| C | 14 | 238 | 134713 | 690.06 | 828 | 835 | 194.0 |
| C | 1 | 90 | 40941 | 206.72 | 828 | 835 | 194.0 |
| D | 7 | 238 | 998729 | 5143.35 | 808 | 785 | 194.0 |
| D | 1 | 52 | 608448 | 3131.86 | 808 | 785 | 194.0 |
| D | 2 | 250 | 419424 | 2157.64 | 808 | 785 | 194.0 |
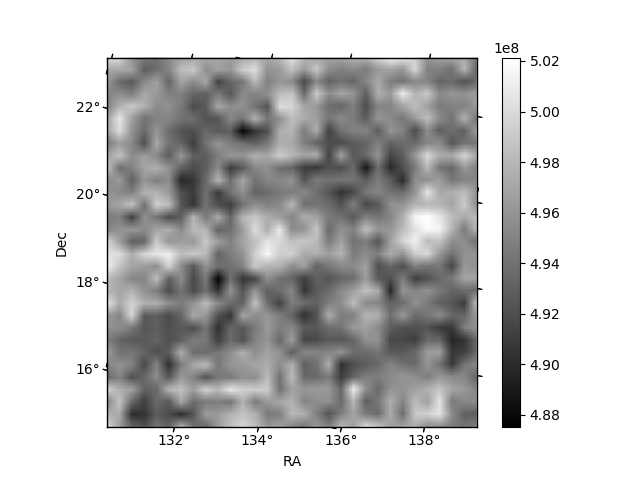
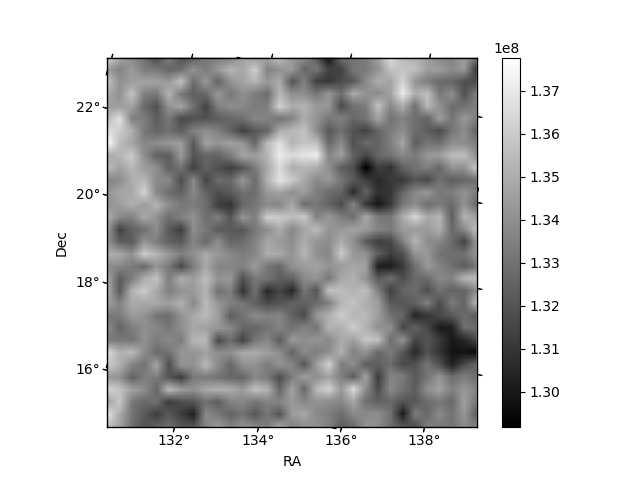
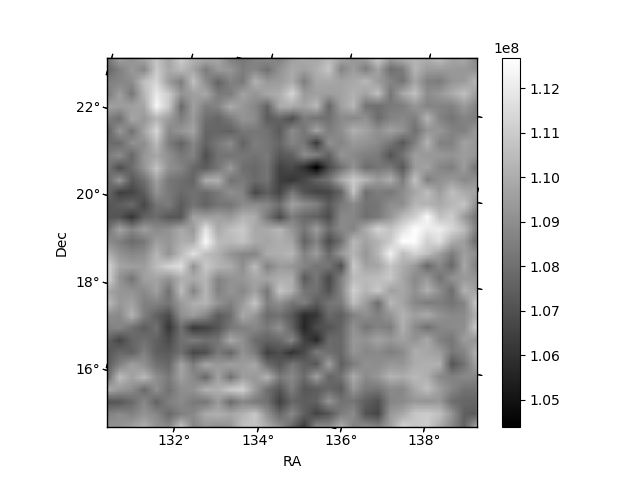
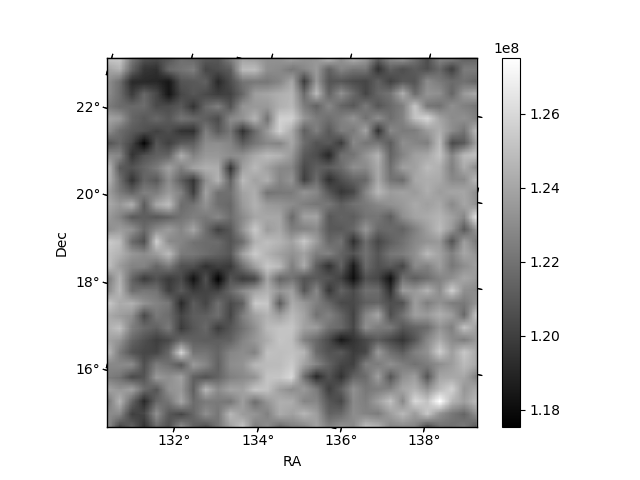
Histogram calculated using DETX and DETY for each event in the final _common_clean file
| Quadrant A | 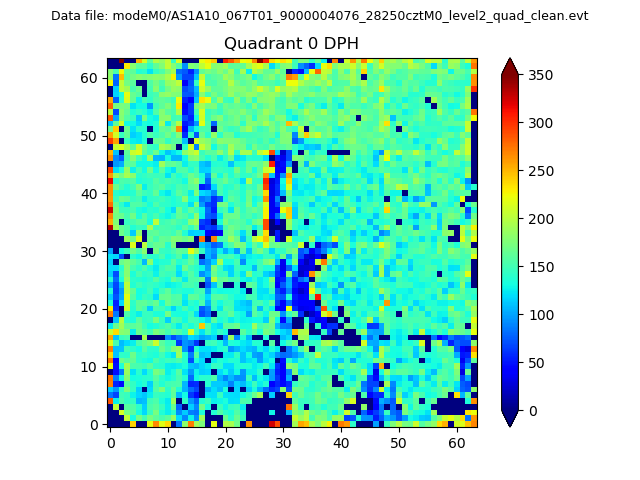 |
 |
Quadrant B |
|---|---|---|---|
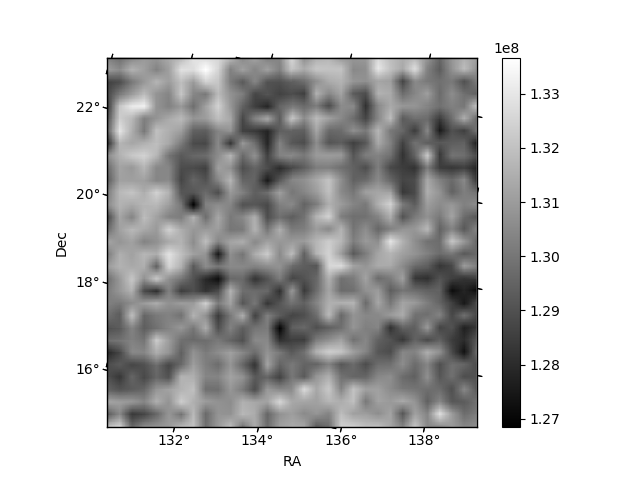
| Quadrant D | 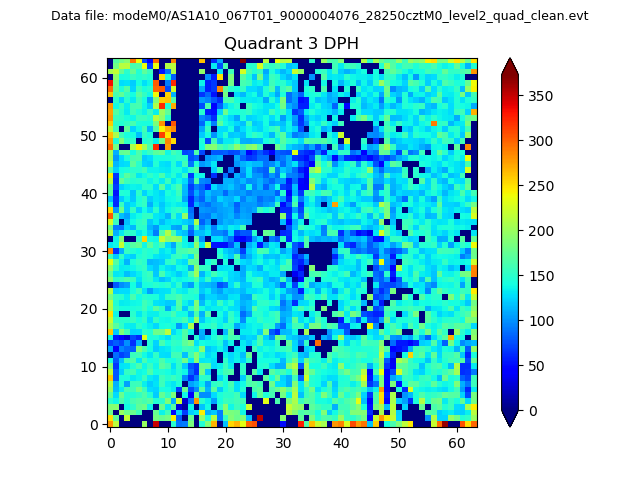 |
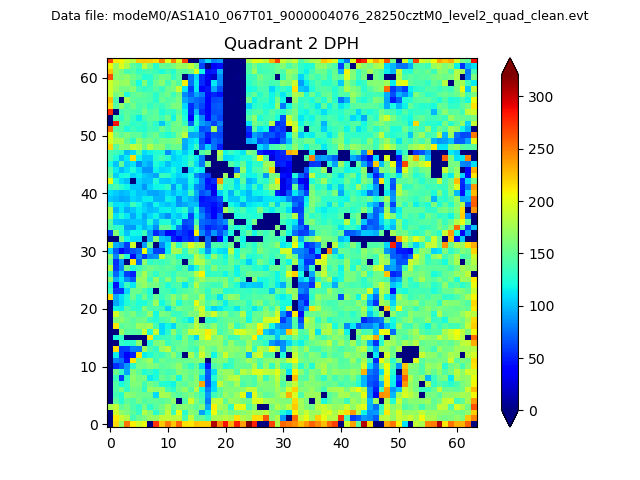 |
Quadrant C |
| Plot type | Count rate plots | Images |
|---|---|---|
| Comparison with Poisson distribution Blue bars denote a histogram of data divided into 1 sec bins. Red curve is a Poisson curve with rate = median count rate of data. |
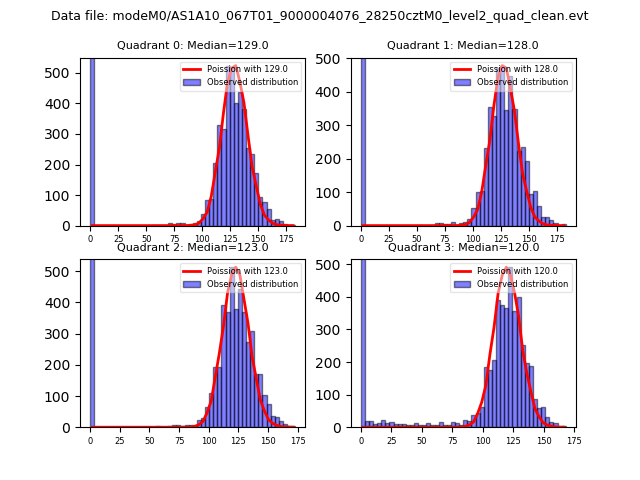 |
 |
| Quadrant-wise count rates Data is divided into 100 sec bins |
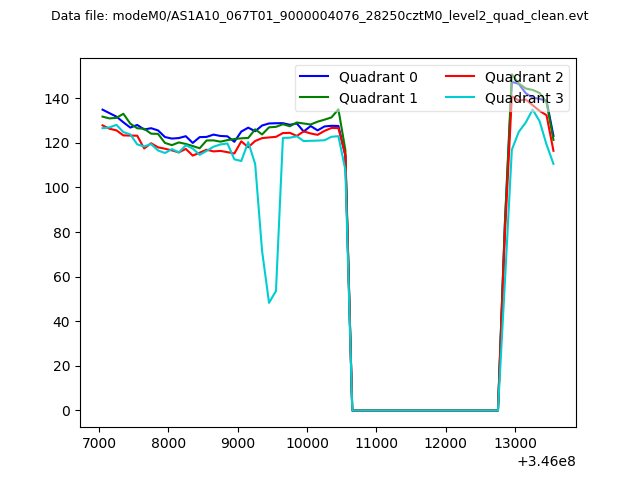 |
|
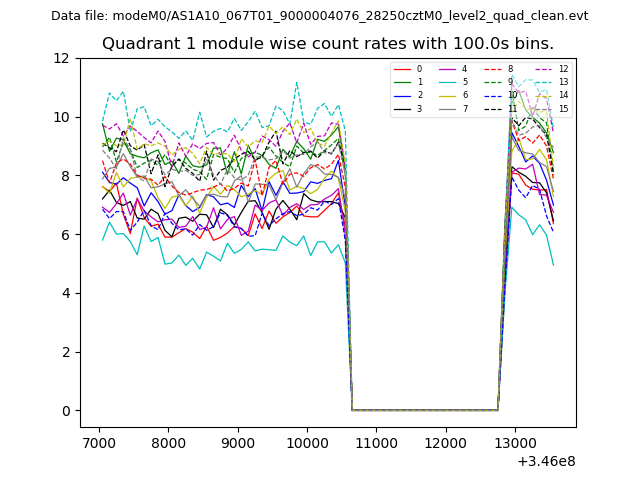
| Module-wise count rates for Quadrant A Data is divided into 100 sec bins |
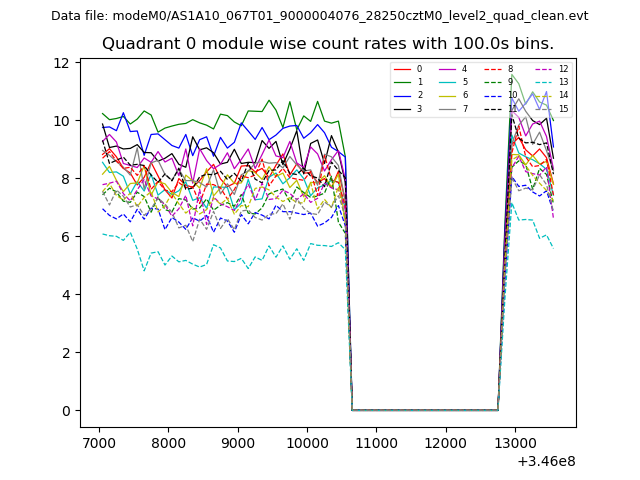 |
 |
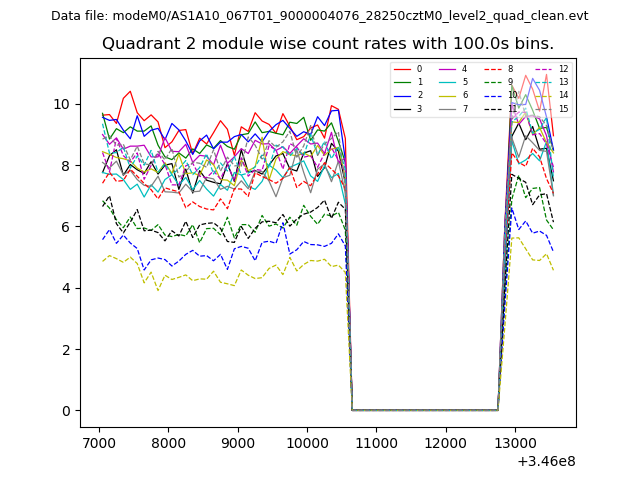
| Module-wise count rates for Quadrant B Data is divided into 100 sec bins |
 |
 |
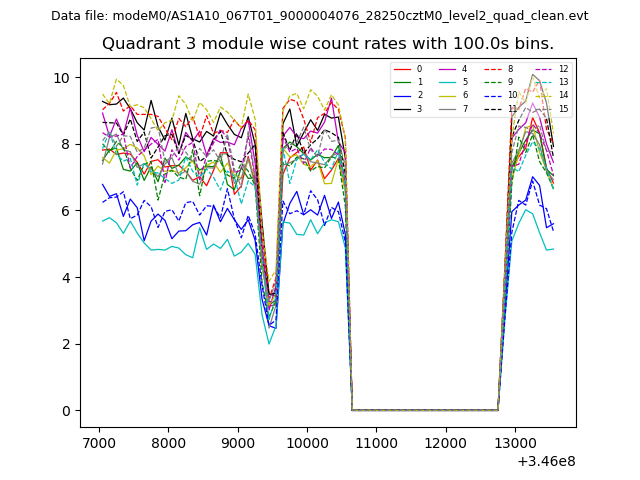
| Module-wise count rates for Quadrant C Data is divided into 100 sec bins |
 |
 |
| Module-wise count rates for Quadrant D Data is divided into 100 sec bins |
 |
 |
| Parameter | Plot |
|---|---|
| CZT HV Monitor | 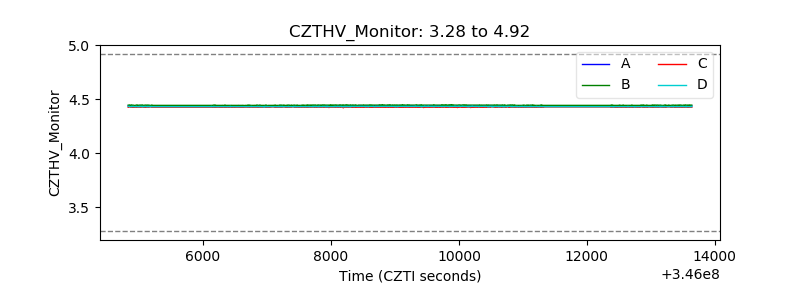 |
| D_VDD | 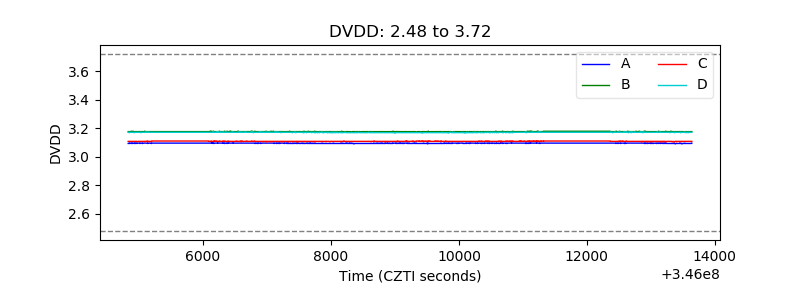 |
| Temperature 1 | 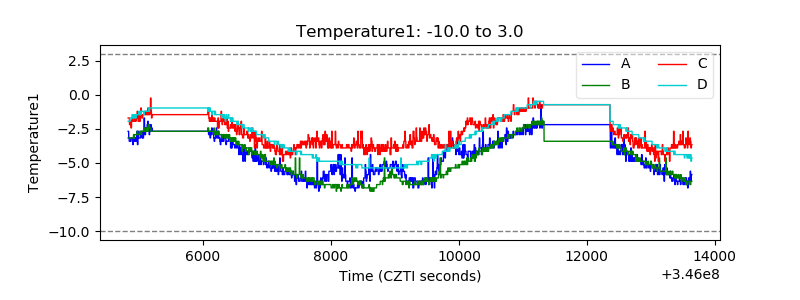 |
| Veto HV Monitor | 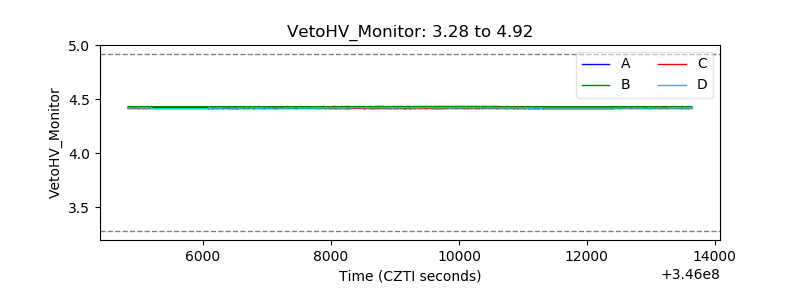 |
| Veto LLD | 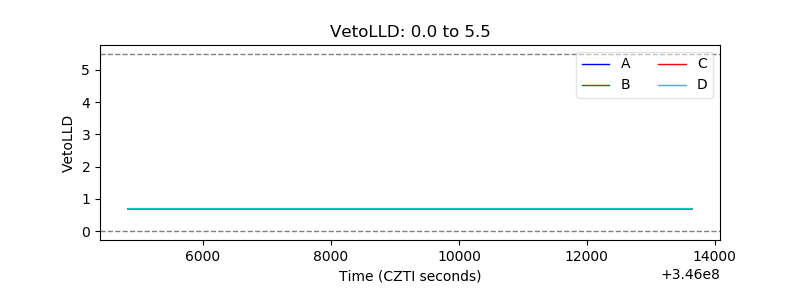 |
| Alpha Counter | 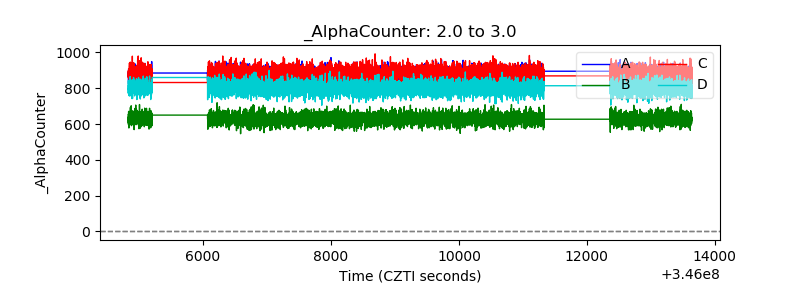 |
| _CPM_Rate |  |
| CZT Counter | 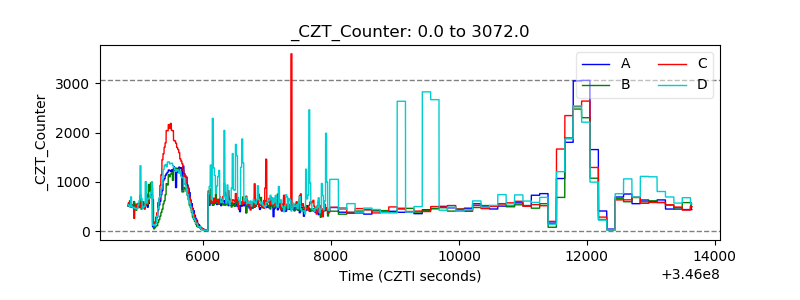 |
| +2.5 Volts monitor |  |
| +5 Volts monitor | 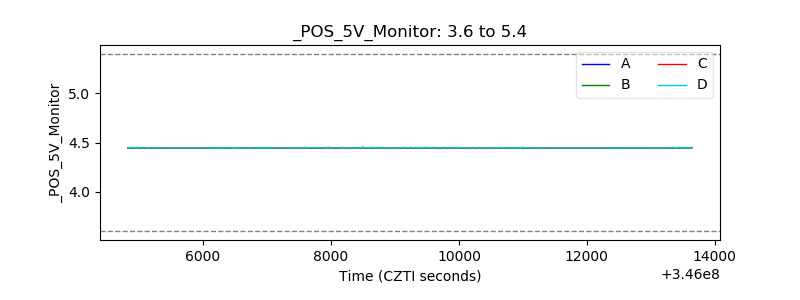 |
| _ROLL_ROT | 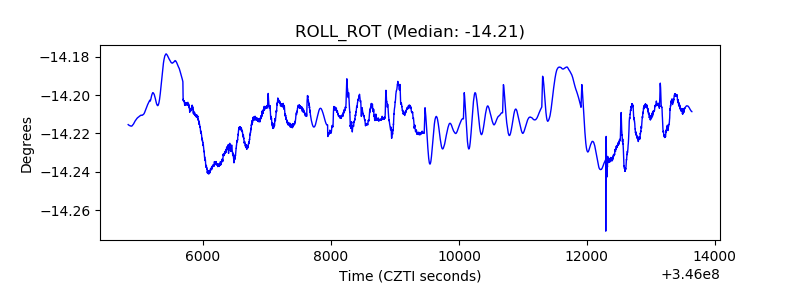 |
| _Roll_DEC | 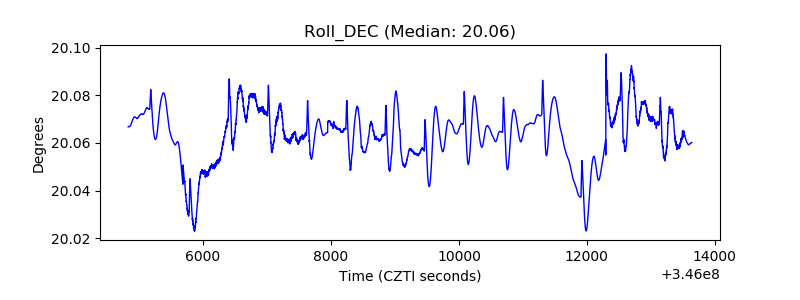 |
| _Roll_RA | 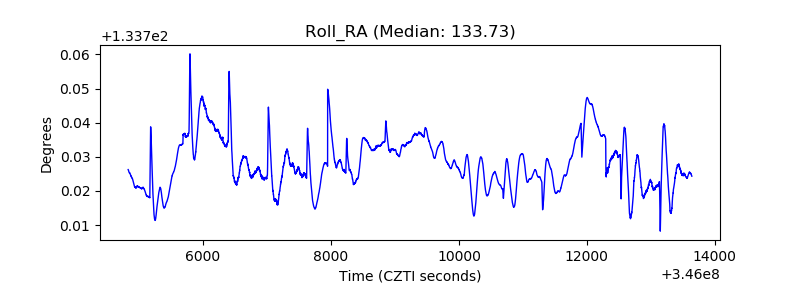 |
| Veto Counter | 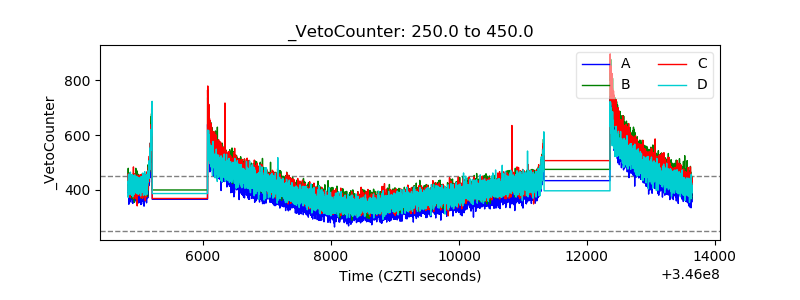 |