| Param | Original file | Final file |
|---|---|---|
| Filename | modeM0/AS1A10_067T01_9000004076_28252cztM0_level2.evt | modeM0/AS1A10_067T01_9000004076_28252cztM0_level2_quad_clean.evt |
| Size (bytes) | 545,607,360 | 101,050,560 |
| Size | 520.3 MB | 96.4 MB |
| Events in quadrant A | 3,329,658 | 672,034 |
| Events in quadrant B | 3,507,605 | 681,754 |
| Events in quadrant C | 3,629,382 | 640,862 |
| Events in quadrant D | 5,599,584 | 595,154 |
| Mode M0 | |||
|---|---|---|---|
| Quadrant | BADHDUFLAG | Total packets | Discarded packets |
| A | 0 | 14288 | 0 |
| B | 0 | 14944 | 0 |
| C | 0 | 15242 | 0 |
| D | 0 | 21231 | 0 |
| Mode M9 | |||
|---|---|---|---|
| Quadrant | BADHDUFLAG | Total packets | Discarded packets |
| A | 0 | 21 | 0 |
| B | 0 | 21 | 0 |
| C | 0 | 21 | 0 |
| D | 0 | 21 | 0 |
| Quadrant | Total seconds | Saturated seconds | Saturation percentage |
|---|---|---|---|
| A | 6745 | 34 | 0.504077% |
| B | 6746 | 65 | 0.963534% |
| C | 6745 | 100 | 1.482580% |
| D | 6745 | 653 | 9.681245% |
Noise dominated data is calculated using 1-second bins in cleaned event files. If a bin has >2000 counts, and if more than 50% of those come from <1% of pixels, then it is considered to be noise-dominated and hence unusable.
| Quadrant | # 1 sec bins | Bins with >0 counts | Bins with >2000 counts | High rate bins dominated by noise | Noise dominated (total time) | Noise dominated (detector-on time) | Marked lightcurve |
|---|---|---|---|---|---|---|---|
| A | 8906 | 6747 | 0 | 0 | 0.00% | 0.00% | 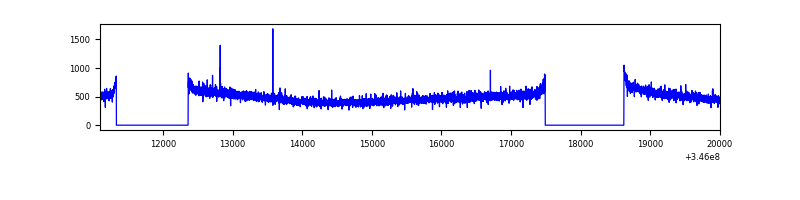 |
| B | 8907 | 6748 | 9 | 9 | 0.10% | 0.13% | 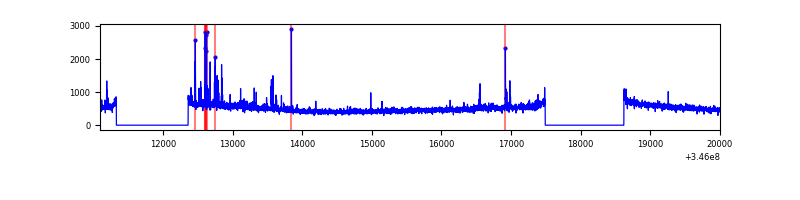 |
| C | 8906 | 6747 | 3 | 3 | 0.03% | 0.04% | 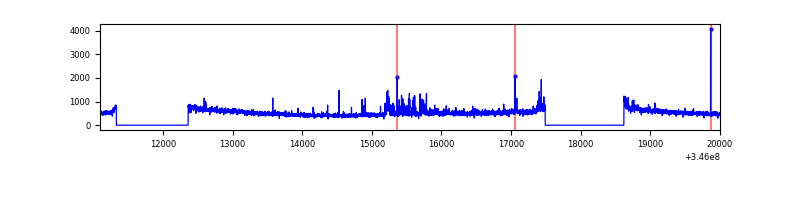 |
| D | 8906 | 6746 | 589 | 589 | 6.61% | 8.73% | 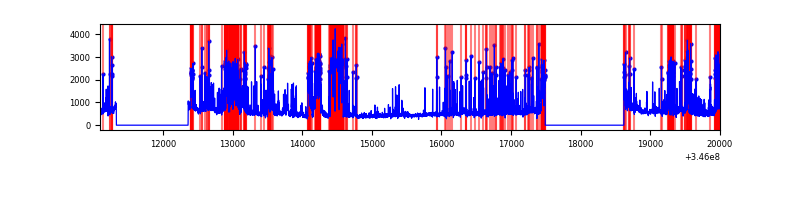 |
Top three noisy pixels from each quadrant. If the there are fewer than three noisy pixels in the level2.evt file, extra rows are filled as -1
| Pixel properties | Quadrant properties | ||||||
|---|---|---|---|---|---|---|---|
| Quadrant | DetID | PixID | Counts | Sigma | Mean | Median | Sigma |
| A | 13 | 254 | 10623 | 56.88 | 859 | 842 | 172.0 |
| A | 3 | 137 | 8384 | 43.86 | 859 | 842 | 172.0 |
| A | 0 | 226 | 7392 | 38.09 | 859 | 842 | 172.0 |
| B | 10 | 246 | 77248 | 472.03 | 855 | 835 | 161.9 |
| B | 10 | 245 | 35288 | 212.83 | 855 | 835 | 161.9 |
| B | 12 | 111 | 20015 | 118.48 | 855 | 835 | 161.9 |
| C | 14 | 238 | 132586 | 689.77 | 822 | 830 | 191.0 |
| C | 3 | 233 | 119393 | 620.7 | 822 | 830 | 191.0 |
| C | 9 | 221 | 102851 | 534.1 | 822 | 830 | 191.0 |
| D | 1 | 52 | 808078 | 4309.07 | 791 | 771 | 187.4 |
| D | 5 | 222 | 785578 | 4188.97 | 791 | 771 | 187.4 |
| D | 8 | 195 | 429356 | 2287.61 | 791 | 771 | 187.4 |
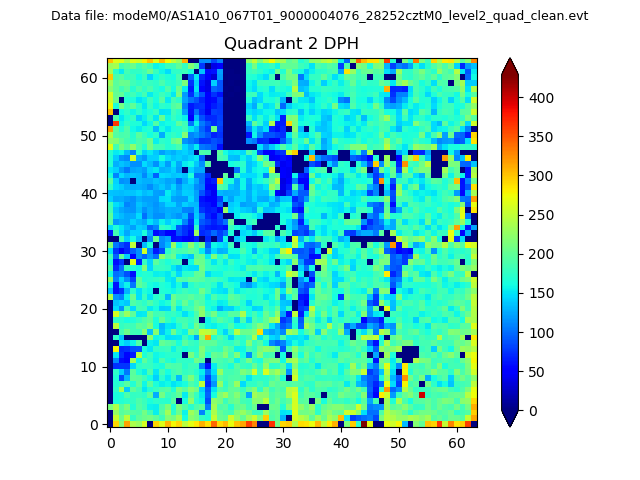
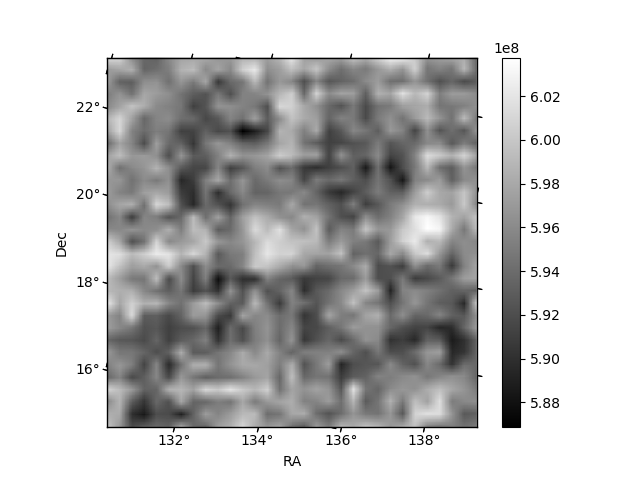
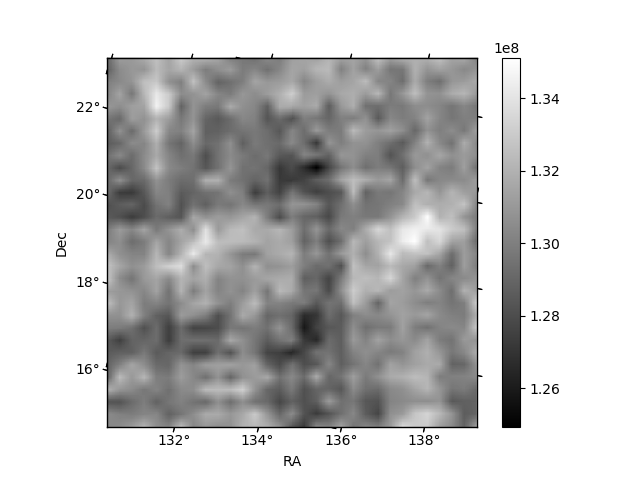
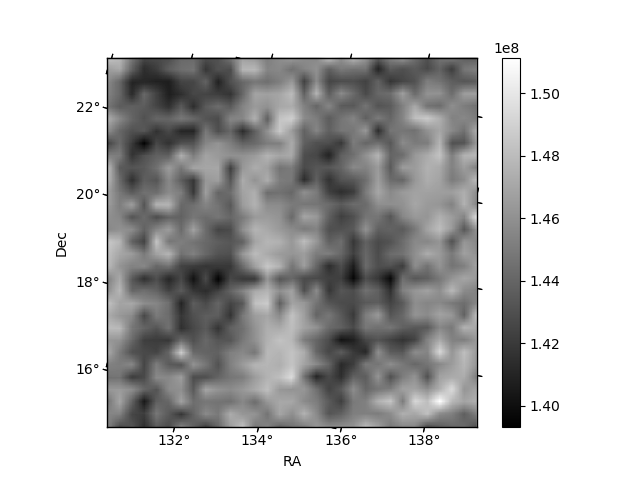
Histogram calculated using DETX and DETY for each event in the final _common_clean file
| Quadrant A | 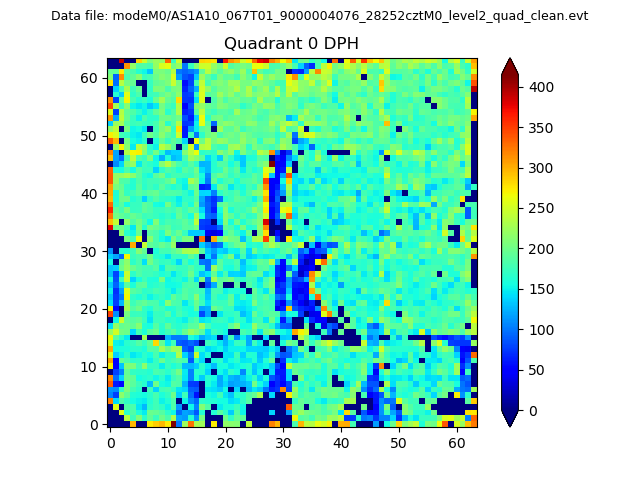 |
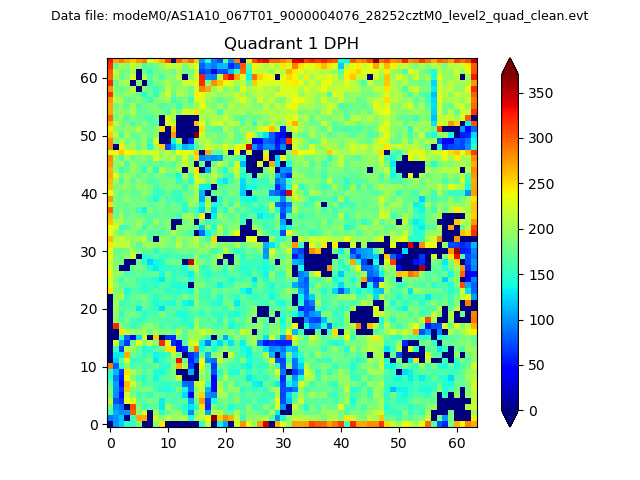 |
Quadrant B |
|---|---|---|---|
| Quadrant D | 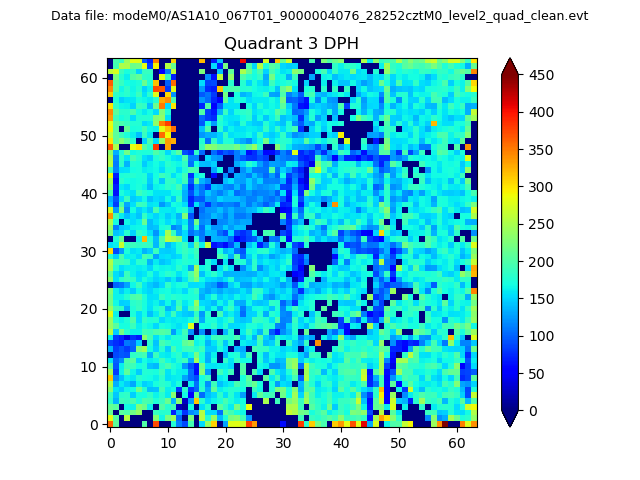 |
 |
Quadrant C |
| Plot type | Count rate plots | Images |
|---|---|---|
| Comparison with Poisson distribution Blue bars denote a histogram of data divided into 1 sec bins. Red curve is a Poisson curve with rate = median count rate of data. |
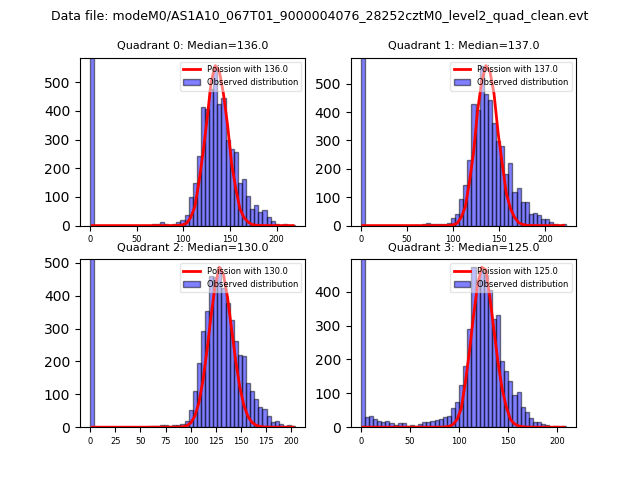 |
 |
| Quadrant-wise count rates Data is divided into 100 sec bins |
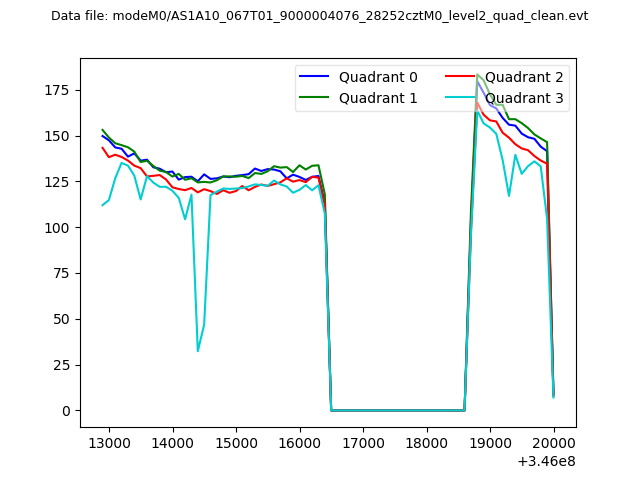 |
|
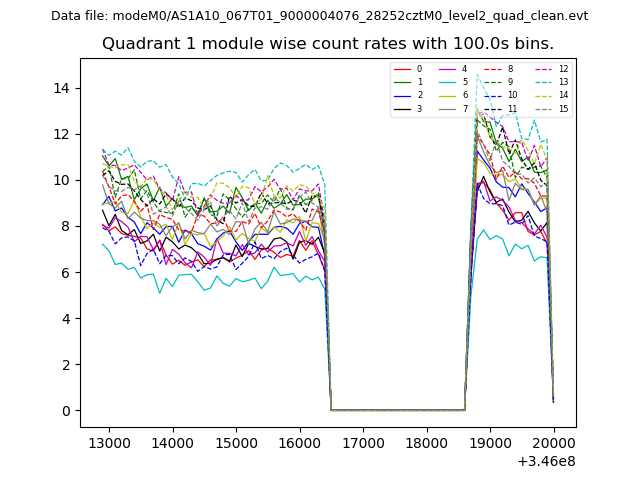
| Module-wise count rates for Quadrant A Data is divided into 100 sec bins |
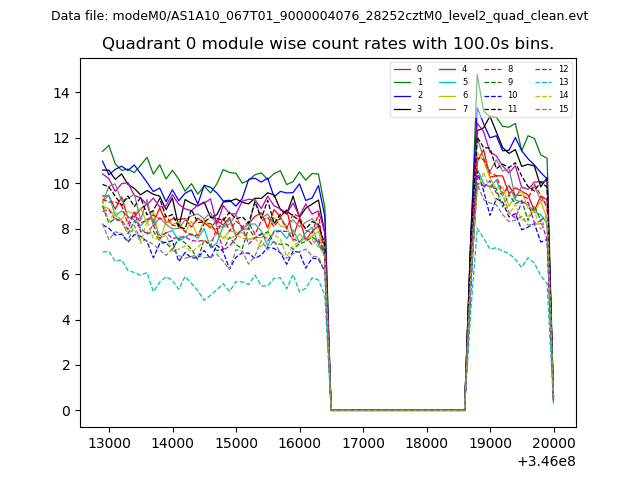 |
 |
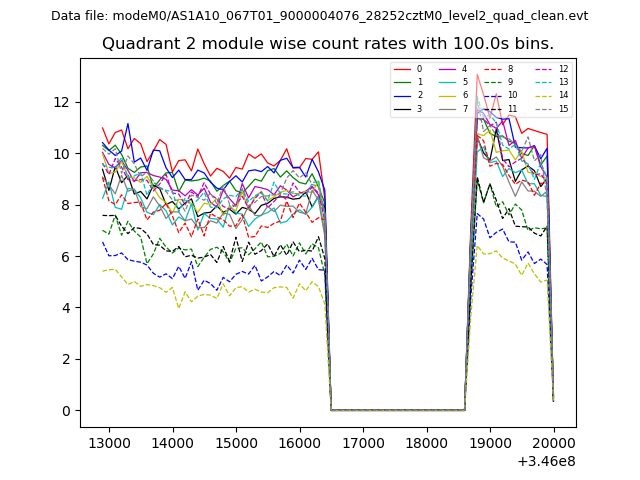
| Module-wise count rates for Quadrant B Data is divided into 100 sec bins |
 |
 |
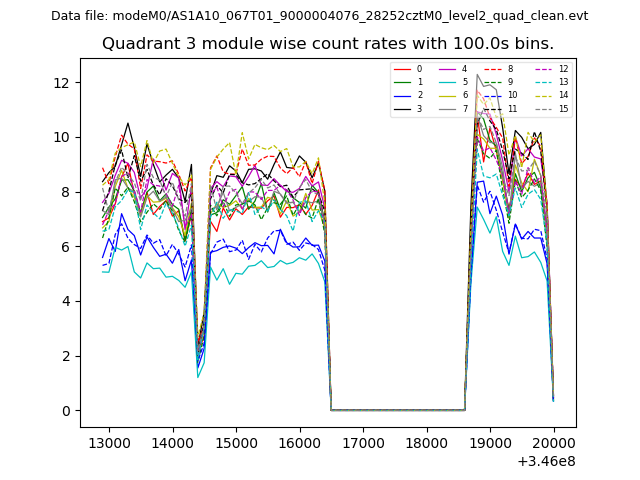
| Module-wise count rates for Quadrant C Data is divided into 100 sec bins |
 |
 |
| Module-wise count rates for Quadrant D Data is divided into 100 sec bins |
 |
 |
| Parameter | Plot |
|---|---|
| CZT HV Monitor |  |
| D_VDD | 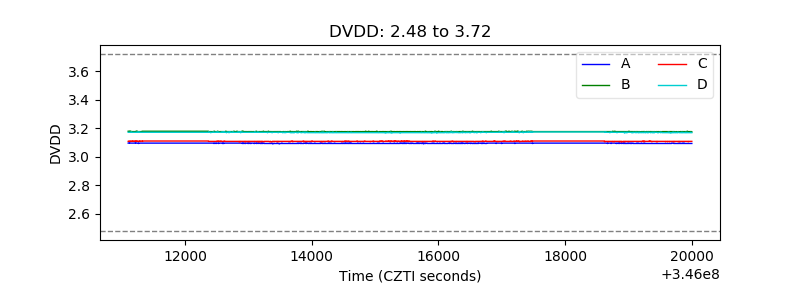 |
| Temperature 1 | 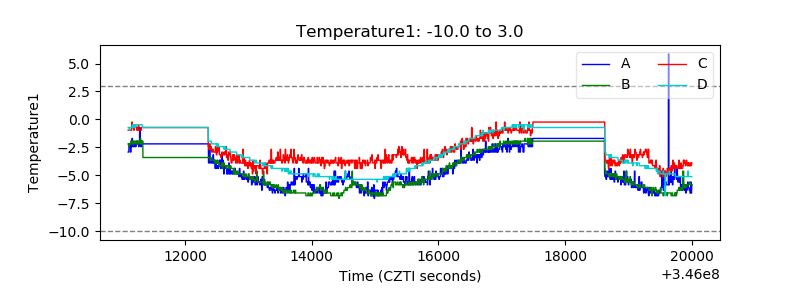 |
| Veto HV Monitor | 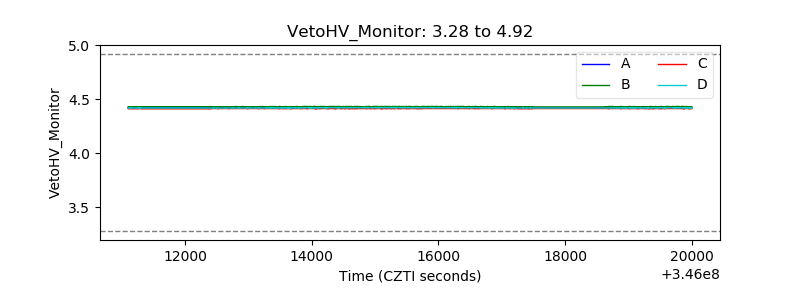 |
| Veto LLD | 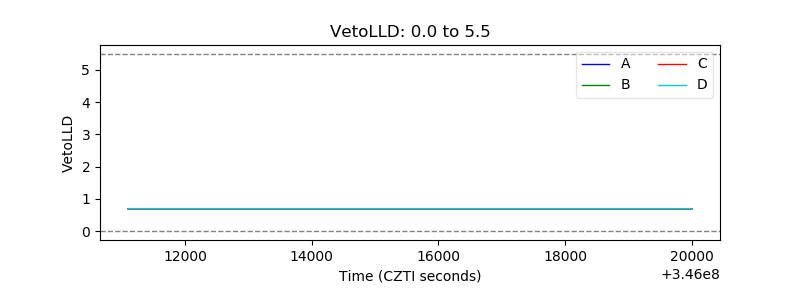 |
| Alpha Counter | 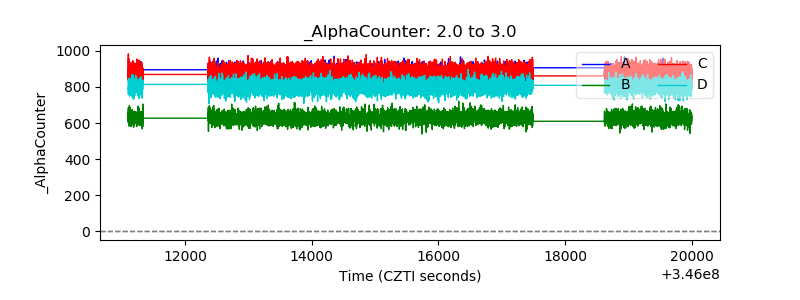 |
| _CPM_Rate | 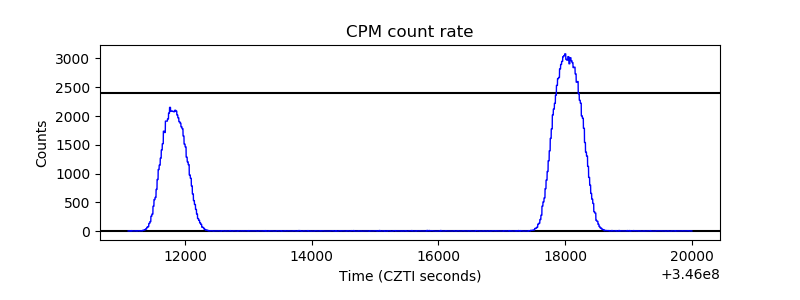 |
| CZT Counter | 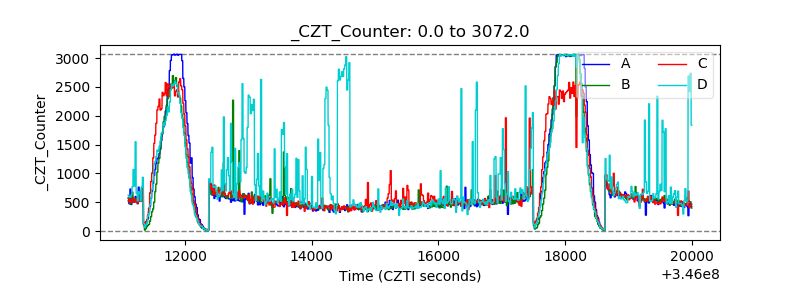 |
| +2.5 Volts monitor | 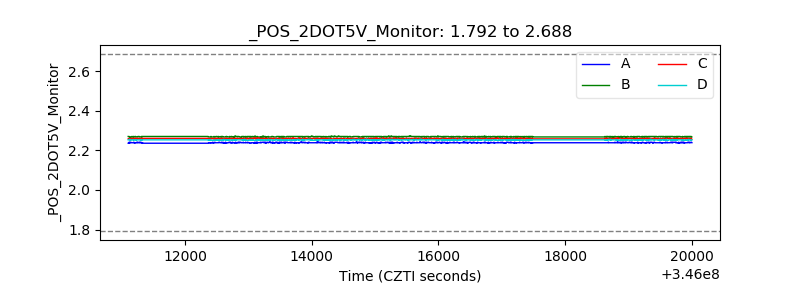 |
| +5 Volts monitor |  |
| _ROLL_ROT | 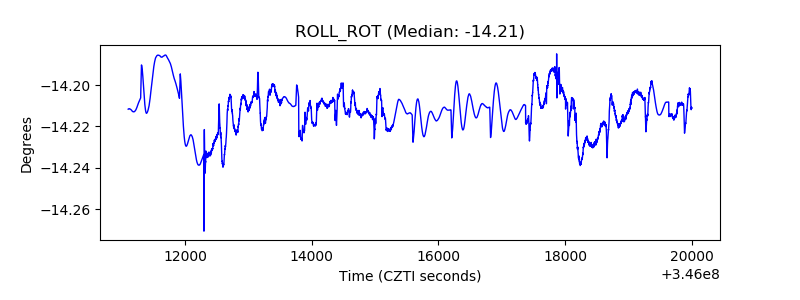 |
| _Roll_DEC | 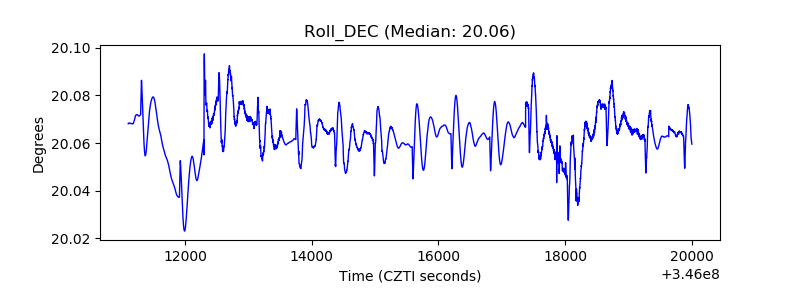 |
| _Roll_RA | 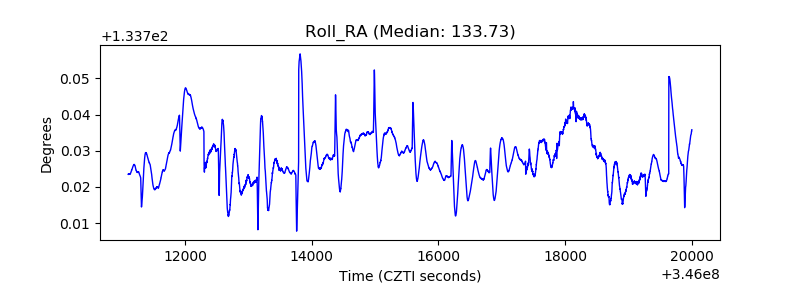 |
| Veto Counter | 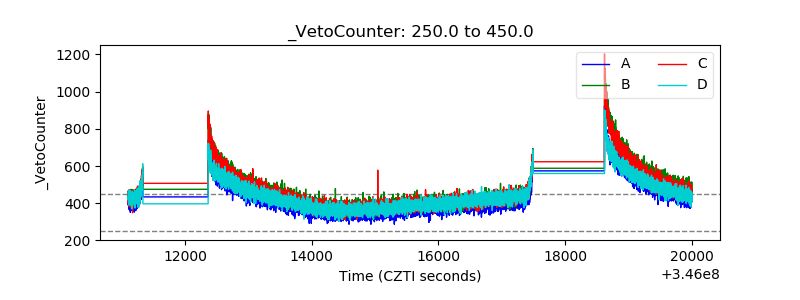 |