| Param | Original file | Final file |
|---|---|---|
| Filename | modeM0/AS1A10_067T01_9000004076_28253cztM0_level2.evt | modeM0/AS1A10_067T01_9000004076_28253cztM0_level2_quad_clean.evt |
| Size (bytes) | 552,337,920 | 115,050,240 |
| Size | 526.8 MB | 109.7 MB |
| Events in quadrant A | 3,499,067 | 774,982 |
| Events in quadrant B | 3,674,806 | 793,049 |
| Events in quadrant C | 3,714,620 | 734,658 |
| Events in quadrant D | 5,370,376 | 700,177 |
| Mode M0 | |||
|---|---|---|---|
| Quadrant | BADHDUFLAG | Total packets | Discarded packets |
| A | 0 | 14770 | 0 |
| B | 0 | 15399 | 0 |
| C | 0 | 15465 | 0 |
| D | 0 | 20874 | 0 |
| Mode M9 | |||
|---|---|---|---|
| Quadrant | BADHDUFLAG | Total packets | Discarded packets |
| A | 0 | 24 | 0 |
| B | 0 | 24 | 0 |
| C | 0 | 24 | 0 |
| D | 0 | 24 | 0 |
| Quadrant | Total seconds | Saturated seconds | Saturation percentage |
|---|---|---|---|
| A | 6913 | 35 | 0.506292% |
| B | 6914 | 67 | 0.969048% |
| C | 6914 | 115 | 1.663292% |
| D | 6914 | 489 | 7.072606% |
Noise dominated data is calculated using 1-second bins in cleaned event files. If a bin has >2000 counts, and if more than 50% of those come from <1% of pixels, then it is considered to be noise-dominated and hence unusable.
| Quadrant | # 1 sec bins | Bins with >0 counts | Bins with >2000 counts | High rate bins dominated by noise | Noise dominated (total time) | Noise dominated (detector-on time) | Marked lightcurve |
|---|---|---|---|---|---|---|---|
| A | 9288 | 6915 | 1 | 1 | 0.01% | 0.01% | 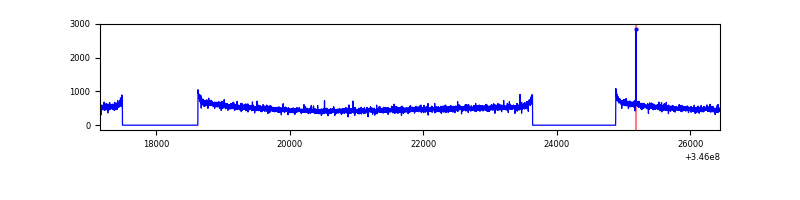 |
| B | 9289 | 6916 | 2 | 2 | 0.02% | 0.03% | 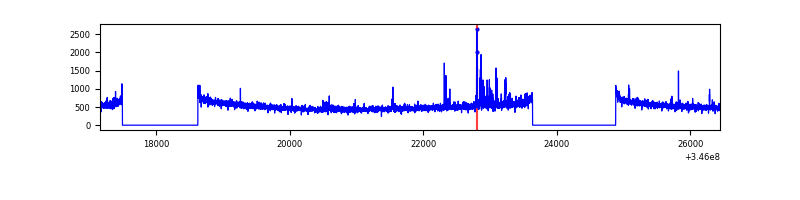 |
| C | 9289 | 6916 | 1 | 1 | 0.01% | 0.01% | 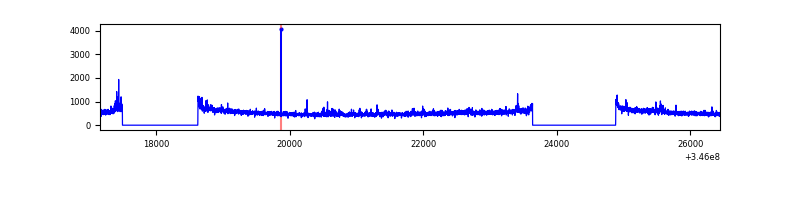 |
| D | 9289 | 6915 | 352 | 352 | 3.79% | 5.09% | 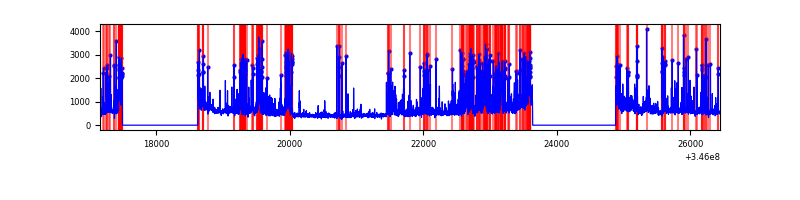 |
Top three noisy pixels from each quadrant. If the there are fewer than three noisy pixels in the level2.evt file, extra rows are filled as -1
| Pixel properties | Quadrant properties | ||||||
|---|---|---|---|---|---|---|---|
| Quadrant | DetID | PixID | Counts | Sigma | Mean | Median | Sigma |
| A | 13 | 254 | 10178 | 51.49 | 905 | 891 | 180.4 |
| A | 3 | 137 | 8317 | 41.17 | 905 | 891 | 180.4 |
| A | 0 | 226 | 7725 | 37.89 | 905 | 891 | 180.4 |
| B | 10 | 245 | 97361 | 572.94 | 904 | 883 | 168.4 |
| B | 12 | 111 | 20629 | 117.26 | 904 | 883 | 168.4 |
| B | 11 | 111 | 18784 | 106.31 | 904 | 883 | 168.4 |
| C | 3 | 233 | 184159 | 917.47 | 862 | 870 | 199.8 |
| C | 14 | 238 | 142247 | 707.68 | 862 | 870 | 199.8 |
| C | 9 | 221 | 15639 | 73.93 | 862 | 870 | 199.8 |
| D | 1 | 52 | 1142342 | 5802.06 | 835 | 813 | 196.7 |
| D | 8 | 195 | 384531 | 1950.33 | 835 | 813 | 196.7 |
| D | 7 | 238 | 309178 | 1567.33 | 835 | 813 | 196.7 |
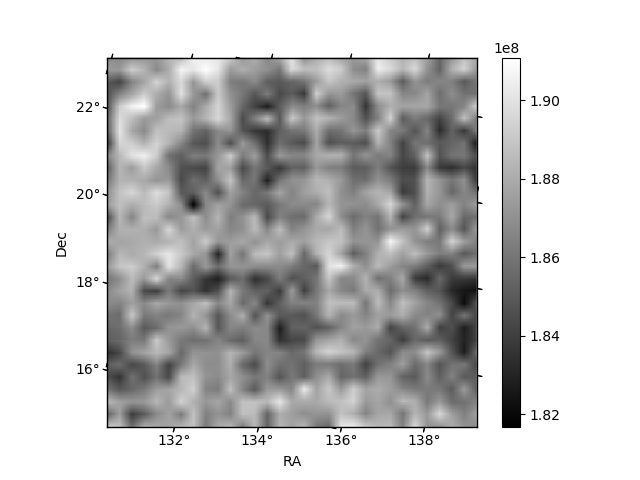
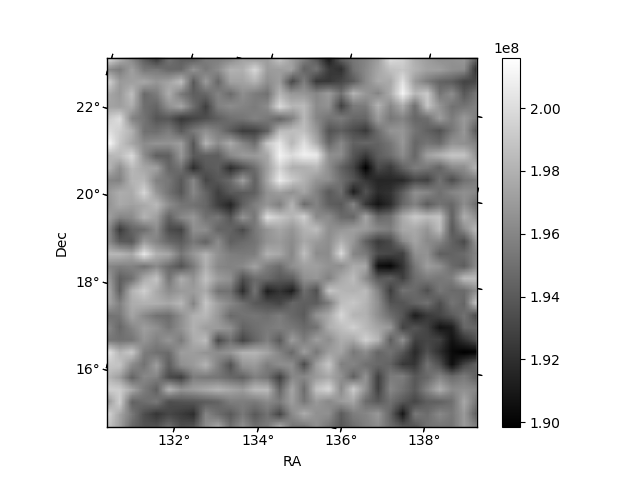
Histogram calculated using DETX and DETY for each event in the final _common_clean file
| Quadrant A |  |
 |
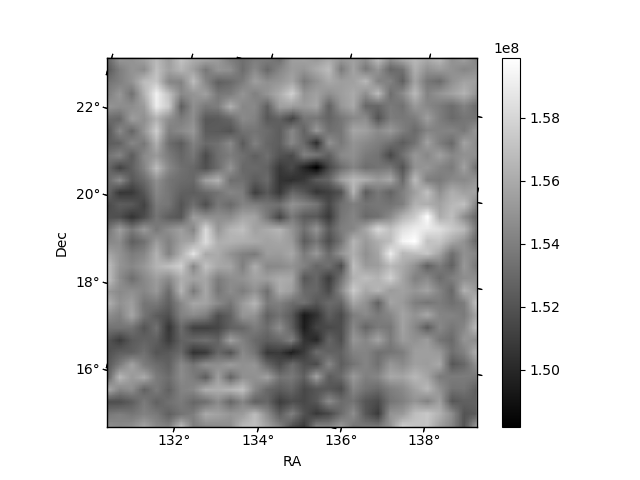
Quadrant B |
|---|---|---|---|
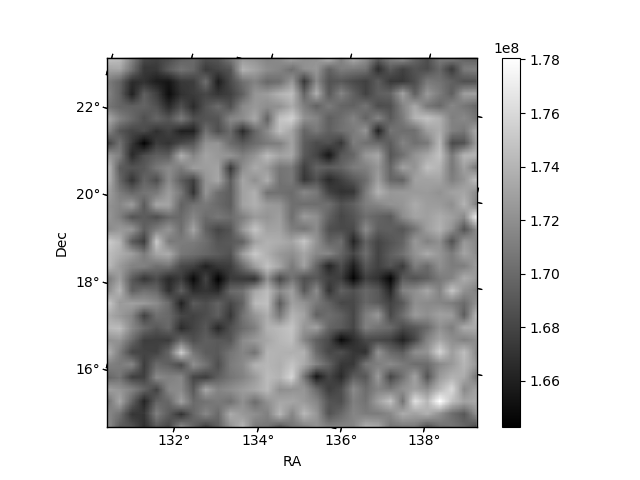
| Quadrant D | 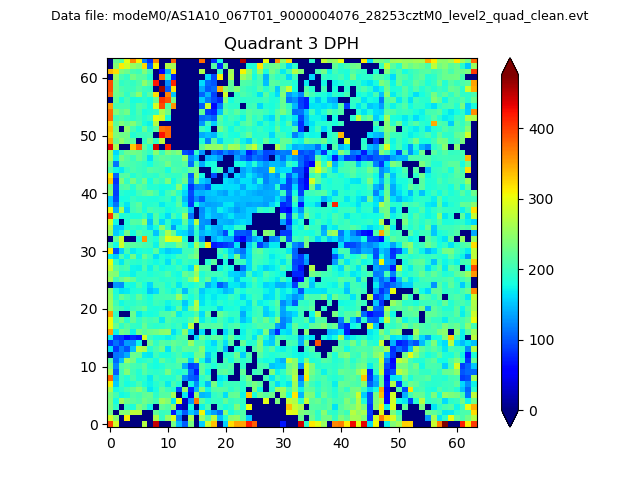 |
 |
Quadrant C |
| Plot type | Count rate plots | Images |
|---|---|---|
| Comparison with Poisson distribution Blue bars denote a histogram of data divided into 1 sec bins. Red curve is a Poisson curve with rate = median count rate of data. |
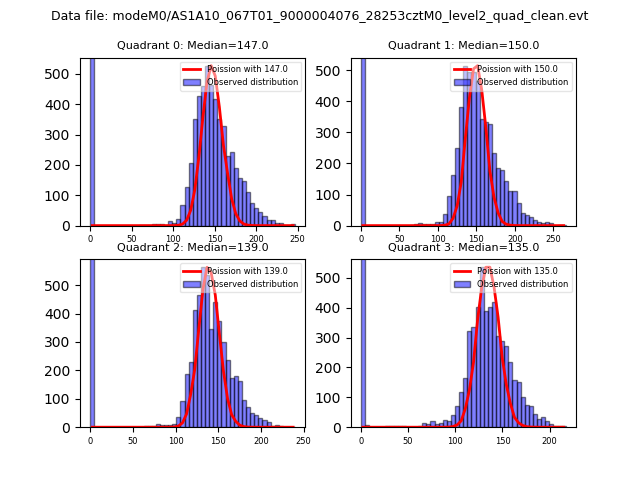 |
 |
| Quadrant-wise count rates Data is divided into 100 sec bins |
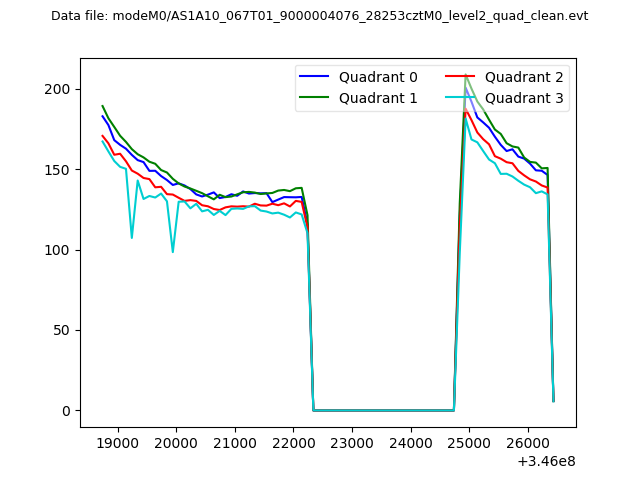 |
|
| Module-wise count rates for Quadrant A Data is divided into 100 sec bins |
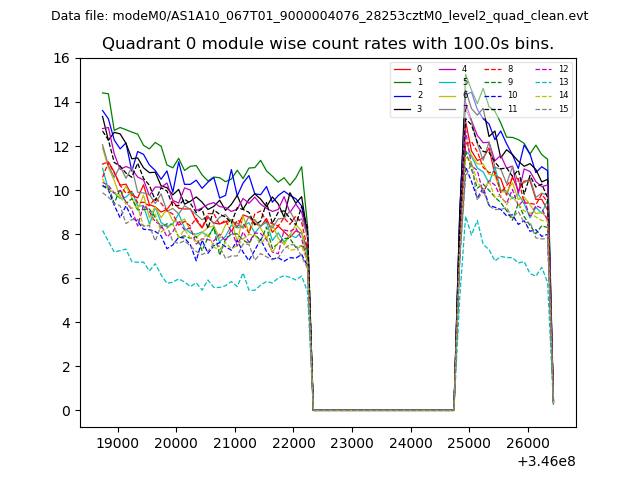 |
 |
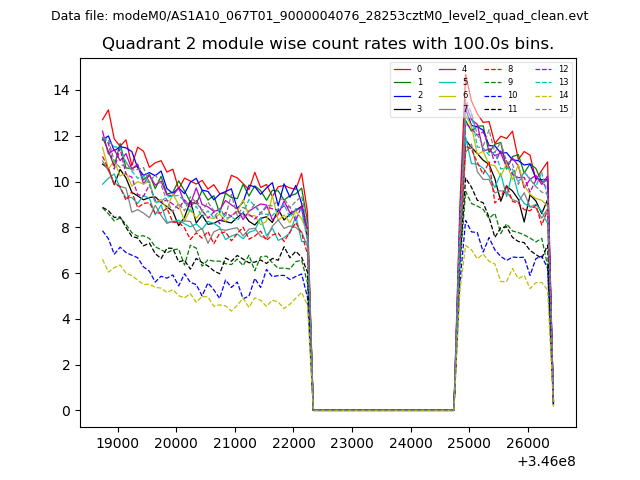
| Module-wise count rates for Quadrant B Data is divided into 100 sec bins |
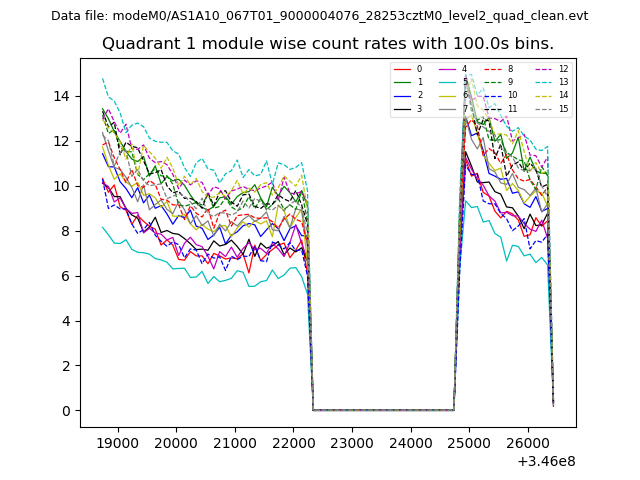 |
 |
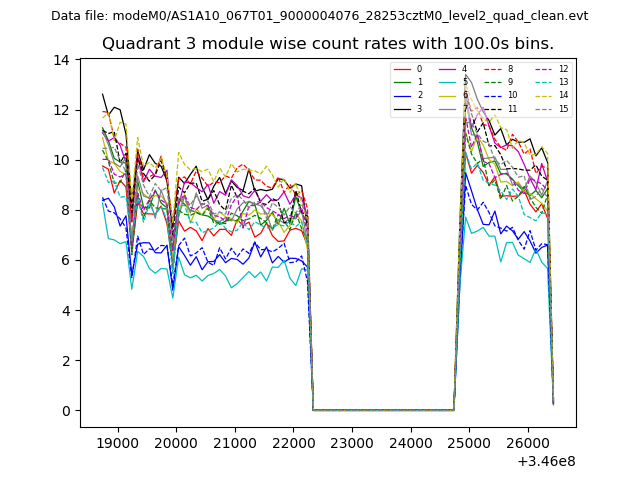
| Module-wise count rates for Quadrant C Data is divided into 100 sec bins |
 |
 |
| Module-wise count rates for Quadrant D Data is divided into 100 sec bins |
 |
 |
| Parameter | Plot |
|---|---|
| CZT HV Monitor | 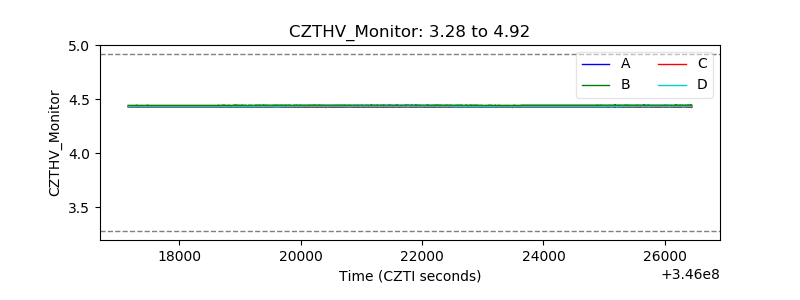 |
| D_VDD | 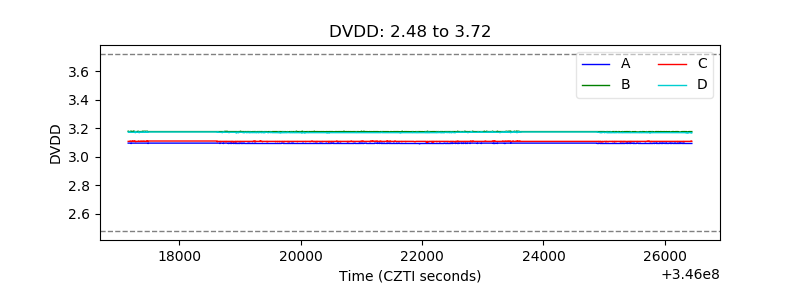 |
| Temperature 1 | 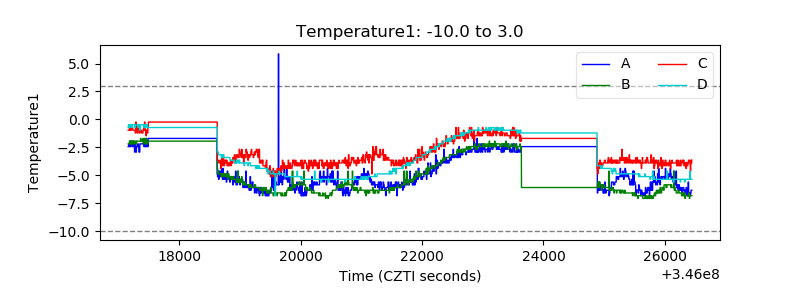 |
| Veto HV Monitor | 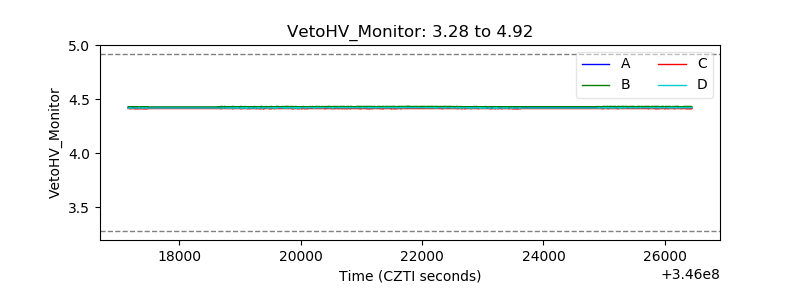 |
| Veto LLD |  |
| Alpha Counter | 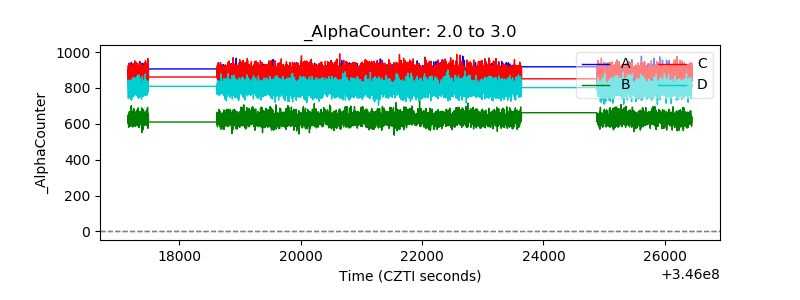 |
| _CPM_Rate | 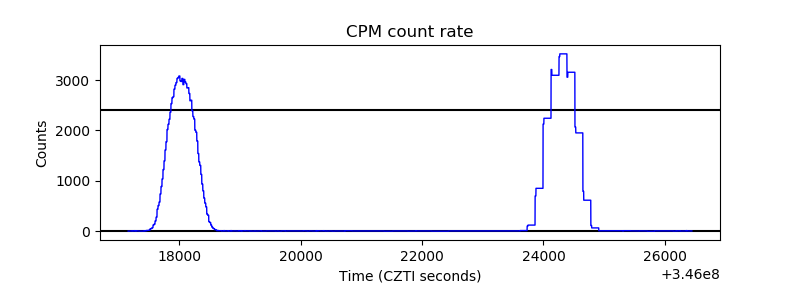 |
| CZT Counter | 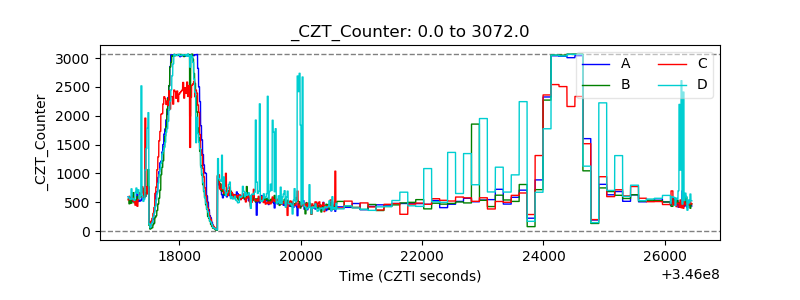 |
| +2.5 Volts monitor |  |
| +5 Volts monitor |  |
| _ROLL_ROT | 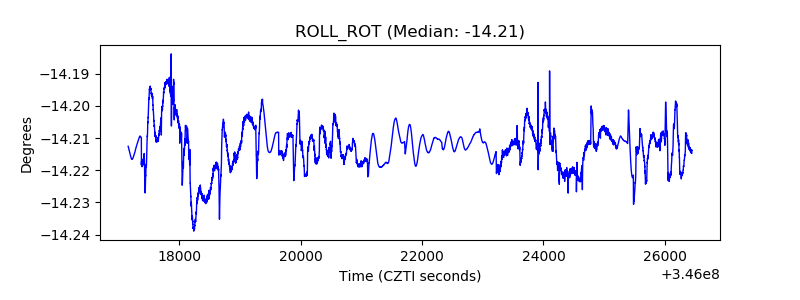 |
| _Roll_DEC | 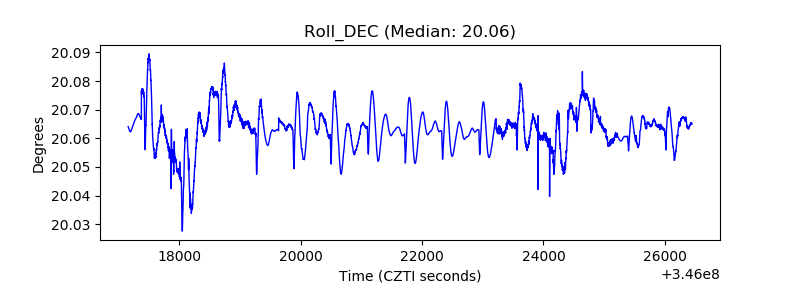 |
| _Roll_RA | 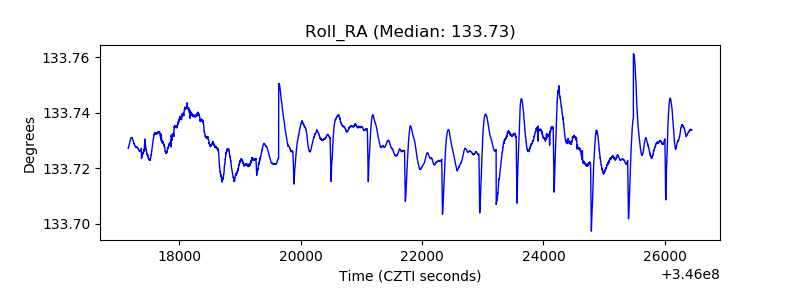 |
| Veto Counter | 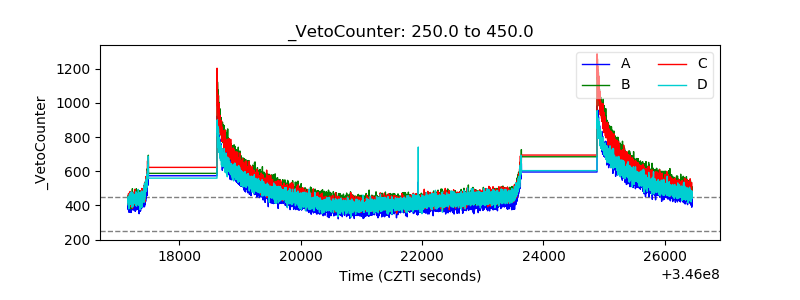 |