| Param | Original file | Final file |
|---|---|---|
| Filename | modeM0/AS1A10_067T01_9000004076_28254cztM0_level2.evt | modeM0/AS1A10_067T01_9000004076_28254cztM0_level2_quad_clean.evt |
| Size (bytes) | 513,990,720 | 107,979,840 |
| Size | 490.2 MB | 103.0 MB |
| Events in quadrant A | 3,237,589 | 735,442 |
| Events in quadrant B | 3,423,103 | 753,914 |
| Events in quadrant C | 3,450,373 | 697,007 |
| Events in quadrant D | 5,025,593 | 641,965 |
| Mode M0 | |||
|---|---|---|---|
| Quadrant | BADHDUFLAG | Total packets | Discarded packets |
| A | 0 | 13447 | 0 |
| B | 0 | 14077 | 0 |
| C | 0 | 14473 | 0 |
| D | 0 | 19171 | 0 |
| Mode M9 | |||
|---|---|---|---|
| Quadrant | BADHDUFLAG | Total packets | Discarded packets |
| A | 0 | 13 | 0 |
| B | 0 | 13 | 0 |
| C | 0 | 13 | 0 |
| D | 0 | 13 | 0 |
| Quadrant | Total seconds | Saturated seconds | Saturation percentage |
|---|---|---|---|
| A | 6335 | 46 | 0.726125% |
| B | 6335 | 70 | 1.104972% |
| C | 6336 | 86 | 1.357323% |
| D | 6335 | 523 | 8.255722% |
Noise dominated data is calculated using 1-second bins in cleaned event files. If a bin has >2000 counts, and if more than 50% of those come from <1% of pixels, then it is considered to be noise-dominated and hence unusable.
| Quadrant | # 1 sec bins | Bins with >0 counts | Bins with >2000 counts | High rate bins dominated by noise | Noise dominated (total time) | Noise dominated (detector-on time) | Marked lightcurve |
|---|---|---|---|---|---|---|---|
| A | 7630 | 6336 | 2 | 2 | 0.03% | 0.03% | 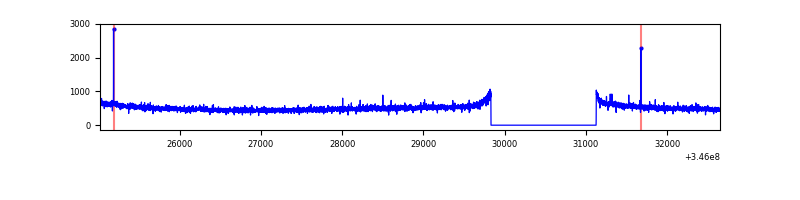 |
| B | 7630 | 6336 | 2 | 2 | 0.03% | 0.03% | 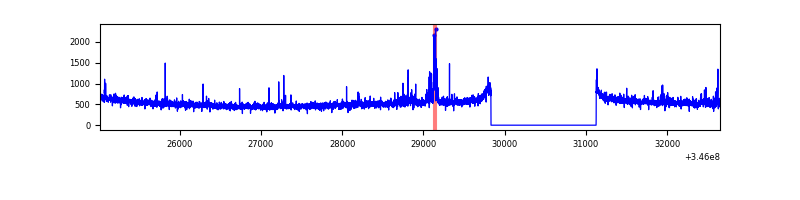 |
| C | 7631 | 6336 | 0 | 0 | 0.00% | 0.00% | 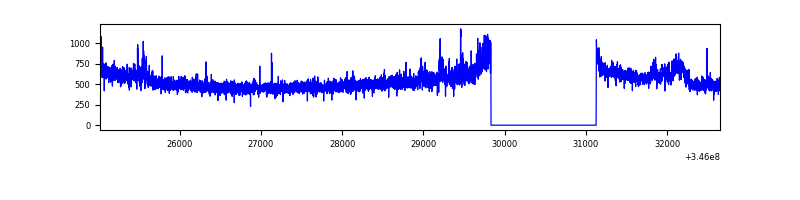 |
| D | 7630 | 6336 | 476 | 476 | 6.24% | 7.51% | 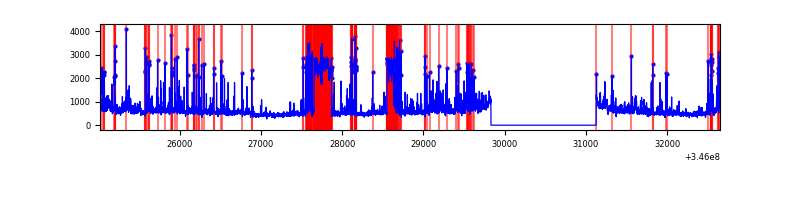 |
Top three noisy pixels from each quadrant. If the there are fewer than three noisy pixels in the level2.evt file, extra rows are filled as -1
| Pixel properties | Quadrant properties | ||||||
|---|---|---|---|---|---|---|---|
| Quadrant | DetID | PixID | Counts | Sigma | Mean | Median | Sigma |
| A | 13 | 254 | 9926 | 54.67 | 837 | 823 | 166.5 |
| A | 3 | 137 | 7479 | 39.97 | 837 | 823 | 166.5 |
| A | 0 | 226 | 7172 | 38.13 | 837 | 823 | 166.5 |
| B | 10 | 245 | 110033 | 700.61 | 836 | 818 | 155.9 |
| B | 12 | 111 | 18881 | 115.87 | 836 | 818 | 155.9 |
| B | 11 | 111 | 17162 | 104.85 | 836 | 818 | 155.9 |
| C | 14 | 238 | 132013 | 710.62 | 798 | 807 | 184.6 |
| C | 3 | 233 | 112299 | 603.85 | 798 | 807 | 184.6 |
| C | 1 | 90 | 86583 | 464.57 | 798 | 807 | 184.6 |
| D | 1 | 52 | 1467567 | 8119.69 | 755 | 734 | 180.7 |
| D | 8 | 195 | 289681 | 1599.47 | 755 | 734 | 180.7 |
| D | 7 | 238 | 238454 | 1315.9 | 755 | 734 | 180.7 |
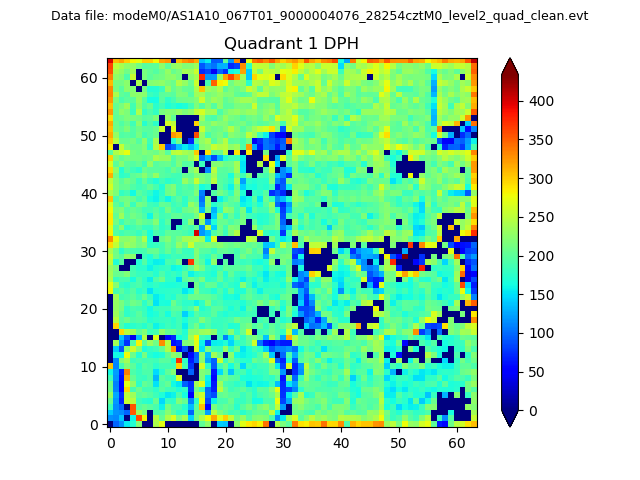
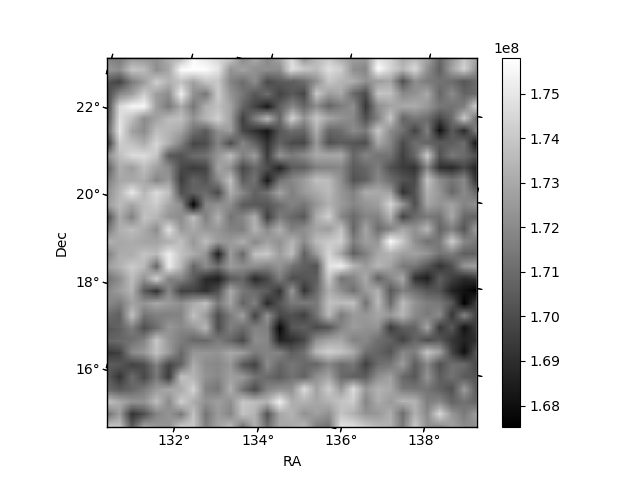
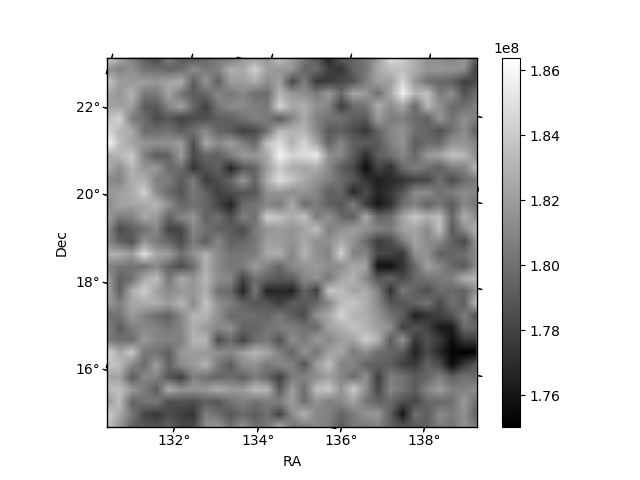
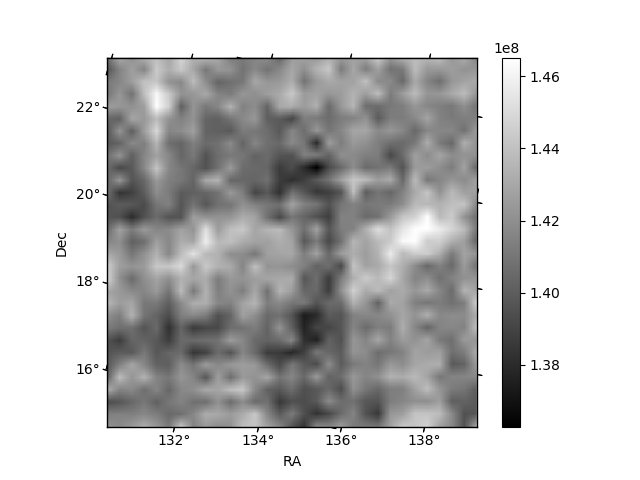
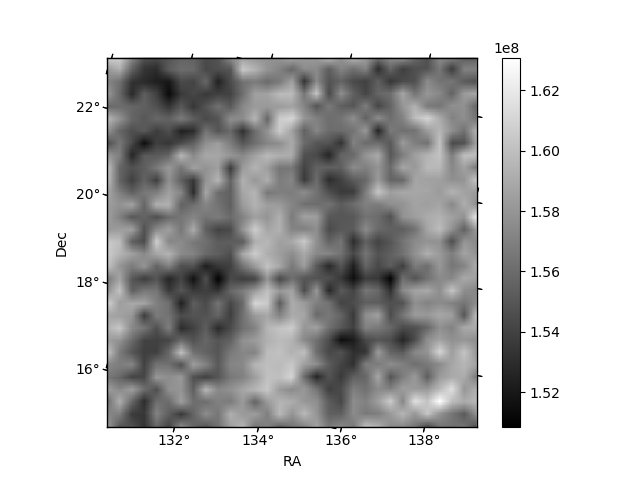
Histogram calculated using DETX and DETY for each event in the final _common_clean file
| Quadrant A |  |
 |
Quadrant B |
|---|---|---|---|
| Quadrant D | 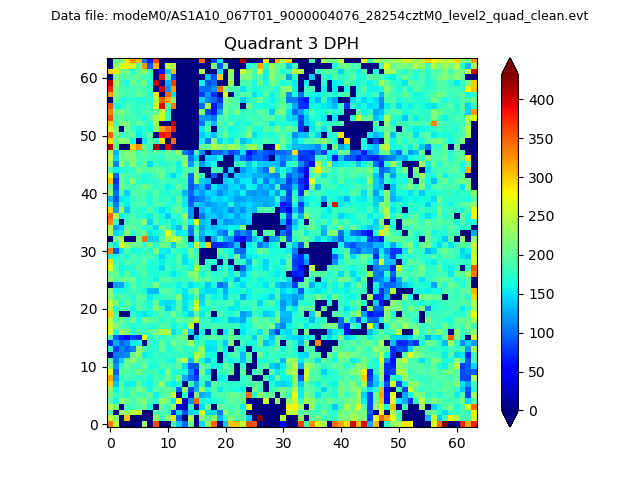 |
 |
Quadrant C |
| Plot type | Count rate plots | Images |
|---|---|---|
| Comparison with Poisson distribution Blue bars denote a histogram of data divided into 1 sec bins. Red curve is a Poisson curve with rate = median count rate of data. |
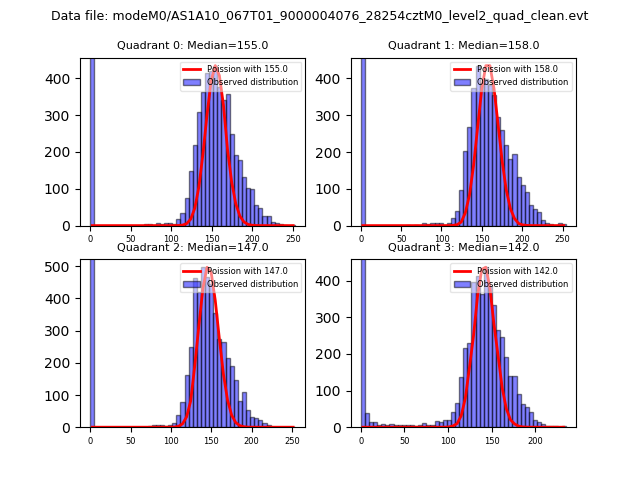 |
 |
| Quadrant-wise count rates Data is divided into 100 sec bins |
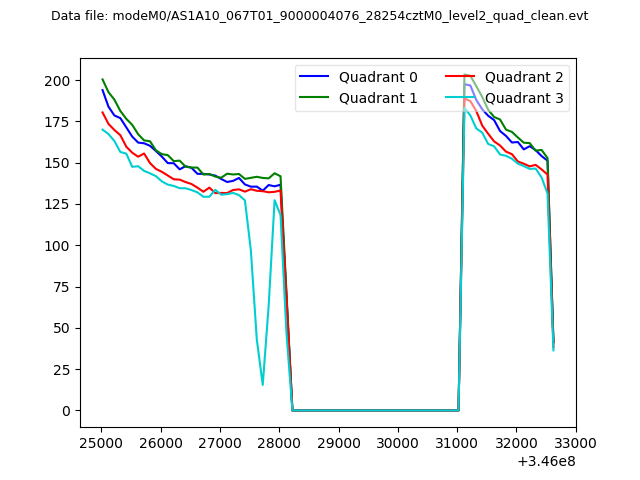 |
|
| Module-wise count rates for Quadrant A Data is divided into 100 sec bins |
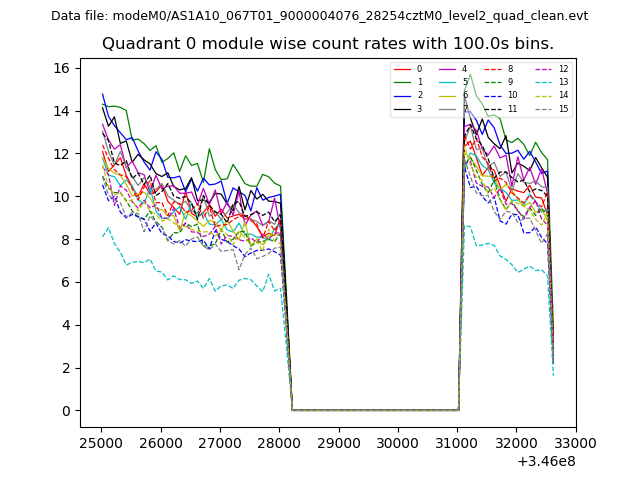 |
 |
| Module-wise count rates for Quadrant B Data is divided into 100 sec bins |
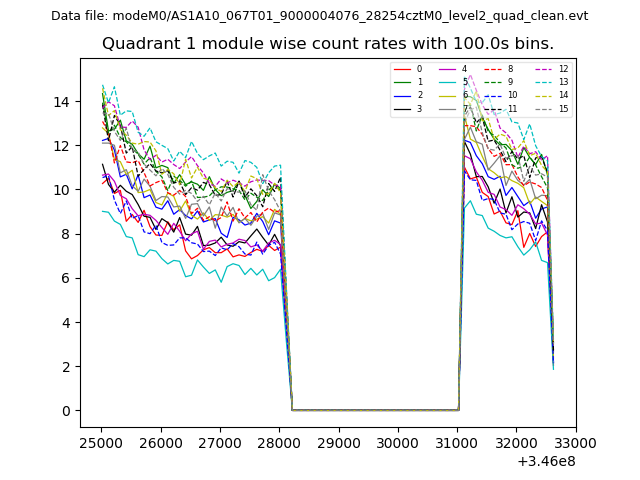 |
 |
| Module-wise count rates for Quadrant C Data is divided into 100 sec bins |
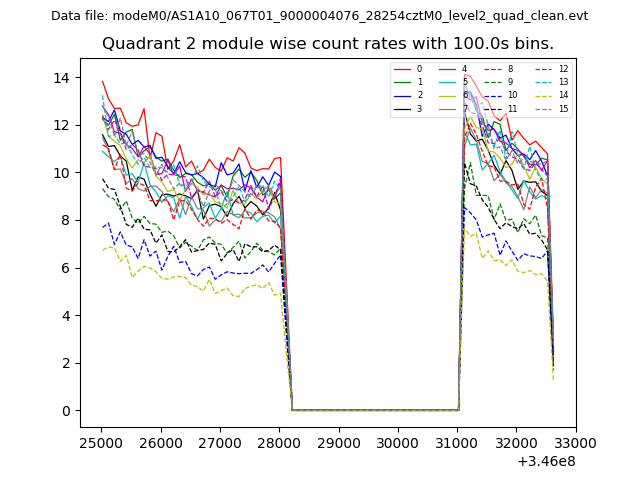 |
 |
| Module-wise count rates for Quadrant D Data is divided into 100 sec bins |
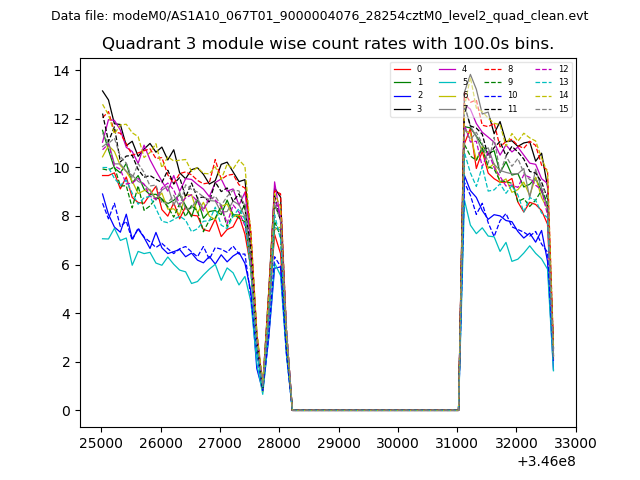 |
 |
| Parameter | Plot |
|---|---|
| CZT HV Monitor | 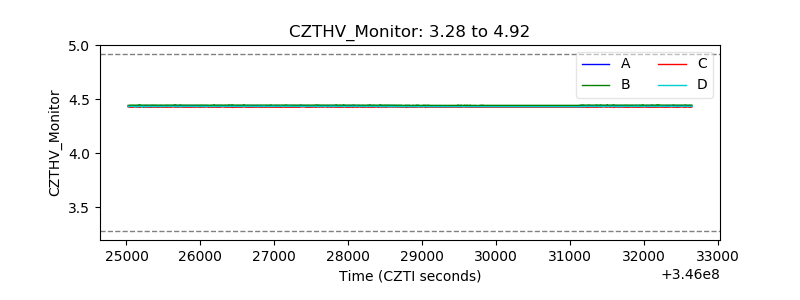 |
| D_VDD | 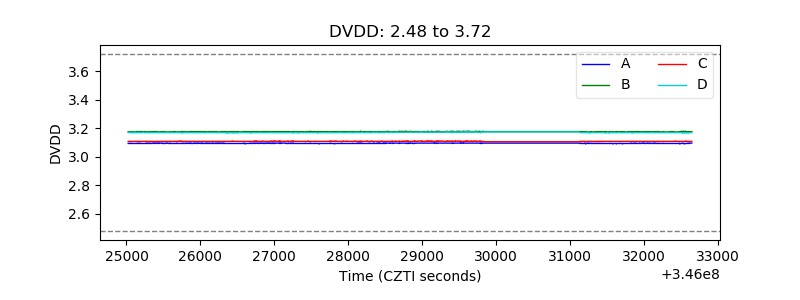 |
| Temperature 1 | 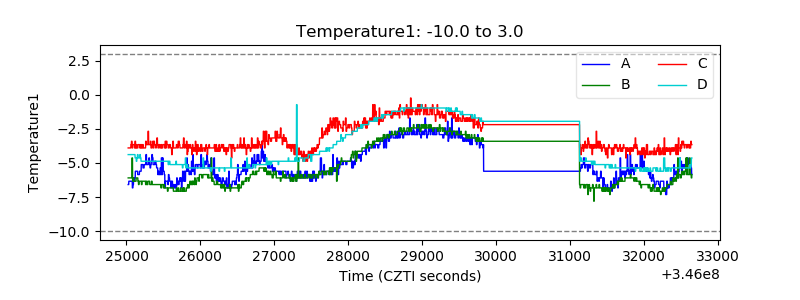 |
| Veto HV Monitor | 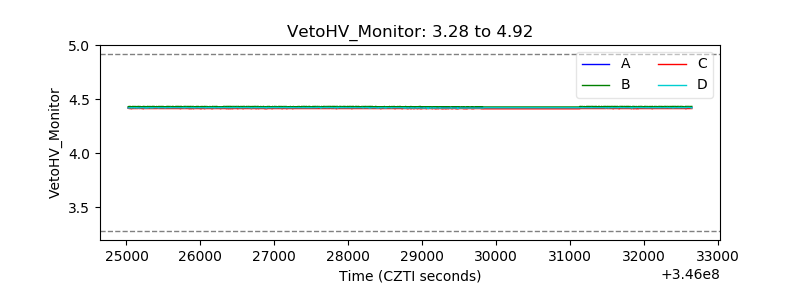 |
| Veto LLD | 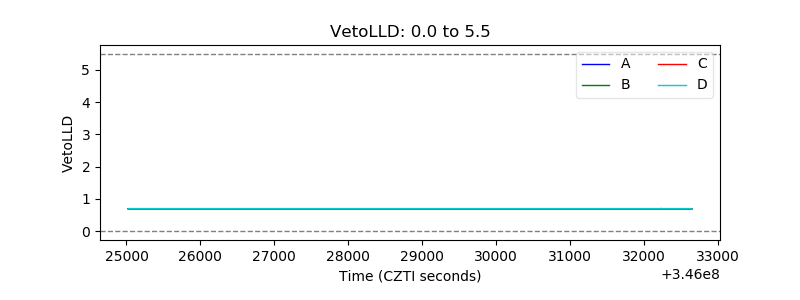 |
| Alpha Counter | 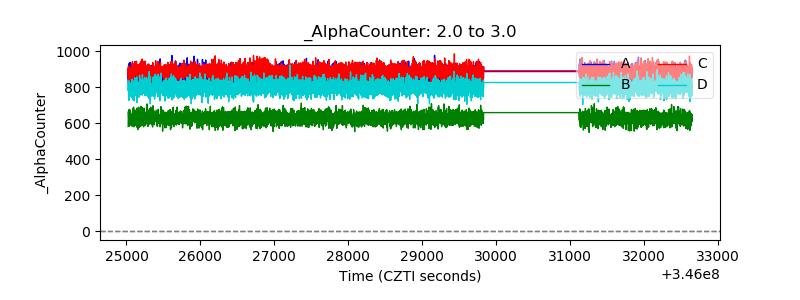 |
| _CPM_Rate | 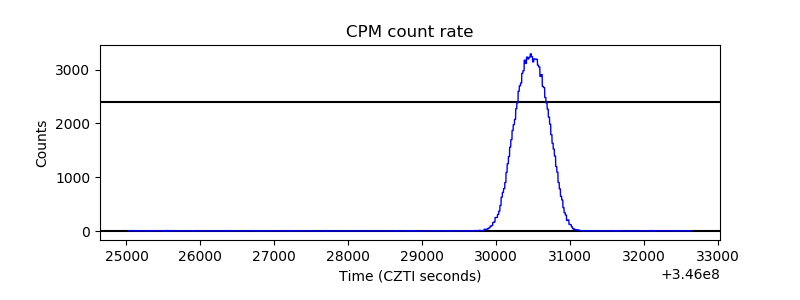 |
| CZT Counter |  |
| +2.5 Volts monitor |  |
| +5 Volts monitor |  |
| _ROLL_ROT | 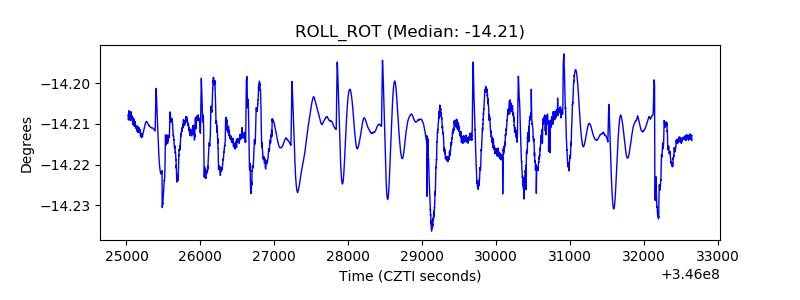 |
| _Roll_DEC | 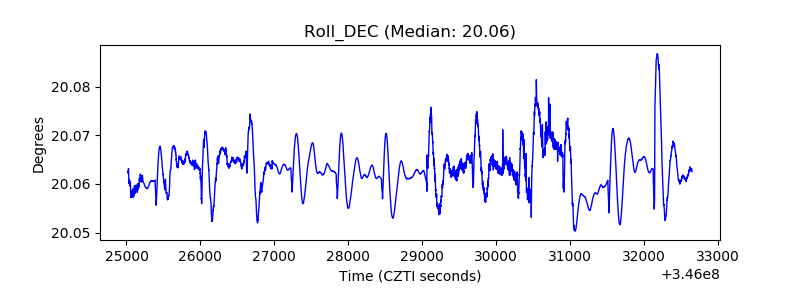 |
| _Roll_RA | 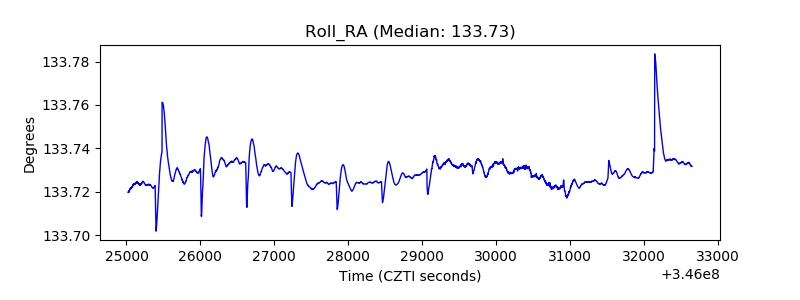 |
| Veto Counter | 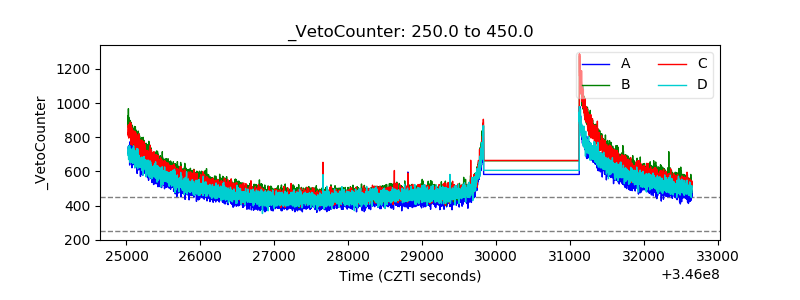 |