| Param | Original file | Final file |
|---|---|---|
| Filename | modeM0/AS1A10_067T01_9000004076_28256cztM0_level2.evt | modeM0/AS1A10_067T01_9000004076_28256cztM0_level2_quad_clean.evt |
| Size (bytes) | 539,326,080 | 92,278,080 |
| Size | 514.3 MB | 88.0 MB |
| Events in quadrant A | 3,198,070 | 616,350 |
| Events in quadrant B | 3,986,117 | 619,161 |
| Events in quadrant C | 3,695,907 | 582,813 |
| Events in quadrant D | 5,025,245 | 535,059 |
| Mode M0 | |||
|---|---|---|---|
| Quadrant | BADHDUFLAG | Total packets | Discarded packets |
| A | 0 | 13175 | 0 |
| B | 0 | 15851 | 0 |
| C | 0 | 14974 | 0 |
| D | 0 | 18968 | 0 |
| Mode M9 | |||
|---|---|---|---|
| Quadrant | BADHDUFLAG | Total packets | Discarded packets |
| A | 0 | 13 | 0 |
| B | 0 | 13 | 0 |
| C | 0 | 13 | 0 |
| D | 0 | 13 | 0 |
| Quadrant | Total seconds | Saturated seconds | Saturation percentage |
|---|---|---|---|
| A | 6321 | 48 | 0.759374% |
| B | 6321 | 107 | 1.692770% |
| C | 6320 | 108 | 1.708861% |
| D | 6321 | 545 | 8.622053% |
Noise dominated data is calculated using 1-second bins in cleaned event files. If a bin has >2000 counts, and if more than 50% of those come from <1% of pixels, then it is considered to be noise-dominated and hence unusable.
| Quadrant | # 1 sec bins | Bins with >0 counts | Bins with >2000 counts | High rate bins dominated by noise | Noise dominated (total time) | Noise dominated (detector-on time) | Marked lightcurve |
|---|---|---|---|---|---|---|---|
| A | 7576 | 6322 | 0 | 0 | 0.00% | 0.00% | 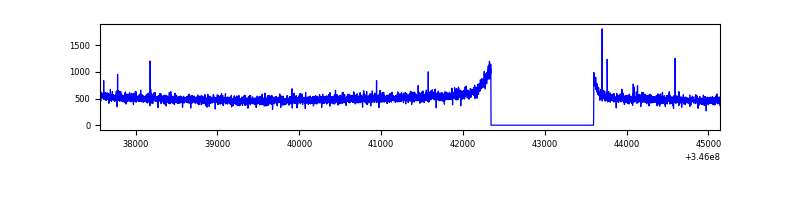 |
| B | 7576 | 6322 | 37 | 37 | 0.49% | 0.59% | 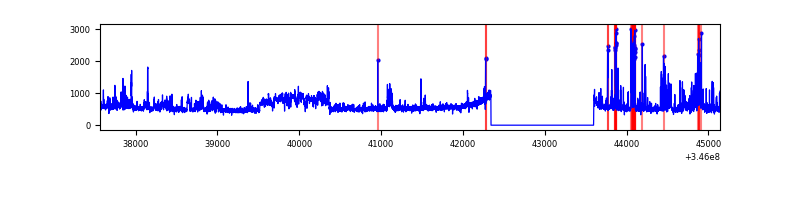 |
| C | 7575 | 6321 | 4 | 4 | 0.05% | 0.06% | 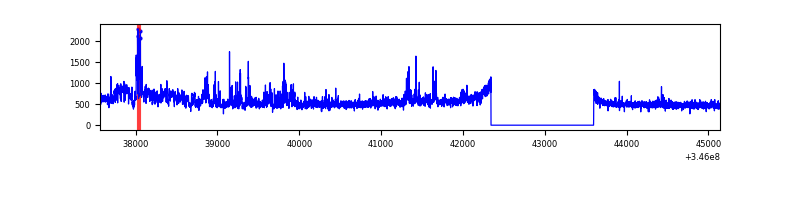 |
| D | 7576 | 6322 | 486 | 486 | 6.41% | 7.69% | 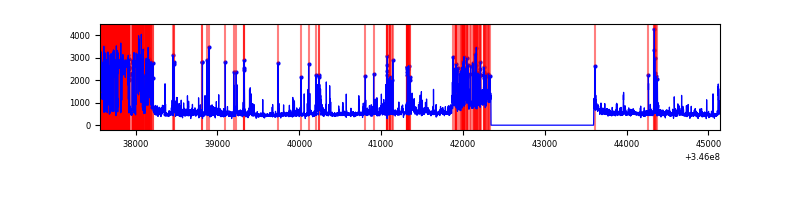 |
Top three noisy pixels from each quadrant. If the there are fewer than three noisy pixels in the level2.evt file, extra rows are filled as -1
| Pixel properties | Quadrant properties | ||||||
|---|---|---|---|---|---|---|---|
| Quadrant | DetID | PixID | Counts | Sigma | Mean | Median | Sigma |
| A | 12 | 96 | 10601 | 59.73 | 826 | 812 | 163.9 |
| A | 13 | 254 | 9955 | 55.79 | 826 | 812 | 163.9 |
| A | 3 | 137 | 7798 | 42.63 | 826 | 812 | 163.9 |
| B | 10 | 245 | 779750 | 5075.32 | 812 | 792 | 153.5 |
| B | 12 | 111 | 18358 | 114.45 | 812 | 792 | 153.5 |
| B | 0 | 230 | 17191 | 106.85 | 812 | 792 | 153.5 |
| C | 3 | 233 | 306085 | 1672.16 | 782 | 787 | 182.6 |
| C | 1 | 90 | 211640 | 1154.87 | 782 | 787 | 182.6 |
| C | 14 | 238 | 128267 | 698.23 | 782 | 787 | 182.6 |
| D | 1 | 52 | 1629425 | 9105.99 | 758 | 738 | 178.9 |
| D | 8 | 195 | 287834 | 1605.15 | 758 | 738 | 178.9 |
| D | 5 | 222 | 183389 | 1021.2 | 758 | 738 | 178.9 |
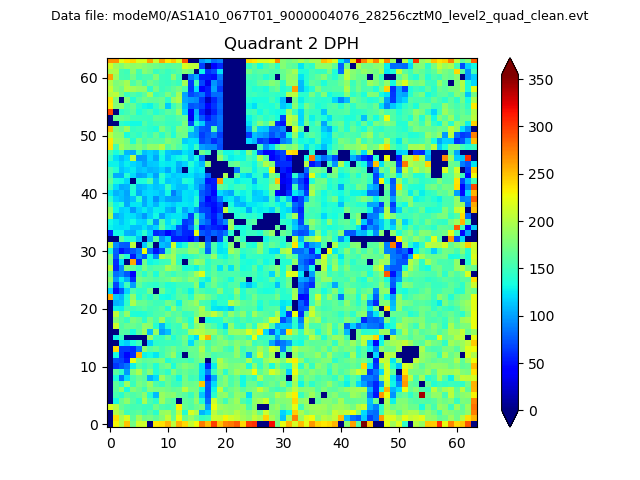
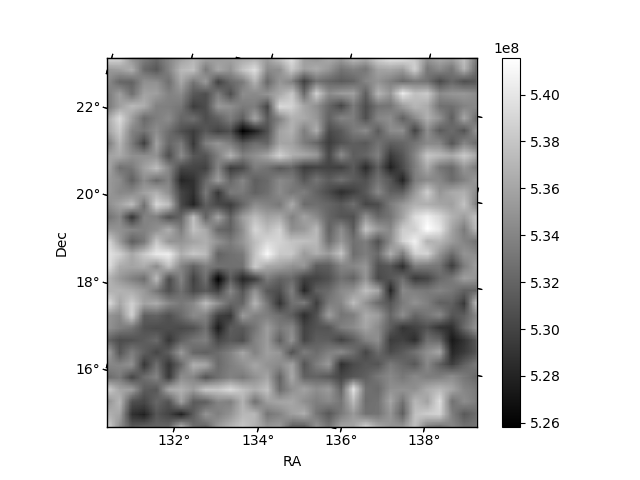
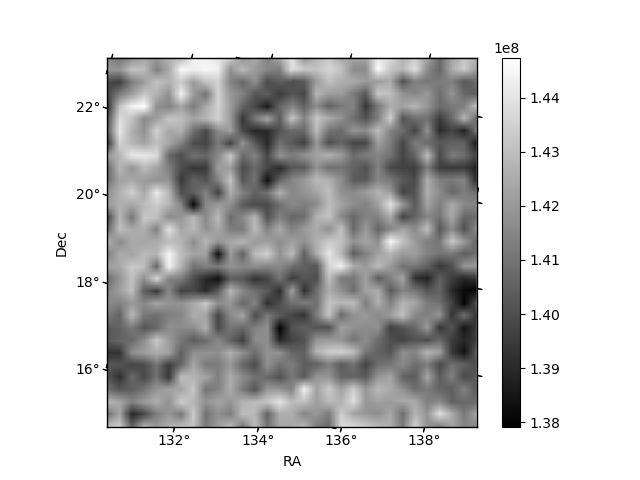
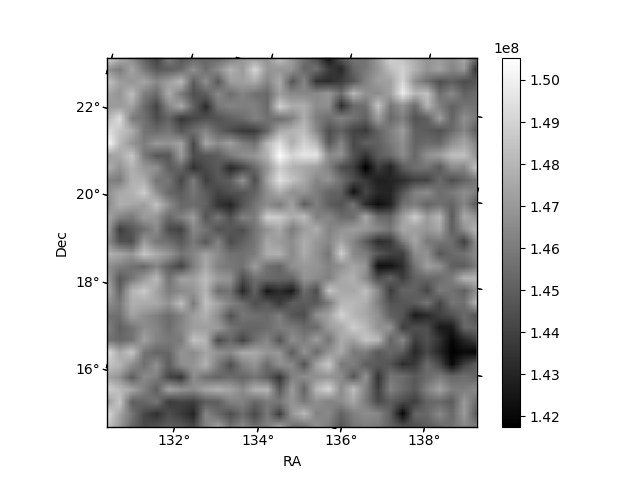
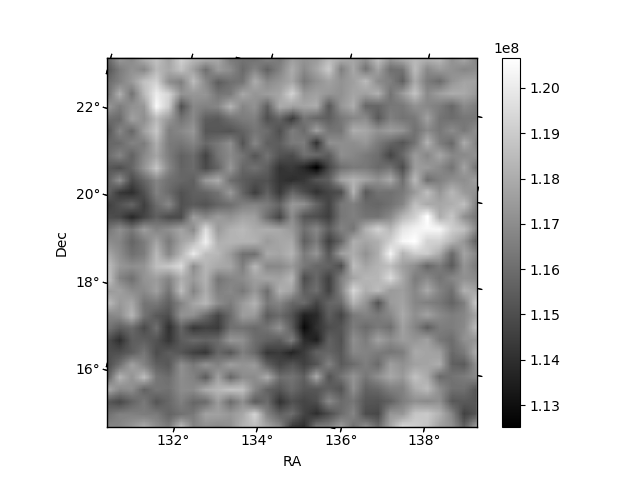
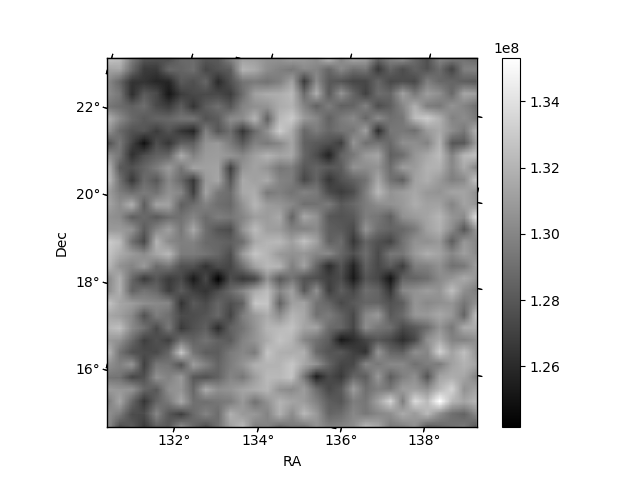
Histogram calculated using DETX and DETY for each event in the final _common_clean file
| Quadrant A | 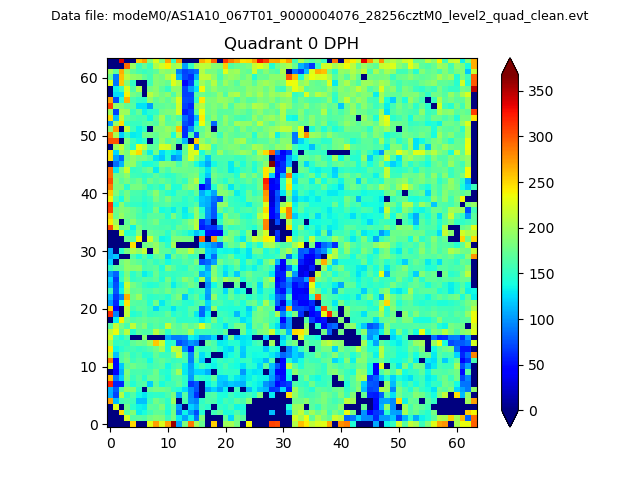 |
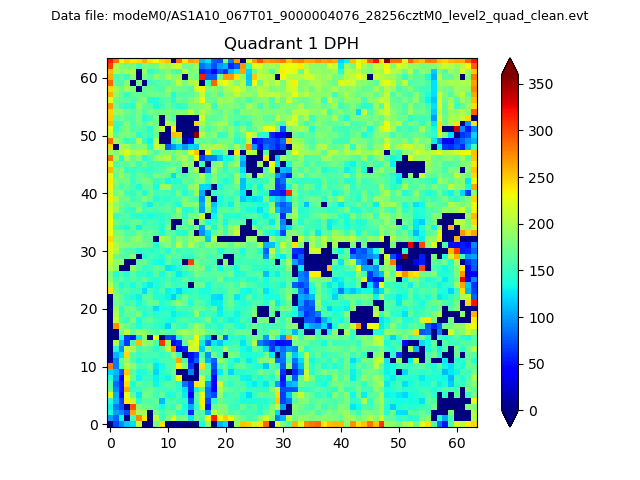 |
Quadrant B |
|---|---|---|---|
| Quadrant D | 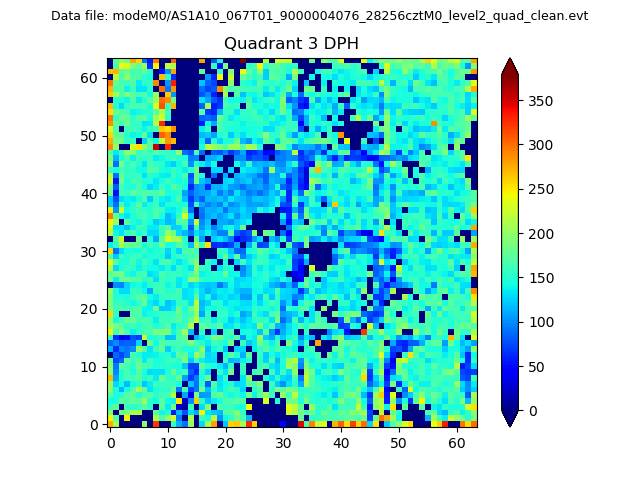 |
 |
Quadrant C |
| Plot type | Count rate plots | Images |
|---|---|---|
| Comparison with Poisson distribution Blue bars denote a histogram of data divided into 1 sec bins. Red curve is a Poisson curve with rate = median count rate of data. |
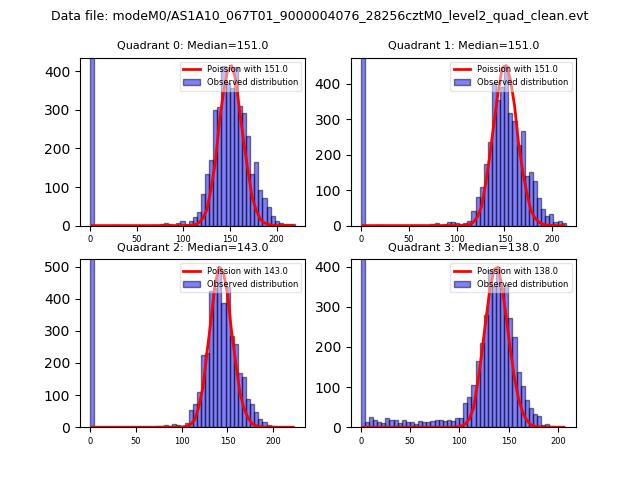 |
 |
| Quadrant-wise count rates Data is divided into 100 sec bins |
 |
|
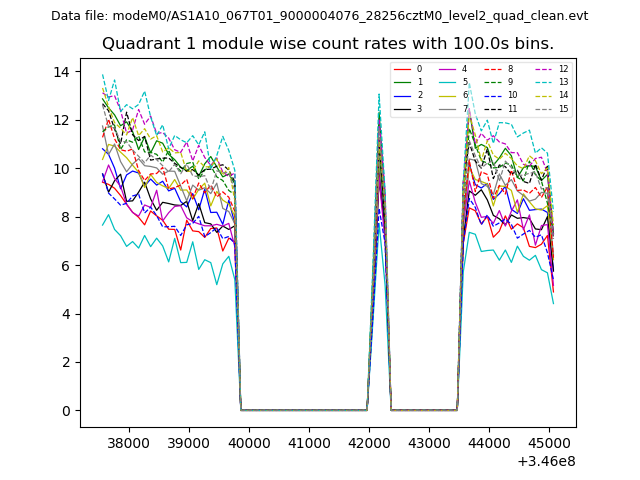
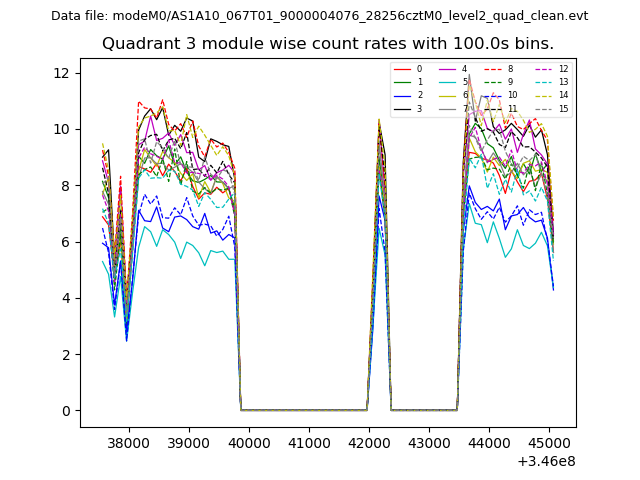
| Module-wise count rates for Quadrant A Data is divided into 100 sec bins |
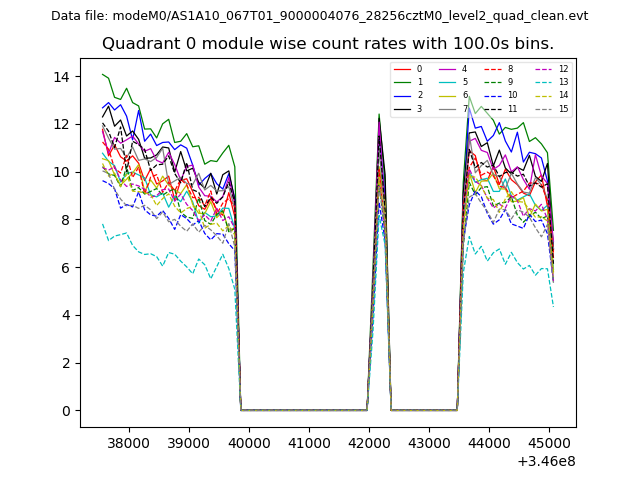 |
 |
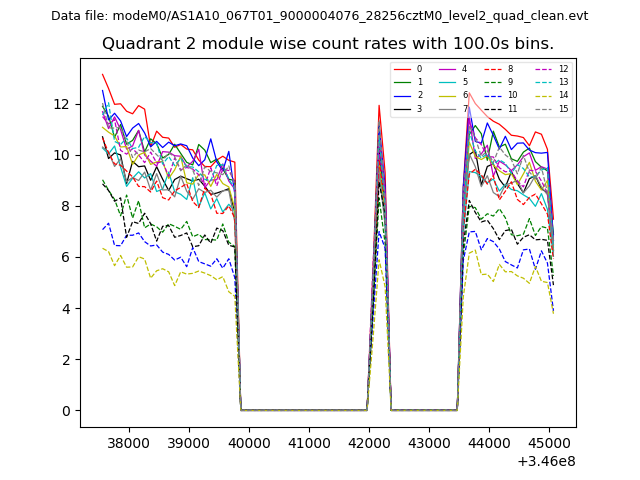
| Module-wise count rates for Quadrant B Data is divided into 100 sec bins |
 |
 |
| Module-wise count rates for Quadrant C Data is divided into 100 sec bins |
 |
 |
| Module-wise count rates for Quadrant D Data is divided into 100 sec bins |
 |
 |
| Parameter | Plot |
|---|---|
| CZT HV Monitor | 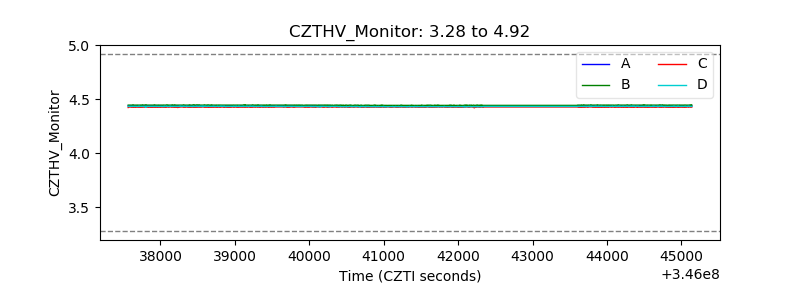 |
| D_VDD | 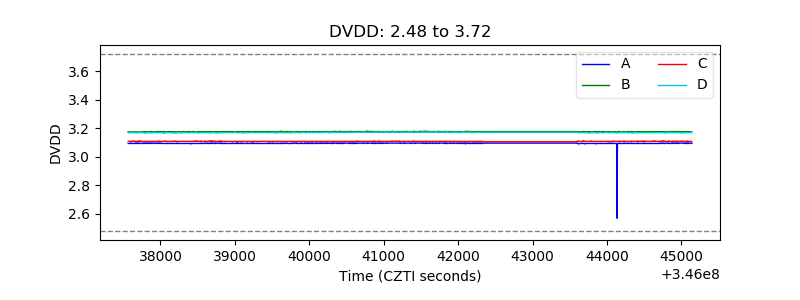 |
| Temperature 1 | 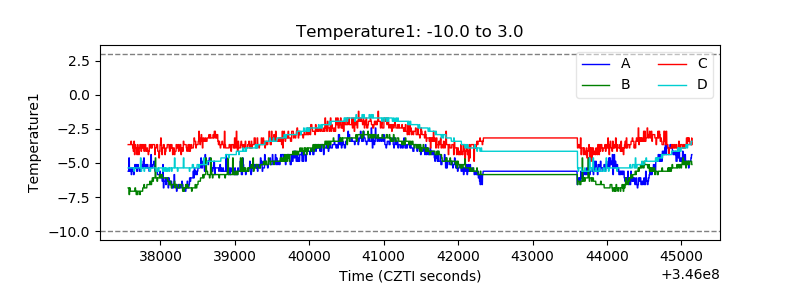 |
| Veto HV Monitor |  |
| Veto LLD |  |
| Alpha Counter | 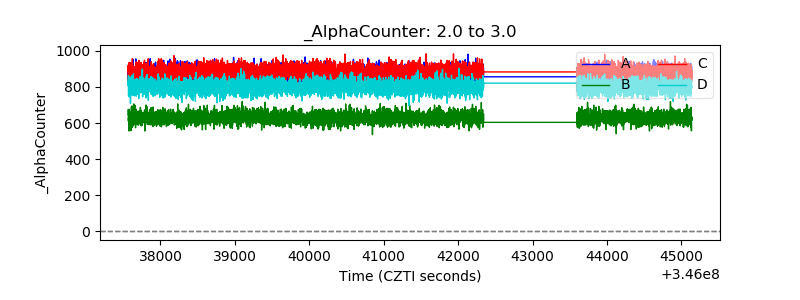 |
| _CPM_Rate | 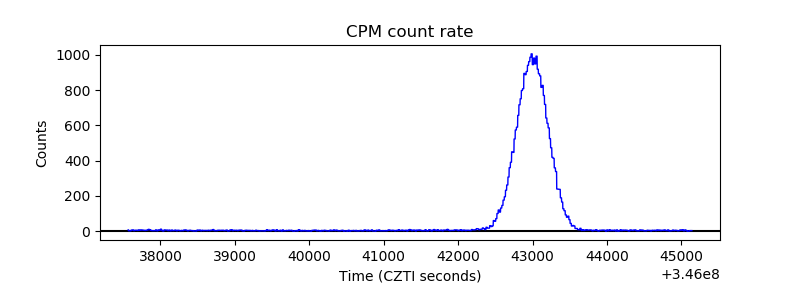 |
| CZT Counter | 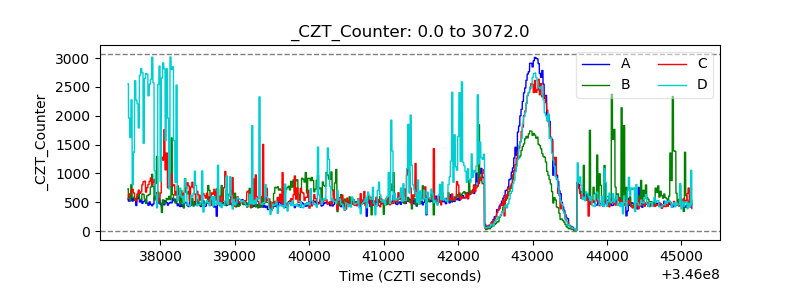 |
| +2.5 Volts monitor |  |
| +5 Volts monitor |  |
| _ROLL_ROT | 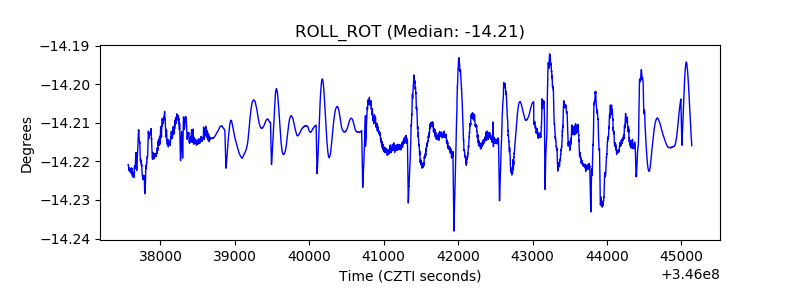 |
| _Roll_DEC | 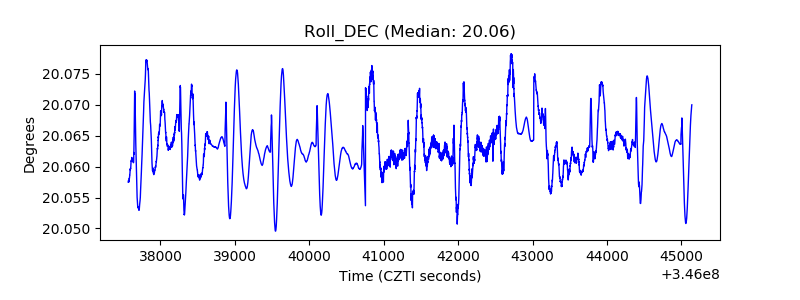 |
| _Roll_RA |  |
| Veto Counter | 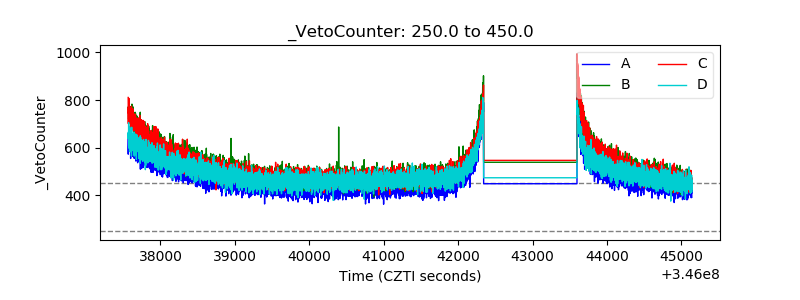 |