| Param | Original file | Final file |
|---|---|---|
| Filename | modeM0/AS1A10_067T01_9000004076_28257cztM0_level2.evt | modeM0/AS1A10_067T01_9000004076_28257cztM0_level2_quad_clean.evt |
| Size (bytes) | 545,875,200 | 95,587,200 |
| Size | 520.6 MB | 91.2 MB |
| Events in quadrant A | 3,311,922 | 629,284 |
| Events in quadrant B | 4,344,677 | 628,907 |
| Events in quadrant C | 3,417,666 | 602,209 |
| Events in quadrant D | 5,006,694 | 570,564 |
| Mode M0 | |||
|---|---|---|---|
| Quadrant | BADHDUFLAG | Total packets | Discarded packets |
| A | 0 | 13790 | 0 |
| B | 0 | 17045 | 0 |
| C | 0 | 14141 | 0 |
| D | 0 | 19399 | 0 |
| Mode M9 | |||
|---|---|---|---|
| Quadrant | BADHDUFLAG | Total packets | Discarded packets |
| A | 0 | 14 | 0 |
| B | 0 | 15 | 0 |
| C | 0 | 15 | 0 |
| D | 0 | 15 | 0 |
| Quadrant | Total seconds | Saturated seconds | Saturation percentage |
|---|---|---|---|
| A | 6653 | 77 | 1.157373% |
| B | 6653 | 296 | 4.449121% |
| C | 6653 | 130 | 1.954006% |
| D | 6653 | 368 | 5.531339% |
Noise dominated data is calculated using 1-second bins in cleaned event files. If a bin has >2000 counts, and if more than 50% of those come from <1% of pixels, then it is considered to be noise-dominated and hence unusable.
| Quadrant | # 1 sec bins | Bins with >0 counts | Bins with >2000 counts | High rate bins dominated by noise | Noise dominated (total time) | Noise dominated (detector-on time) | Marked lightcurve |
|---|---|---|---|---|---|---|---|
| A | 7658 | 6654 | 0 | 0 | 0.00% | 0.00% |  |
| B | 7658 | 6653 | 174 | 174 | 2.27% | 2.62% | 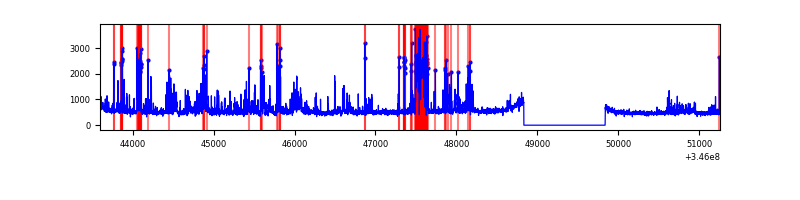 |
| C | 7658 | 6654 | 4 | 4 | 0.05% | 0.06% | 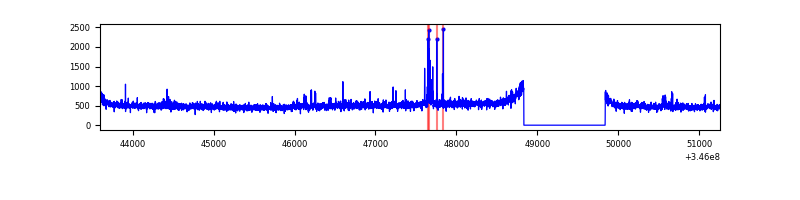 |
| D | 7658 | 6653 | 252 | 252 | 3.29% | 3.79% | 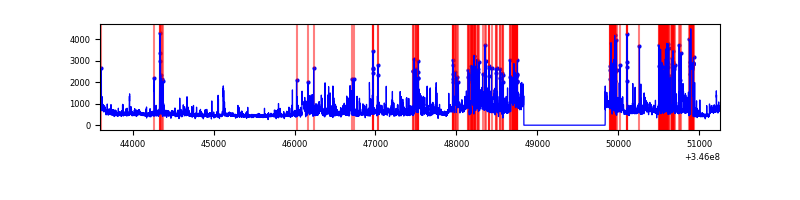 |
Top three noisy pixels from each quadrant. If the there are fewer than three noisy pixels in the level2.evt file, extra rows are filled as -1
| Pixel properties | Quadrant properties | ||||||
|---|---|---|---|---|---|---|---|
| Quadrant | DetID | PixID | Counts | Sigma | Mean | Median | Sigma |
| A | 8 | 34 | 18547 | 103.65 | 852 | 837 | 170.9 |
| A | 13 | 254 | 10466 | 56.35 | 852 | 837 | 170.9 |
| A | 3 | 137 | 8220 | 43.21 | 852 | 837 | 170.9 |
| B | 10 | 245 | 1074920 | 6810.62 | 824 | 803 | 157.7 |
| B | 12 | 111 | 19300 | 117.28 | 824 | 803 | 157.7 |
| B | 0 | 230 | 18843 | 114.39 | 824 | 803 | 157.7 |
| C | 14 | 238 | 132019 | 690.63 | 809 | 815 | 190.0 |
| C | 3 | 233 | 127658 | 667.68 | 809 | 815 | 190.0 |
| C | 13 | 61 | 5531 | 24.82 | 809 | 815 | 190.0 |
| D | 1 | 52 | 1327987 | 6953.49 | 801 | 781 | 190.9 |
| D | 8 | 195 | 446633 | 2335.91 | 801 | 781 | 190.9 |
| D | 5 | 222 | 139058 | 724.46 | 801 | 781 | 190.9 |
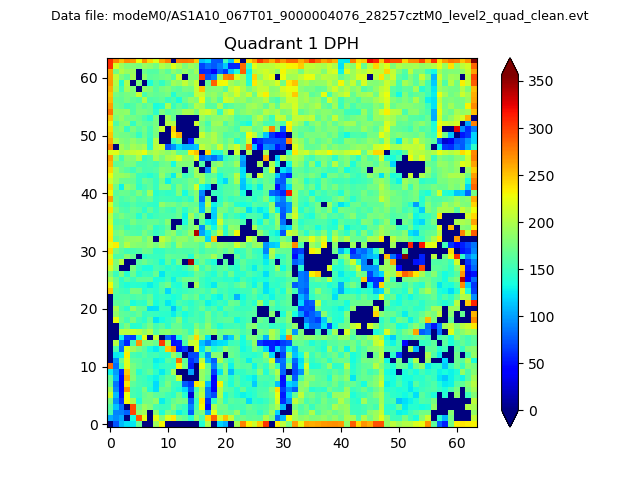
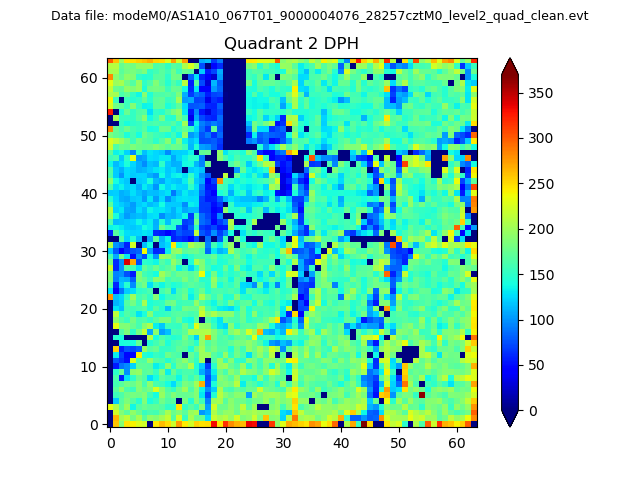
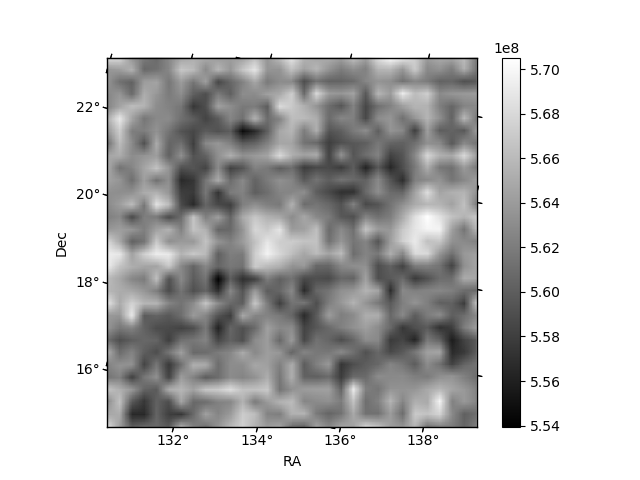
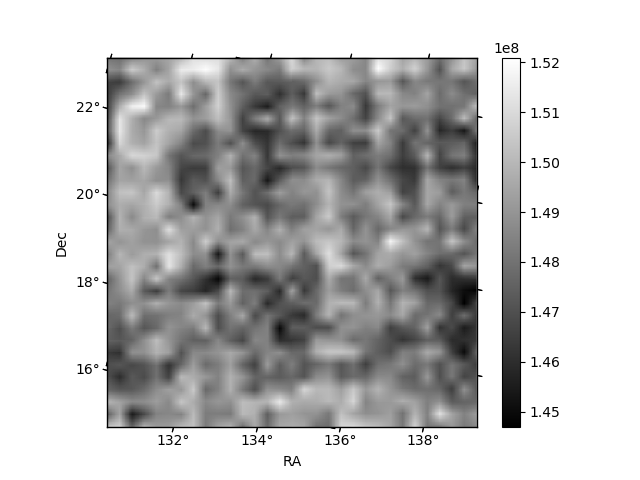
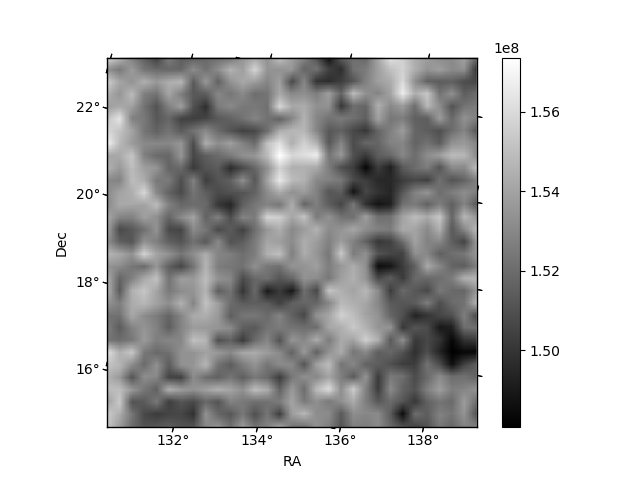
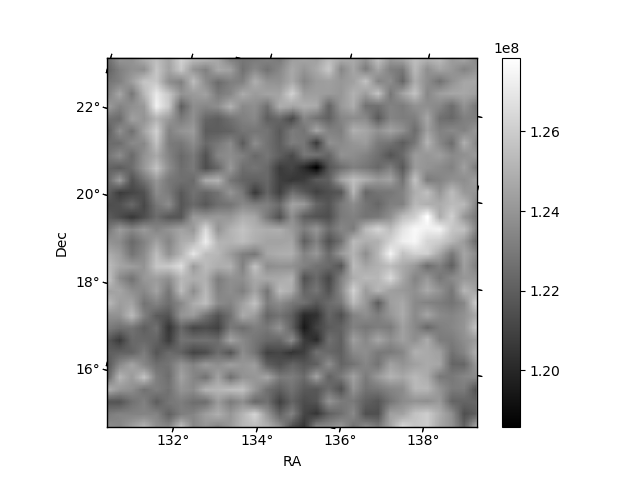
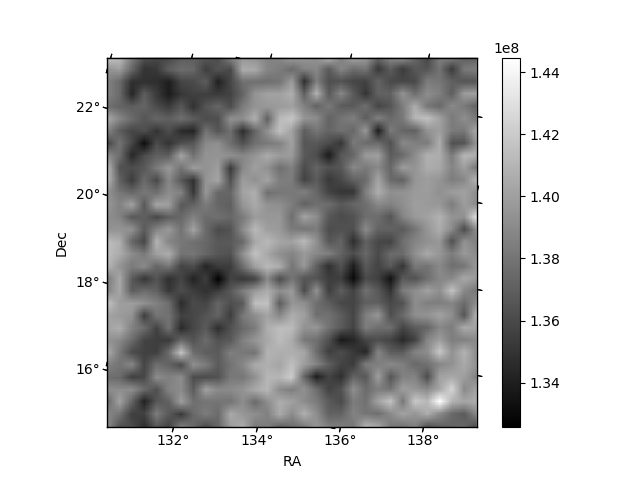
Histogram calculated using DETX and DETY for each event in the final _common_clean file
| Quadrant A | 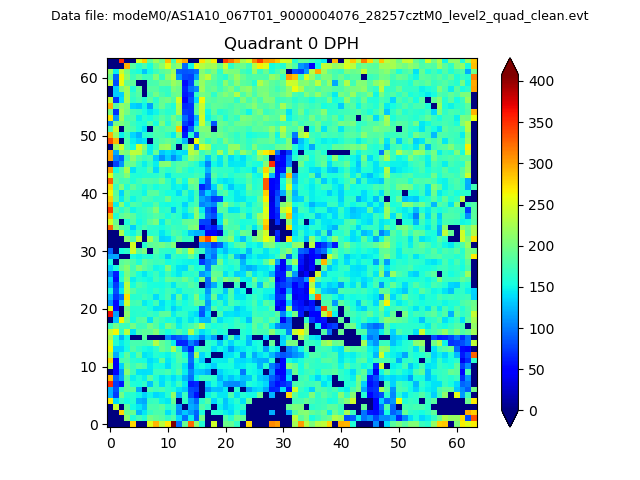 |
 |
Quadrant B |
|---|---|---|---|
| Quadrant D | 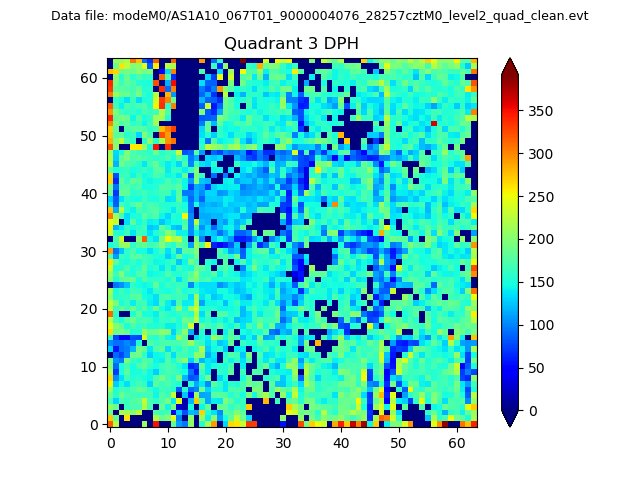 |
 |
Quadrant C |
| Plot type | Count rate plots | Images |
|---|---|---|
| Comparison with Poisson distribution Blue bars denote a histogram of data divided into 1 sec bins. Red curve is a Poisson curve with rate = median count rate of data. |
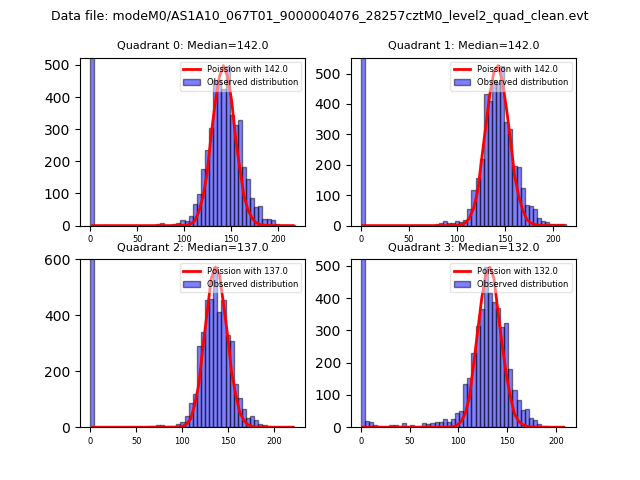 |
 |
| Quadrant-wise count rates Data is divided into 100 sec bins |
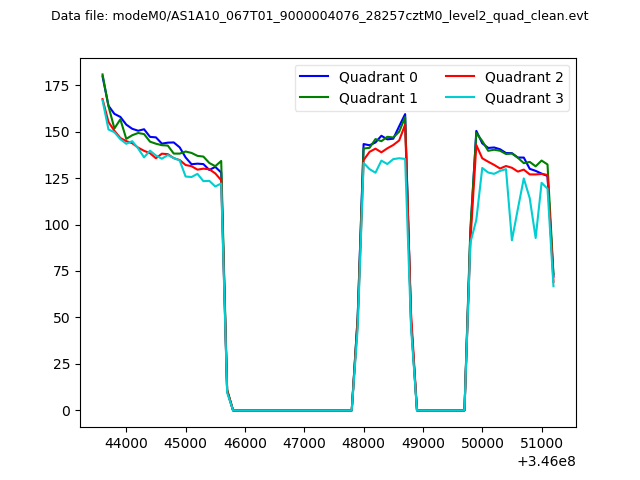 |
|
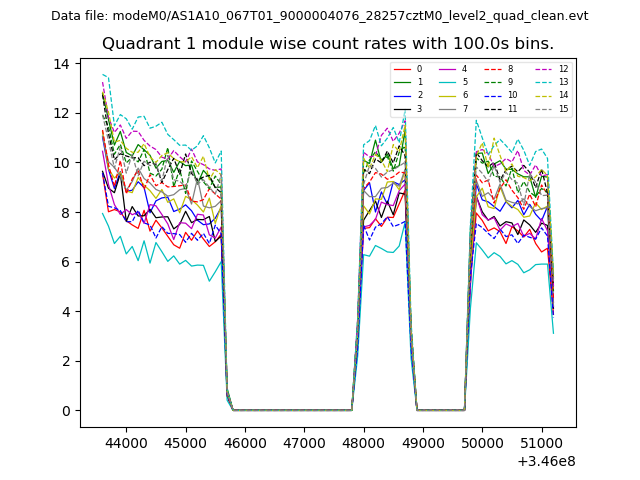
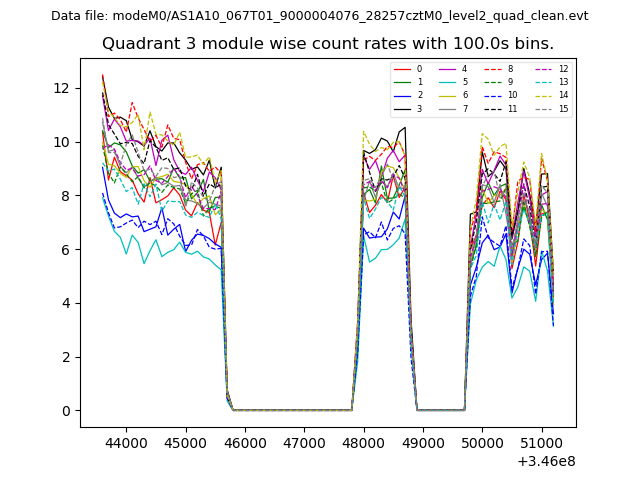
| Module-wise count rates for Quadrant A Data is divided into 100 sec bins |
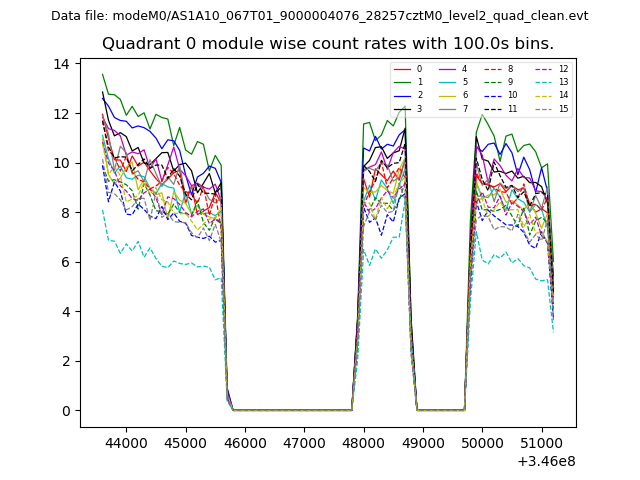 |
 |
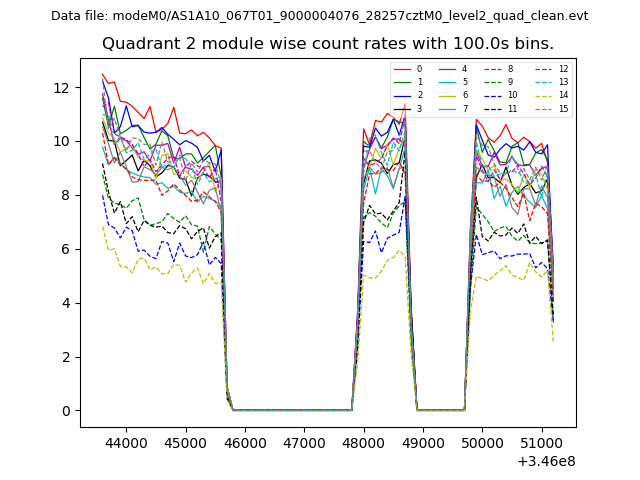
| Module-wise count rates for Quadrant B Data is divided into 100 sec bins |
 |
 |
| Module-wise count rates for Quadrant C Data is divided into 100 sec bins |
 |
 |
| Module-wise count rates for Quadrant D Data is divided into 100 sec bins |
 |
 |
| Parameter | Plot |
|---|---|
| CZT HV Monitor | 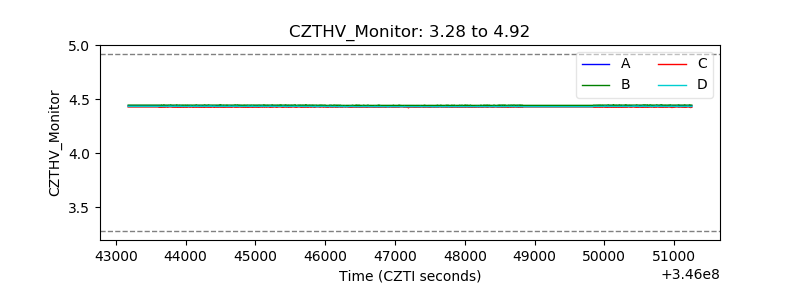 |
| D_VDD | 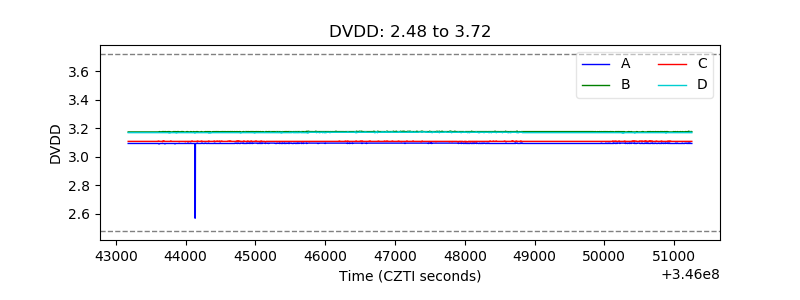 |
| Temperature 1 | 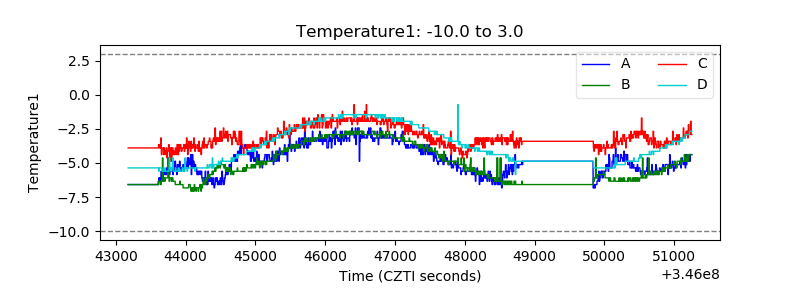 |
| Veto HV Monitor | 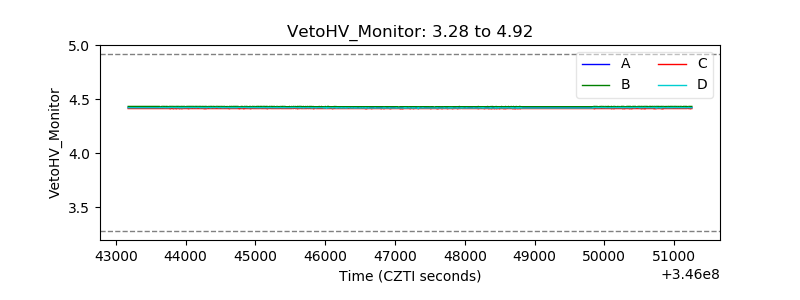 |
| Veto LLD | 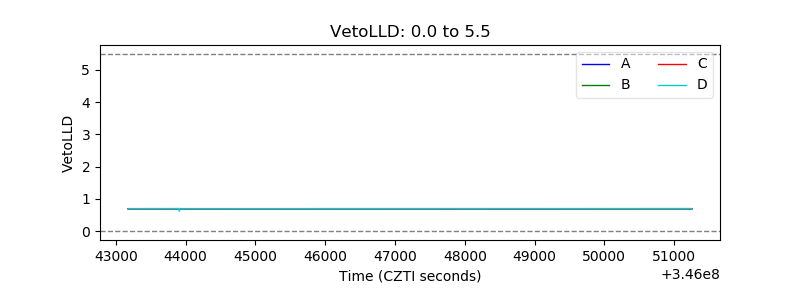 |
| Alpha Counter | 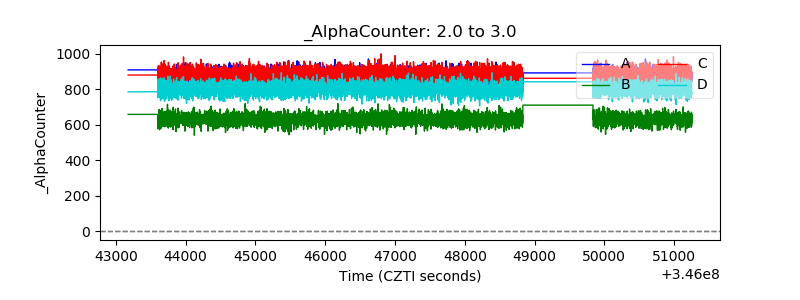 |
| _CPM_Rate | 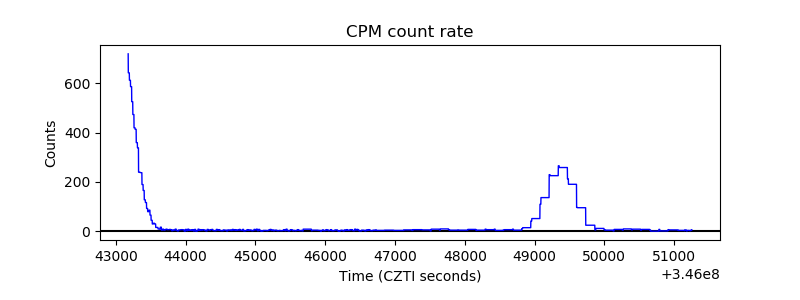 |
| CZT Counter | 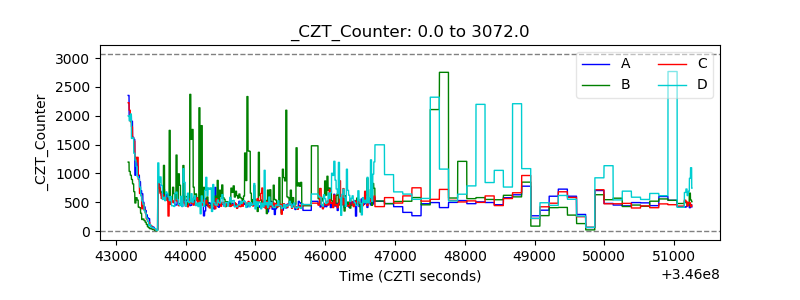 |
| +2.5 Volts monitor |  |
| +5 Volts monitor |  |
| _ROLL_ROT | 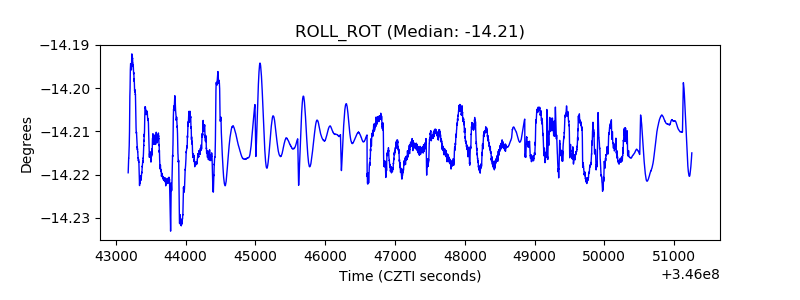 |
| _Roll_DEC |  |
| _Roll_RA | 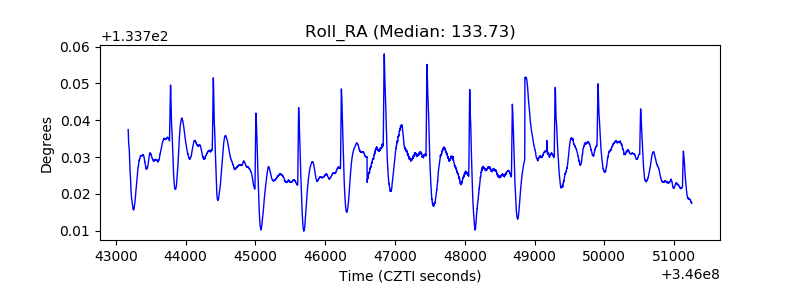 |
| Veto Counter | 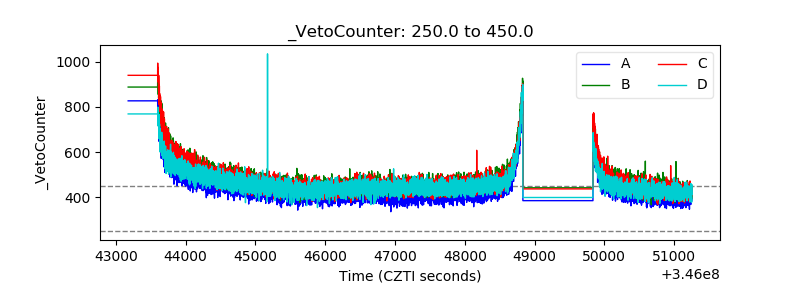 |