| Param | Original file | Final file |
|---|---|---|
| Filename | modeM0/AS1A10_067T01_9000004076_28258cztM0_level2.evt | modeM0/AS1A10_067T01_9000004076_28258cztM0_level2_quad_clean.evt |
| Size (bytes) | 574,580,160 | 96,310,080 |
| Size | 548.0 MB | 91.8 MB |
| Events in quadrant A | 3,368,602 | 632,710 |
| Events in quadrant B | 3,762,675 | 636,906 |
| Events in quadrant C | 3,472,840 | 606,874 |
| Events in quadrant D | 6,320,829 | 550,755 |
| Mode M0 | |||
|---|---|---|---|
| Quadrant | BADHDUFLAG | Total packets | Discarded packets |
| A | 0 | 14403 | 0 |
| B | 0 | 15562 | 0 |
| C | 0 | 14619 | 0 |
| D | 0 | 23755 | 0 |
| Mode M9 | |||
|---|---|---|---|
| Quadrant | BADHDUFLAG | Total packets | Discarded packets |
| A | 0 | 11 | 0 |
| B | 0 | 12 | 0 |
| C | 0 | 12 | 0 |
| D | 0 | 12 | 0 |
| Quadrant | Total seconds | Saturated seconds | Saturation percentage |
|---|---|---|---|
| A | 7027 | 99 | 1.408852% |
| B | 7027 | 171 | 2.433471% |
| C | 7027 | 133 | 1.892700% |
| D | 7027 | 827 | 11.768891% |
Noise dominated data is calculated using 1-second bins in cleaned event files. If a bin has >2000 counts, and if more than 50% of those come from <1% of pixels, then it is considered to be noise-dominated and hence unusable.
| Quadrant | # 1 sec bins | Bins with >0 counts | Bins with >2000 counts | High rate bins dominated by noise | Noise dominated (total time) | Noise dominated (detector-on time) | Marked lightcurve |
|---|---|---|---|---|---|---|---|
| A | 7632 | 7027 | 0 | 0 | 0.00% | 0.00% | 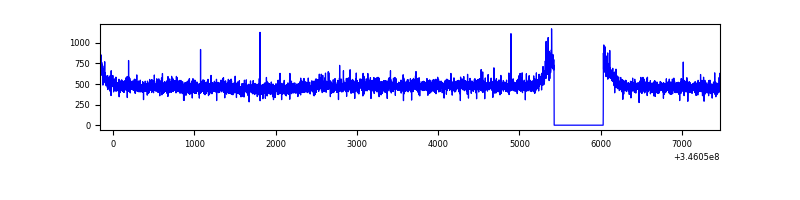 |
| B | 7632 | 7027 | 54 | 54 | 0.71% | 0.77% | 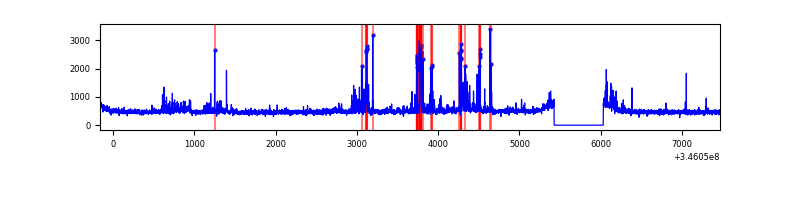 |
| C | 7632 | 7027 | 3 | 3 | 0.04% | 0.04% | 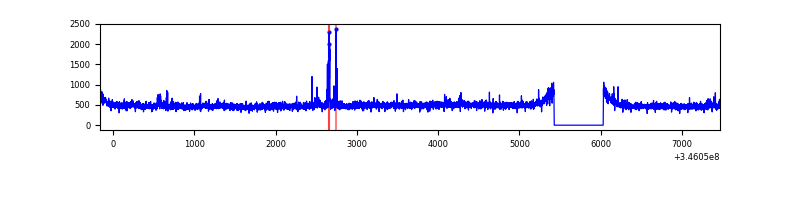 |
| D | 7632 | 7027 | 507 | 507 | 6.64% | 7.22% | 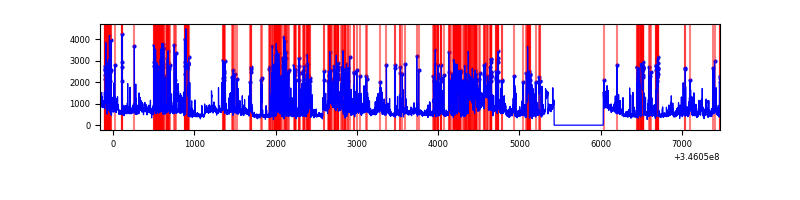 |
Top three noisy pixels from each quadrant. If the there are fewer than three noisy pixels in the level2.evt file, extra rows are filled as -1
| Pixel properties | Quadrant properties | ||||||
|---|---|---|---|---|---|---|---|
| Quadrant | DetID | PixID | Counts | Sigma | Mean | Median | Sigma |
| A | 13 | 254 | 11019 | 58.34 | 869 | 851 | 174.3 |
| A | 3 | 137 | 8738 | 45.25 | 869 | 851 | 174.3 |
| A | 0 | 226 | 7322 | 37.13 | 869 | 851 | 174.3 |
| B | 10 | 245 | 374785 | 2269.2 | 855 | 834 | 164.8 |
| B | 12 | 111 | 20497 | 119.32 | 855 | 834 | 164.8 |
| B | 11 | 111 | 19131 | 111.03 | 855 | 834 | 164.8 |
| C | 14 | 238 | 132671 | 679.1 | 828 | 833 | 194.1 |
| C | 3 | 233 | 95185 | 486.01 | 828 | 833 | 194.1 |
| C | 1 | 90 | 13661 | 66.08 | 828 | 833 | 194.1 |
| D | 1 | 52 | 2294224 | 12095.79 | 795 | 774 | 189.6 |
| D | 8 | 195 | 766125 | 4036.51 | 795 | 774 | 189.6 |
| D | 2 | 250 | 158819 | 833.54 | 795 | 774 | 189.6 |
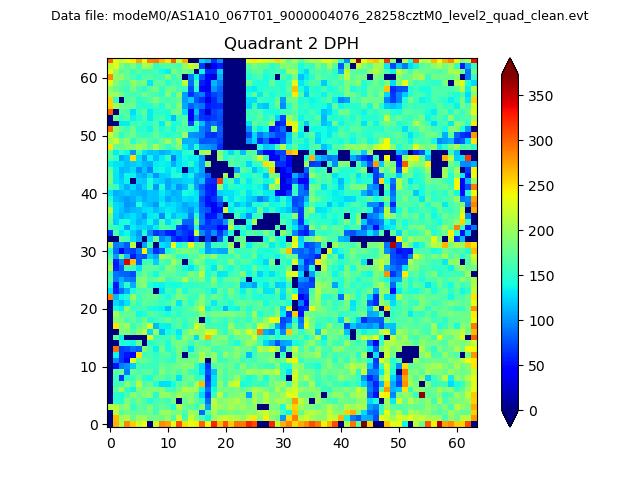
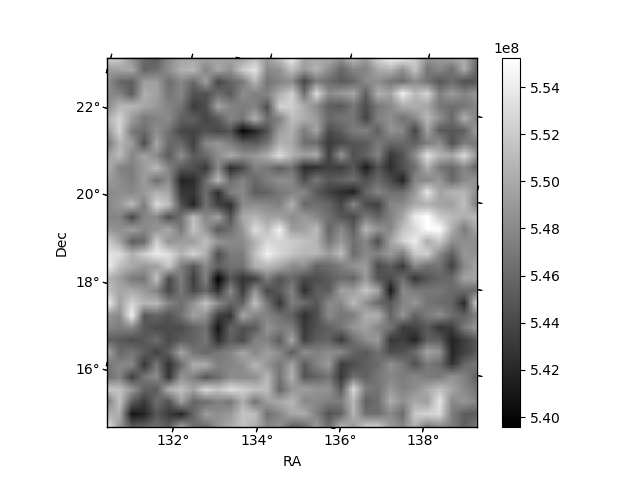
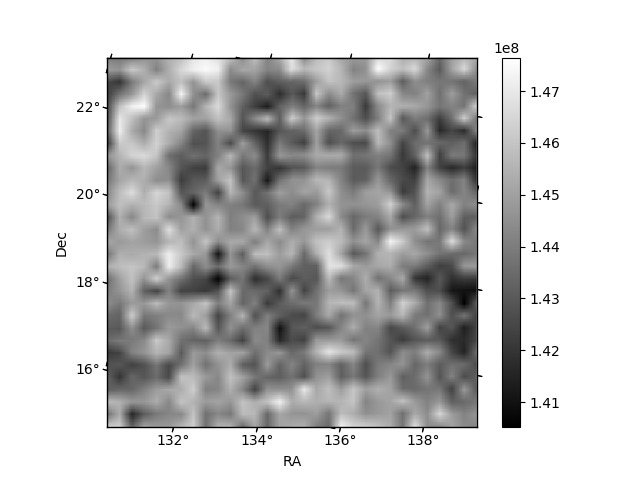
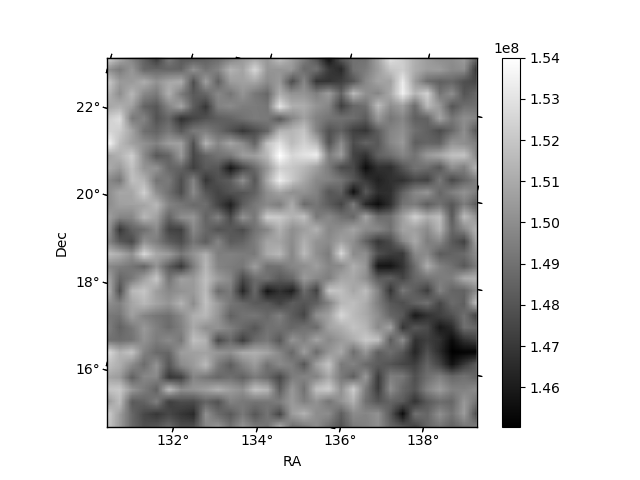
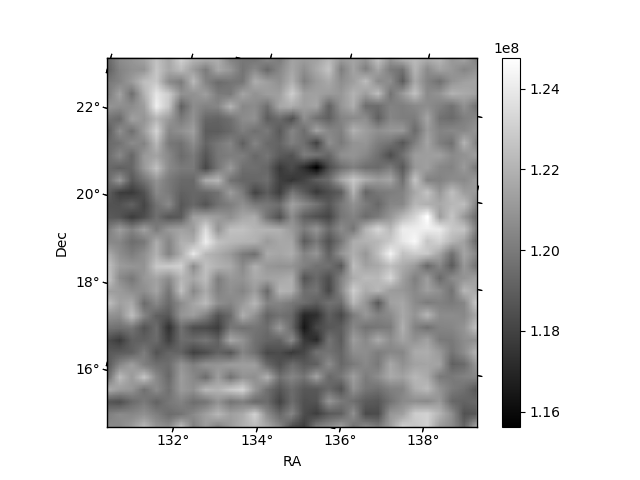
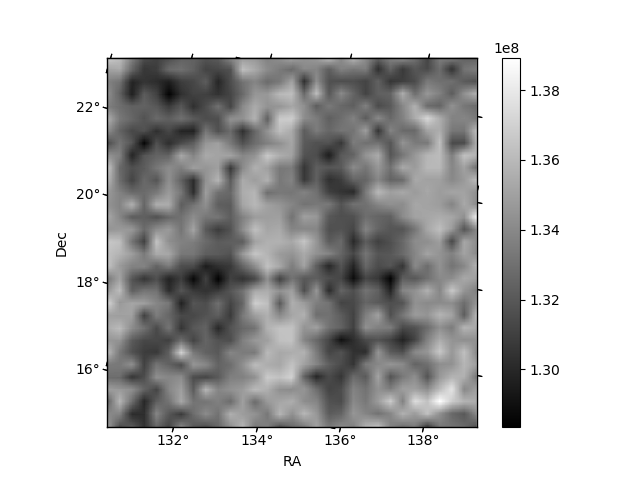
Histogram calculated using DETX and DETY for each event in the final _common_clean file
| Quadrant A | 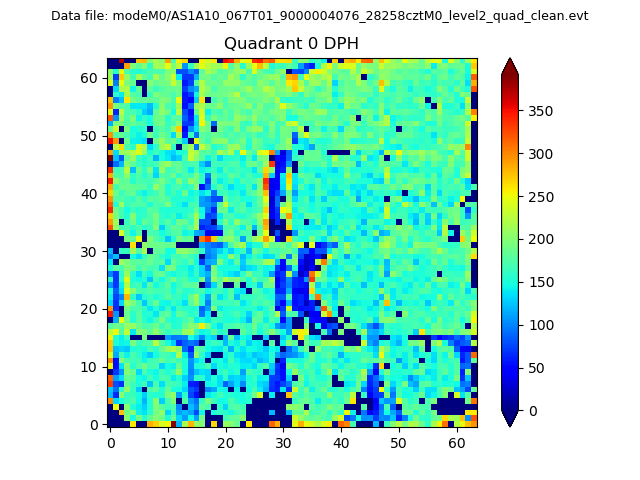 |
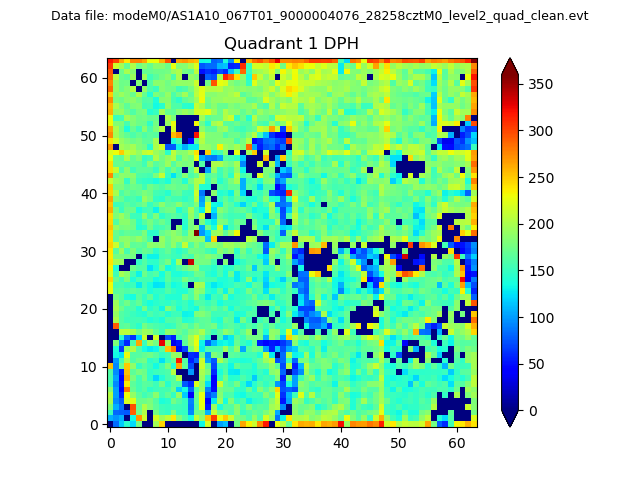 |
Quadrant B |
|---|---|---|---|
| Quadrant D | 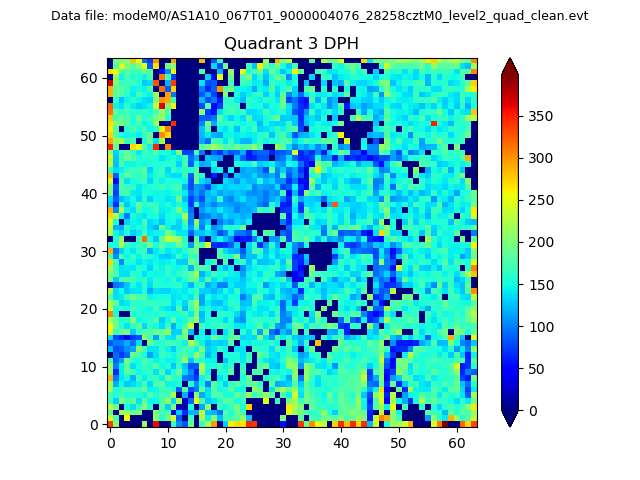 |
 |
Quadrant C |
| Plot type | Count rate plots | Images |
|---|---|---|
| Comparison with Poisson distribution Blue bars denote a histogram of data divided into 1 sec bins. Red curve is a Poisson curve with rate = median count rate of data. |
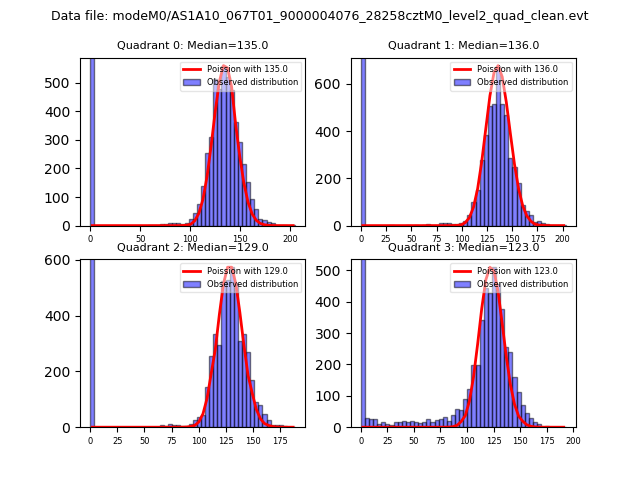 |
 |
| Quadrant-wise count rates Data is divided into 100 sec bins |
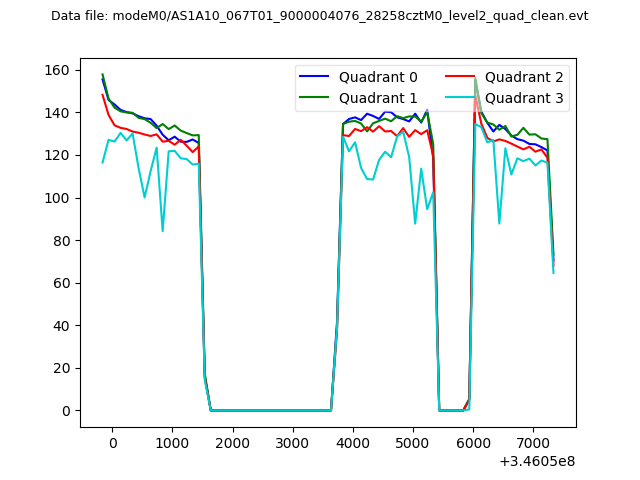 |
|
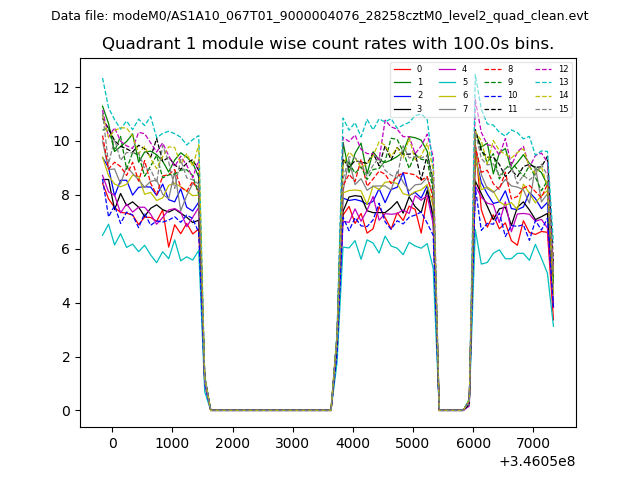
| Module-wise count rates for Quadrant A Data is divided into 100 sec bins |
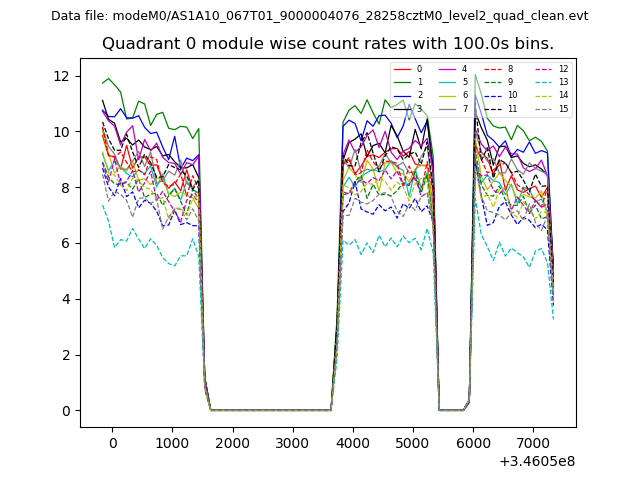 |
 |
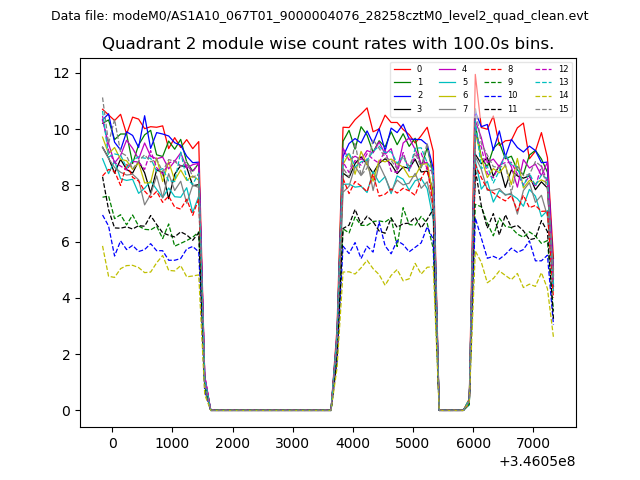
| Module-wise count rates for Quadrant B Data is divided into 100 sec bins |
 |
 |
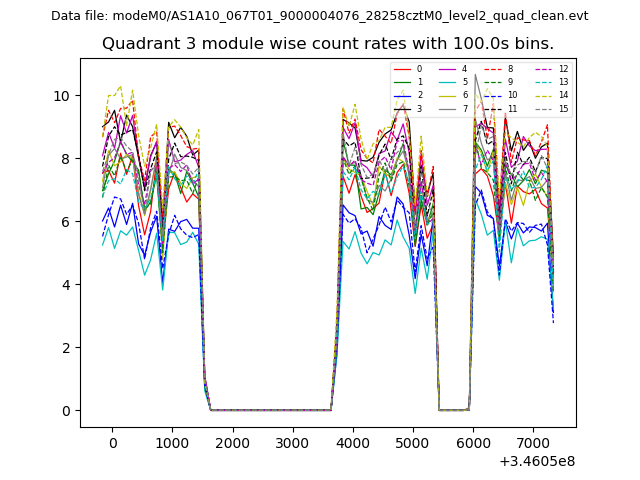
| Module-wise count rates for Quadrant C Data is divided into 100 sec bins |
 |
 |
| Module-wise count rates for Quadrant D Data is divided into 100 sec bins |
 |
 |
| Parameter | Plot |
|---|---|
| CZT HV Monitor | 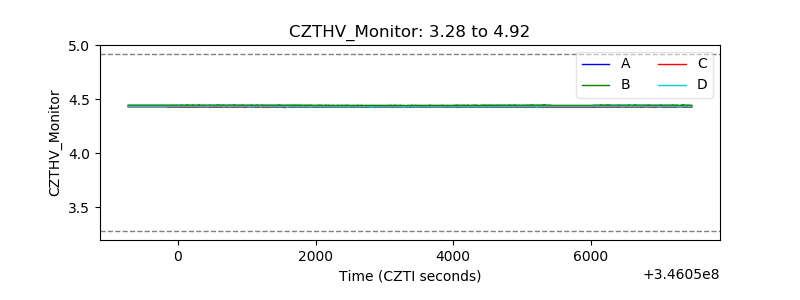 |
| D_VDD | 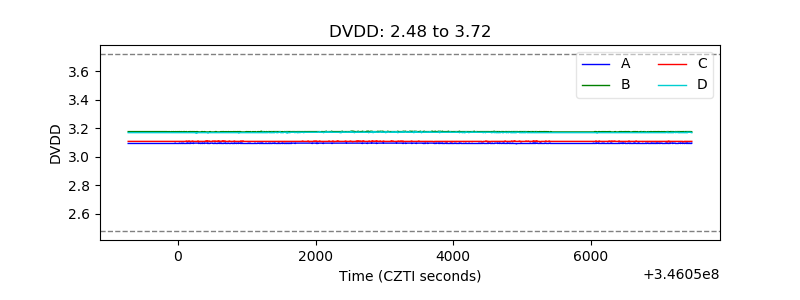 |
| Temperature 1 | 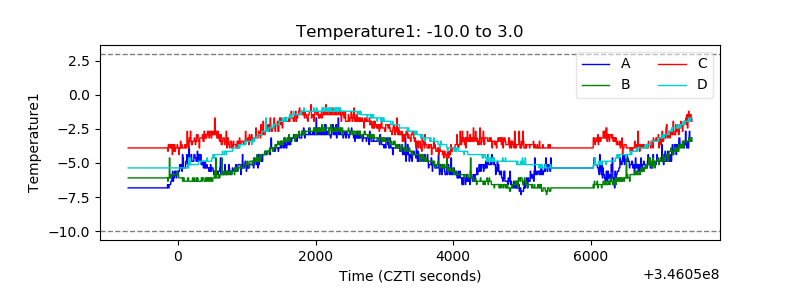 |
| Veto HV Monitor | 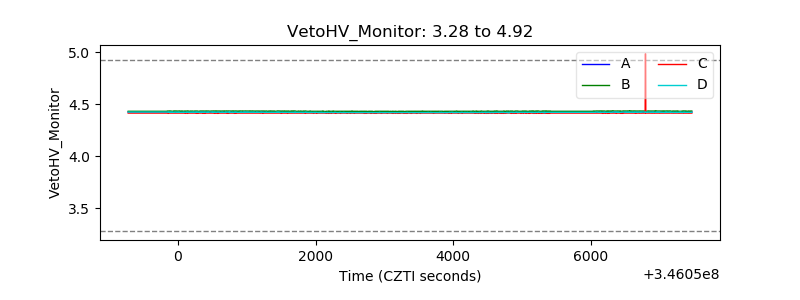 |
| Veto LLD | 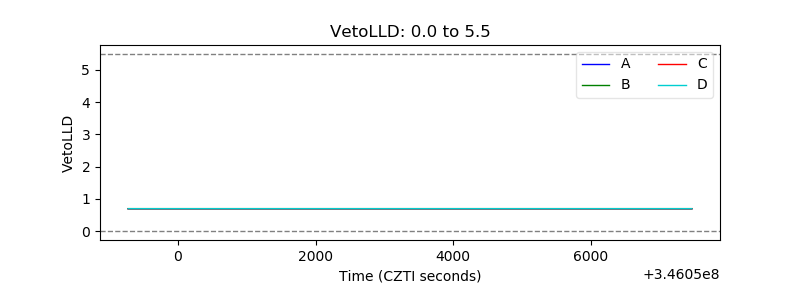 |
| Alpha Counter | 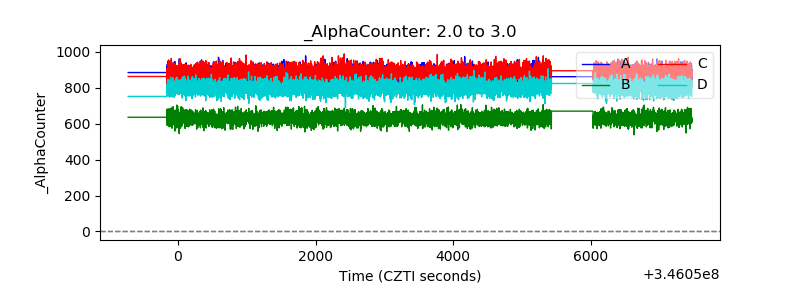 |
| _CPM_Rate | 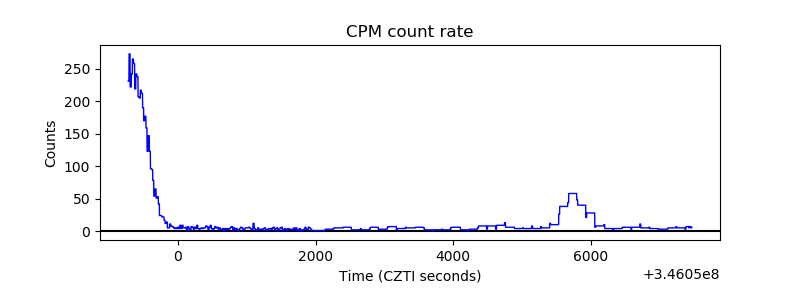 |
| CZT Counter | 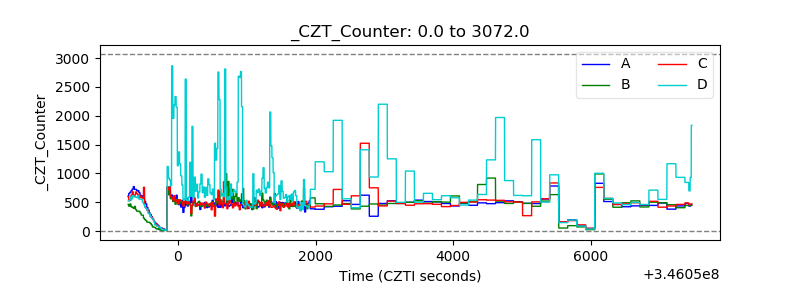 |
| +2.5 Volts monitor |  |
| +5 Volts monitor |  |
| _ROLL_ROT | 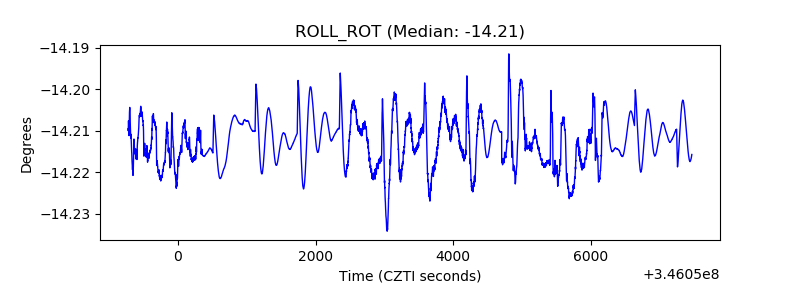 |
| _Roll_DEC | 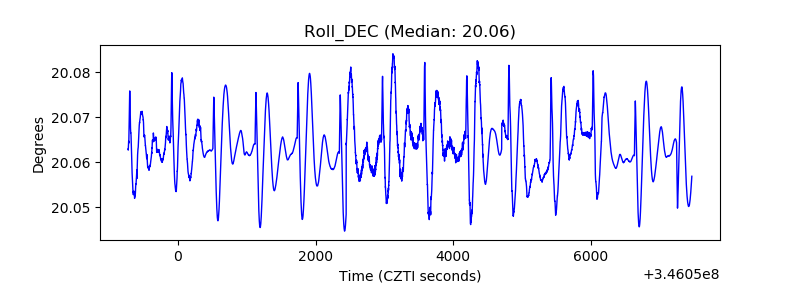 |
| _Roll_RA | 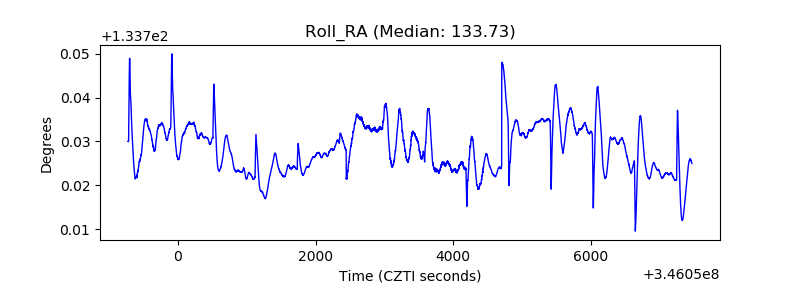 |
| Veto Counter | 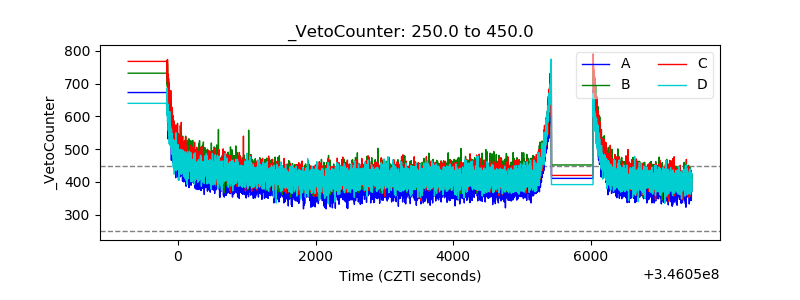 |