| Param | Original file | Final file |
|---|---|---|
| Filename | modeM0/AS1A10_067T01_9000004076_28259cztM0_level2.evt | modeM0/AS1A10_067T01_9000004076_28259cztM0_level2_quad_clean.evt |
| Size (bytes) | 619,856,640 | 93,274,560 |
| Size | 591.1 MB | 89.0 MB |
| Events in quadrant A | 3,648,995 | 593,107 |
| Events in quadrant B | 3,922,319 | 599,331 |
| Events in quadrant C | 3,721,681 | 569,940 |
| Events in quadrant D | 6,973,858 | 543,087 |
| Mode M0 | |||
|---|---|---|---|
| Quadrant | BADHDUFLAG | Total packets | Discarded packets |
| A | 0 | 15601 | 0 |
| B | 0 | 16296 | 0 |
| C | 0 | 15693 | 0 |
| D | 0 | 25787 | 0 |
| Quadrant | Total seconds | Saturated seconds | Saturation percentage |
|---|---|---|---|
| A | 7445 | 347 | 4.660846% |
| B | 7446 | 365 | 4.901961% |
| C | 7445 | 372 | 4.996642% |
| D | 7445 | 1275 | 17.125588% |
Noise dominated data is calculated using 1-second bins in cleaned event files. If a bin has >2000 counts, and if more than 50% of those come from <1% of pixels, then it is considered to be noise-dominated and hence unusable.
| Quadrant | # 1 sec bins | Bins with >0 counts | Bins with >2000 counts | High rate bins dominated by noise | Noise dominated (total time) | Noise dominated (detector-on time) | Marked lightcurve |
|---|---|---|---|---|---|---|---|
| A | 7445 | 7445 | 5 | 5 | 0.07% | 0.07% | 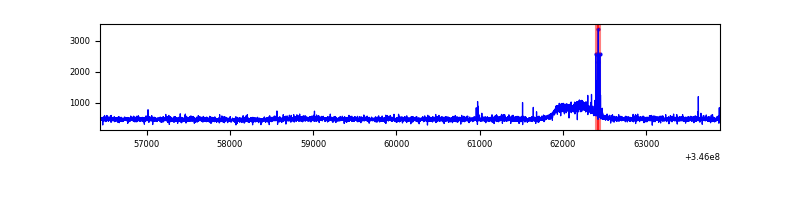 |
| B | 7446 | 7446 | 12 | 12 | 0.16% | 0.16% | 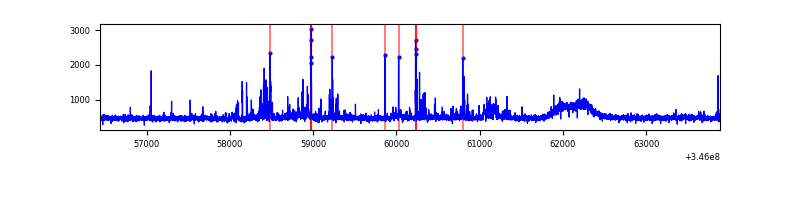 |
| C | 7445 | 7445 | 0 | 0 | 0.00% | 0.00% | 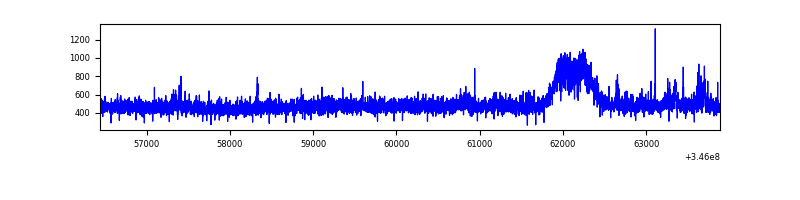 |
| D | 7445 | 7445 | 787 | 787 | 10.57% | 10.57% | 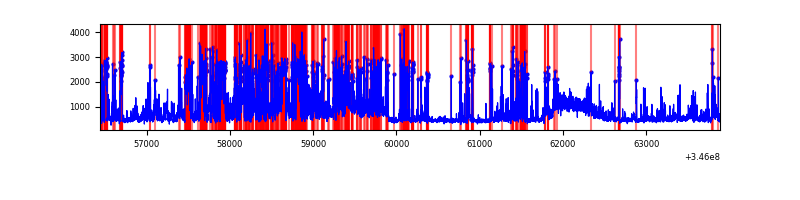 |
Top three noisy pixels from each quadrant. If the there are fewer than three noisy pixels in the level2.evt file, extra rows are filled as -1
| Pixel properties | Quadrant properties | ||||||
|---|---|---|---|---|---|---|---|
| Quadrant | DetID | PixID | Counts | Sigma | Mean | Median | Sigma |
| A | 12 | 96 | 35834 | 183.9 | 936 | 912 | 189.9 |
| A | 13 | 254 | 11673 | 56.67 | 936 | 912 | 189.9 |
| A | 3 | 137 | 9710 | 46.33 | 936 | 912 | 189.9 |
| B | 10 | 245 | 269841 | 1486.35 | 919 | 895 | 180.9 |
| B | 12 | 111 | 22964 | 121.97 | 919 | 895 | 180.9 |
| B | 11 | 111 | 21065 | 111.47 | 919 | 895 | 180.9 |
| C | 14 | 238 | 138667 | 649.84 | 893 | 900 | 212.0 |
| C | 3 | 233 | 98411 | 459.96 | 893 | 900 | 212.0 |
| C | 13 | 61 | 6171 | 24.86 | 893 | 900 | 212.0 |
| D | 1 | 52 | 2784288 | 13590.73 | 852 | 826 | 204.8 |
| D | 8 | 195 | 393718 | 1918.36 | 852 | 826 | 204.8 |
| D | 5 | 222 | 207916 | 1011.15 | 852 | 826 | 204.8 |
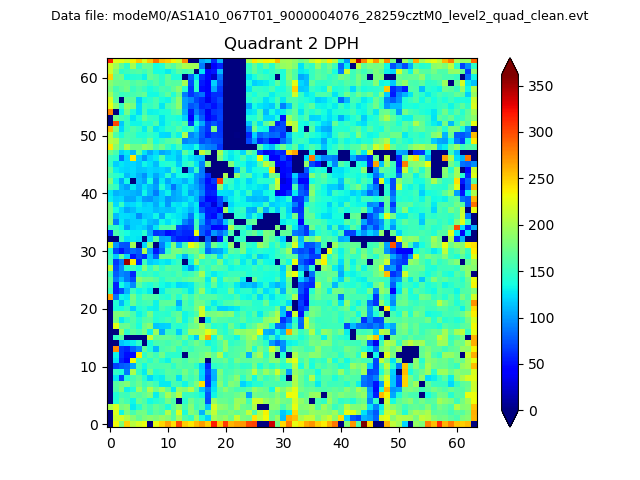
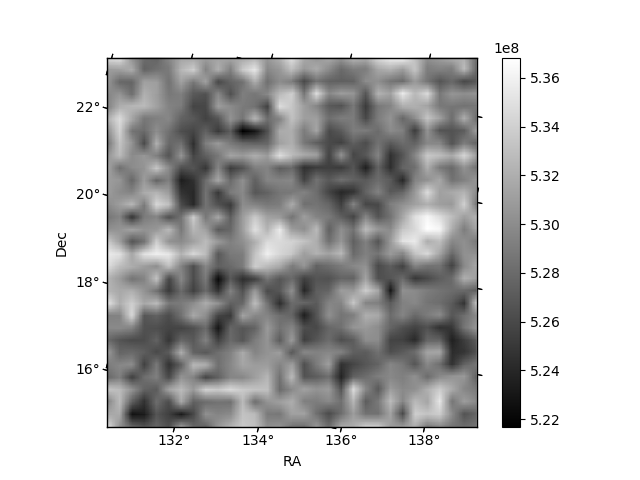
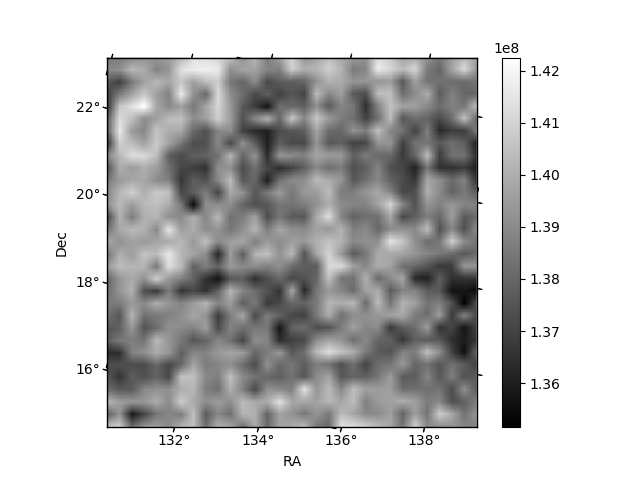
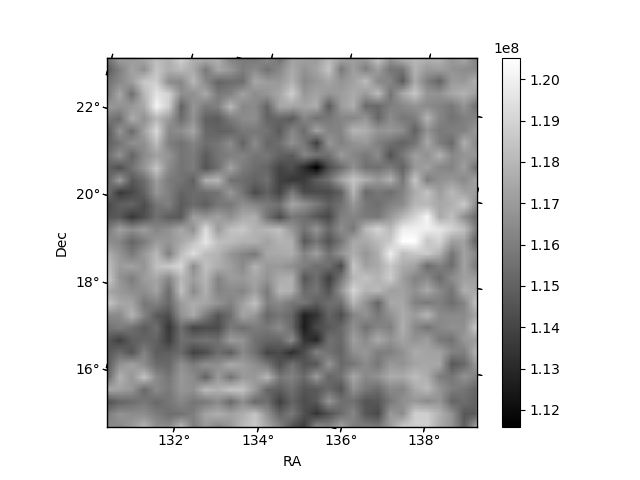
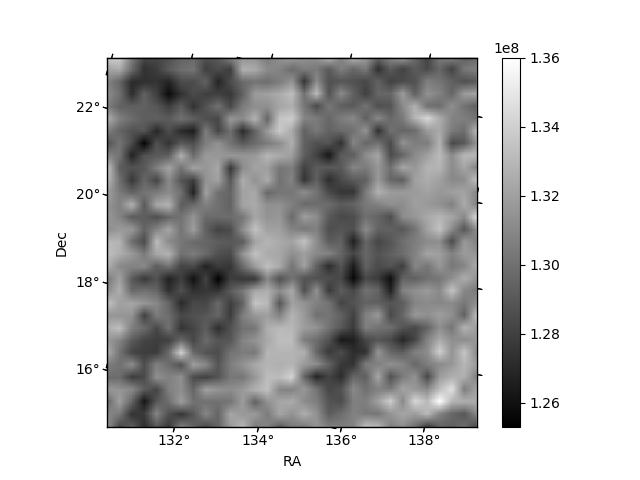
Histogram calculated using DETX and DETY for each event in the final _common_clean file
| Quadrant A | 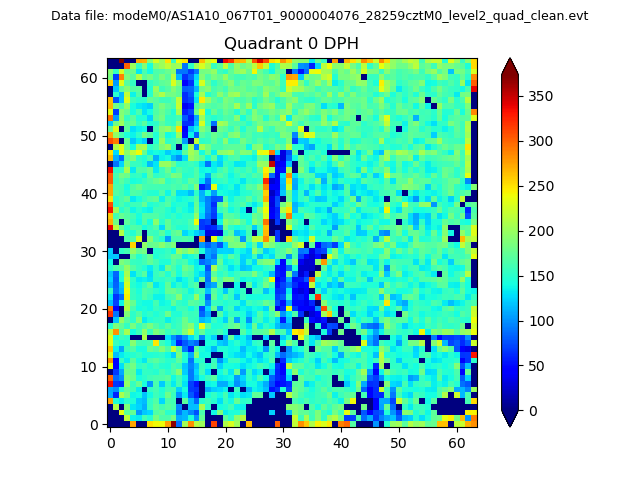 |
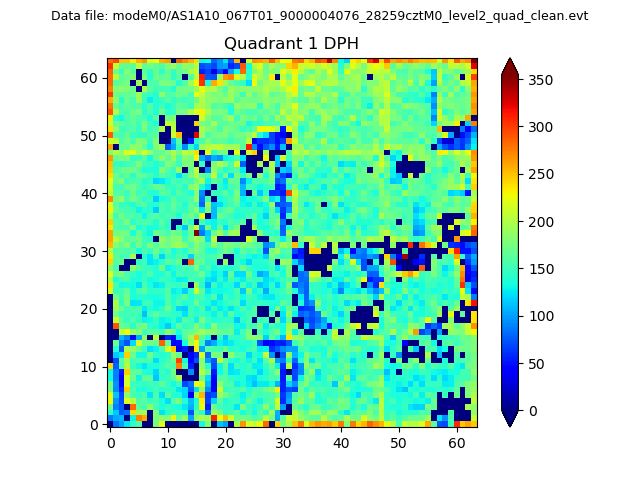 |
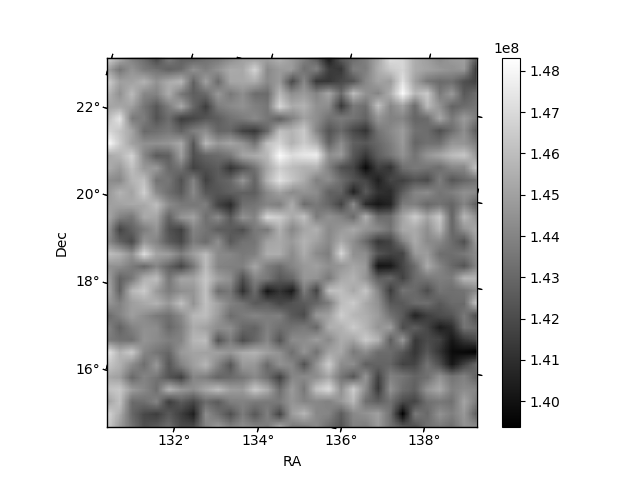
Quadrant B |
|---|---|---|---|
| Quadrant D | 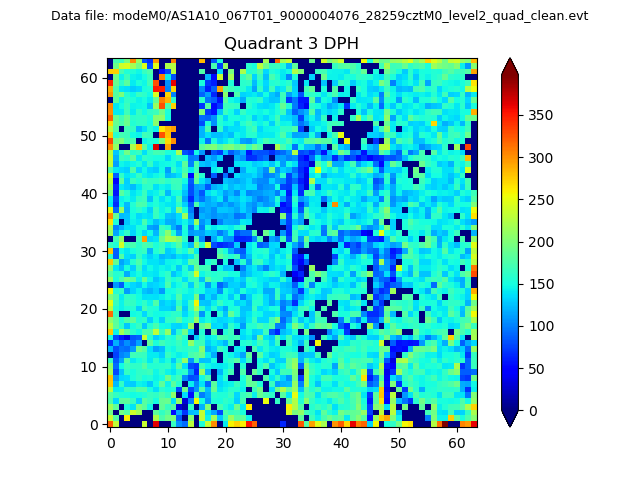 |
 |
Quadrant C |
| Plot type | Count rate plots | Images |
|---|---|---|
| Comparison with Poisson distribution Blue bars denote a histogram of data divided into 1 sec bins. Red curve is a Poisson curve with rate = median count rate of data. |
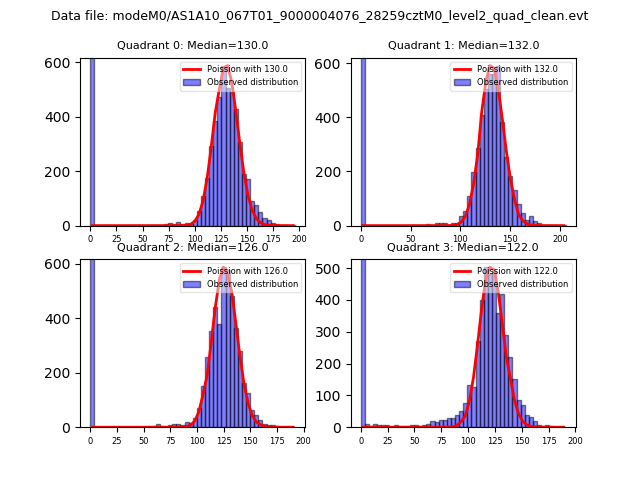 |
 |
| Quadrant-wise count rates Data is divided into 100 sec bins |
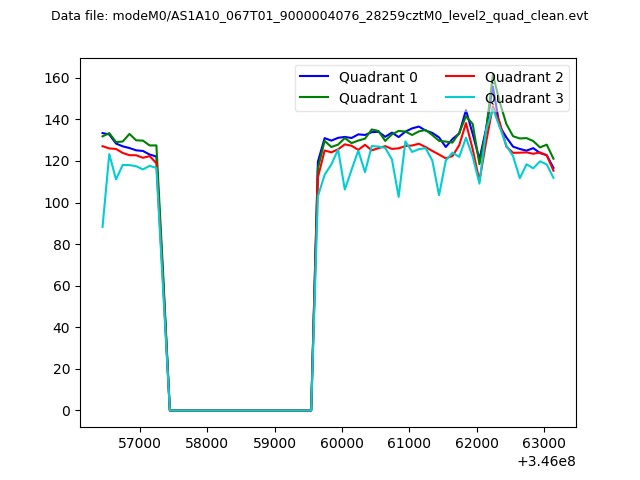 |
|
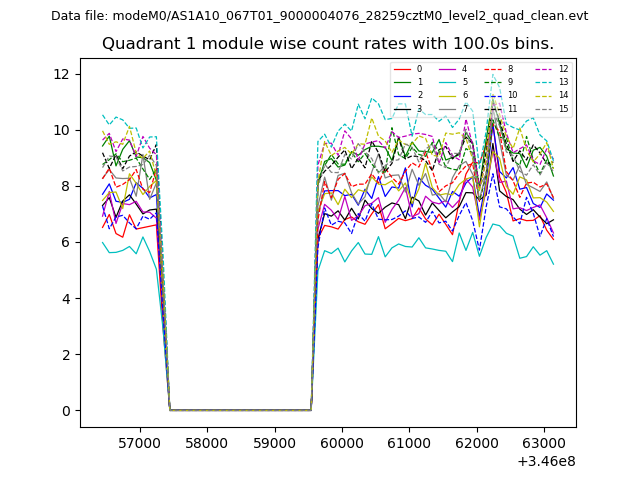
| Module-wise count rates for Quadrant A Data is divided into 100 sec bins |
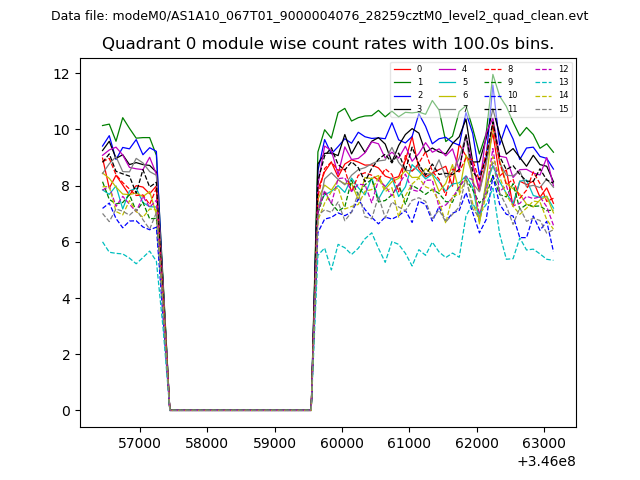 |
 |
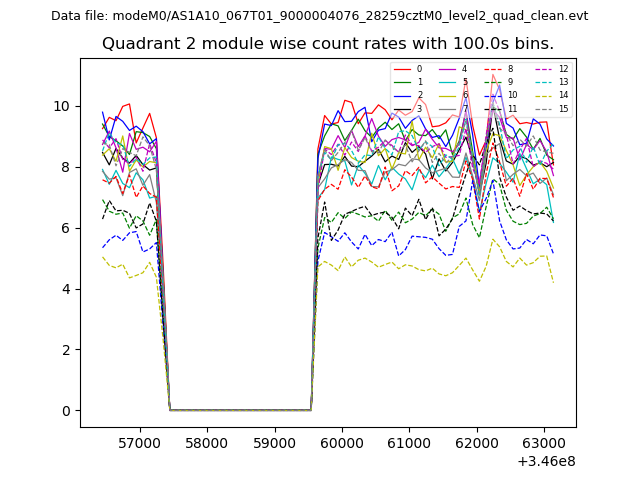
| Module-wise count rates for Quadrant B Data is divided into 100 sec bins |
 |
 |
| Module-wise count rates for Quadrant C Data is divided into 100 sec bins |
 |
 |
| Module-wise count rates for Quadrant D Data is divided into 100 sec bins |
 |
 |
| Parameter | Plot |
|---|---|
| CZT HV Monitor | 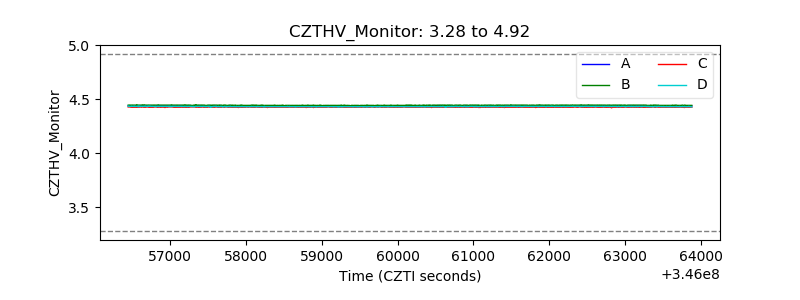 |
| D_VDD | 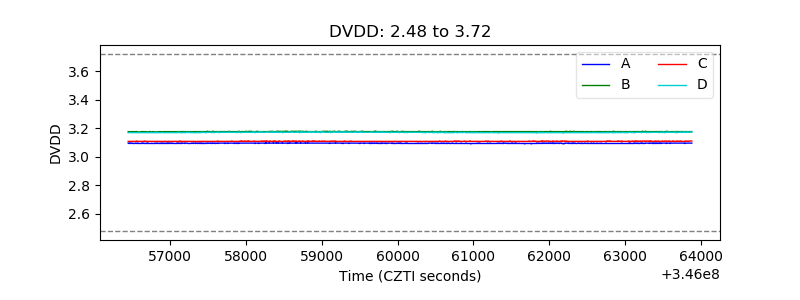 |
| Temperature 1 | 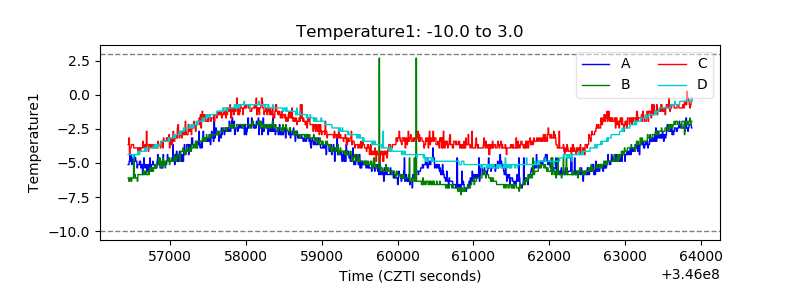 |
| Veto HV Monitor | 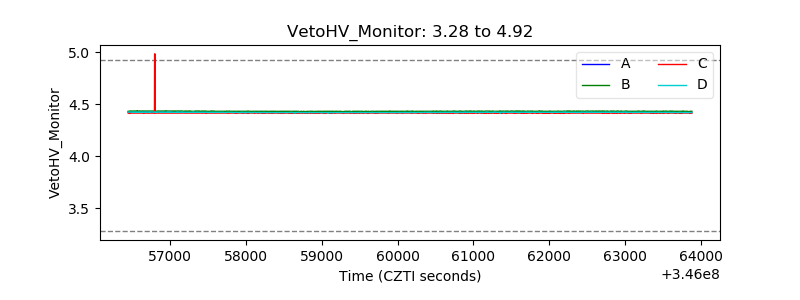 |
| Veto LLD | 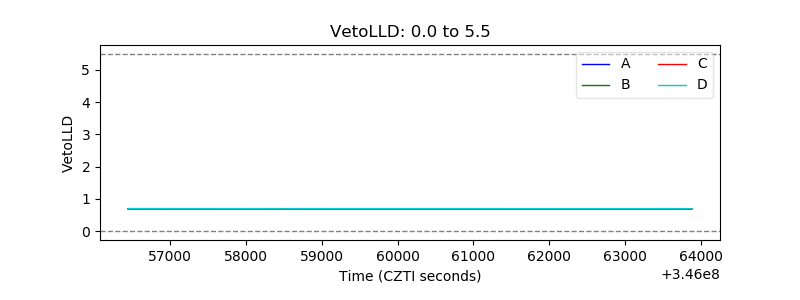 |
| Alpha Counter | 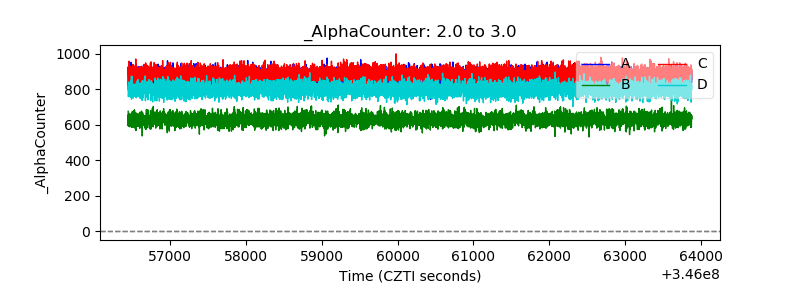 |
| _CPM_Rate | 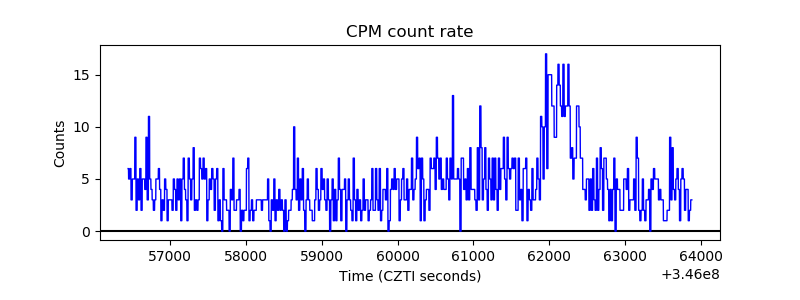 |
| CZT Counter | 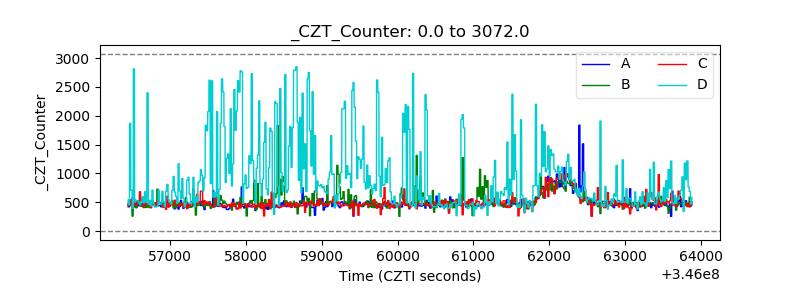 |
| +2.5 Volts monitor | 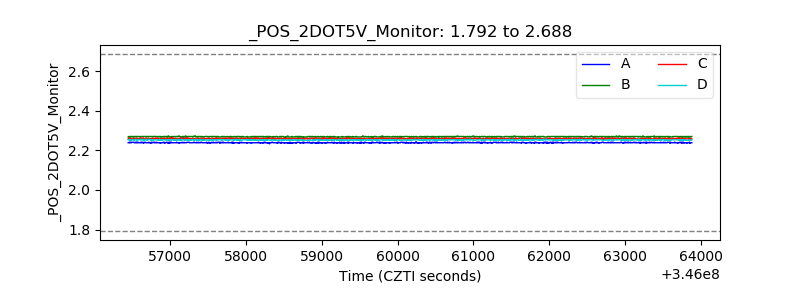 |
| +5 Volts monitor | 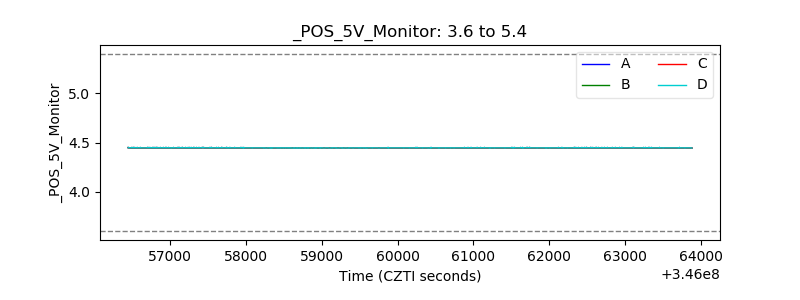 |
| _ROLL_ROT | 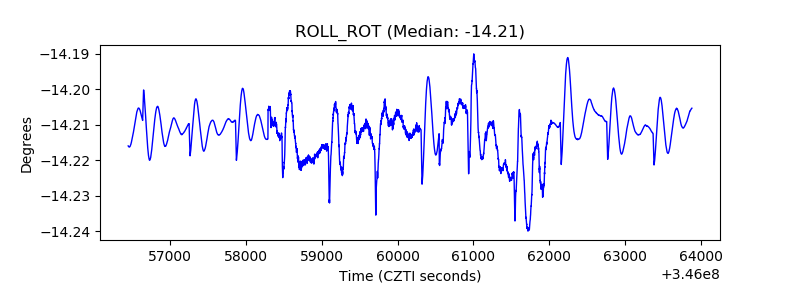 |
| _Roll_DEC |  |
| _Roll_RA | 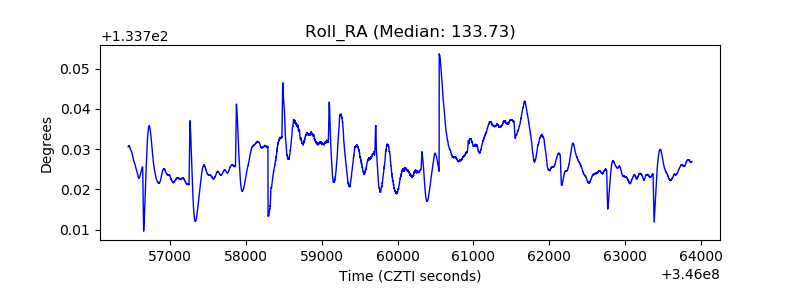 |
| Veto Counter | 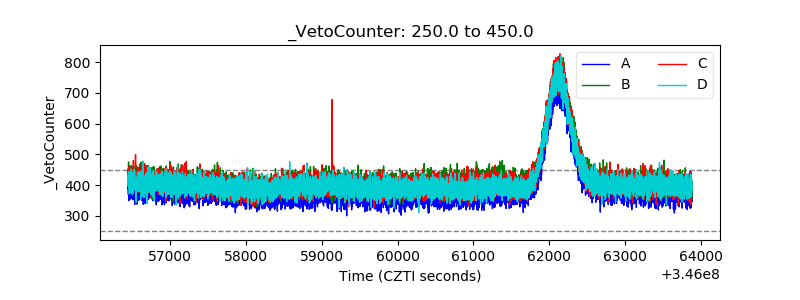 |