| Param | Original file | Final file |
|---|---|---|
| Filename | modeM0/AS1A10_067T01_9000004076_28260cztM0_level2.evt | modeM0/AS1A10_067T01_9000004076_28260cztM0_level2_quad_clean.evt |
| Size (bytes) | 561,381,120 | 83,770,560 |
| Size | 535.4 MB | 79.9 MB |
| Events in quadrant A | 3,479,514 | 522,196 |
| Events in quadrant B | 3,677,235 | 524,832 |
| Events in quadrant C | 3,776,485 | 498,315 |
| Events in quadrant D | 5,578,778 | 488,674 |
| Mode M0 | |||
|---|---|---|---|
| Quadrant | BADHDUFLAG | Total packets | Discarded packets |
| A | 0 | 15003 | 0 |
| B | 0 | 15418 | 0 |
| C | 0 | 15686 | 0 |
| D | 0 | 21387 | 0 |
| Mode M9 | |||
|---|---|---|---|
| Quadrant | BADHDUFLAG | Total packets | Discarded packets |
| A | 0 | 2 | 0 |
| B | 0 | 2 | 0 |
| C | 0 | 2 | 0 |
| D | 0 | 2 | 0 |
| Quadrant | Total seconds | Saturated seconds | Saturation percentage |
|---|---|---|---|
| A | 7223 | 189 | 2.616641% |
| B | 7224 | 215 | 2.976190% |
| C | 7224 | 277 | 3.834441% |
| D | 7224 | 507 | 7.018272% |
Noise dominated data is calculated using 1-second bins in cleaned event files. If a bin has >2000 counts, and if more than 50% of those come from <1% of pixels, then it is considered to be noise-dominated and hence unusable.
| Quadrant | # 1 sec bins | Bins with >0 counts | Bins with >2000 counts | High rate bins dominated by noise | Noise dominated (total time) | Noise dominated (detector-on time) | Marked lightcurve |
|---|---|---|---|---|---|---|---|
| A | 7338 | 7223 | 0 | 0 | 0.00% | 0.00% | 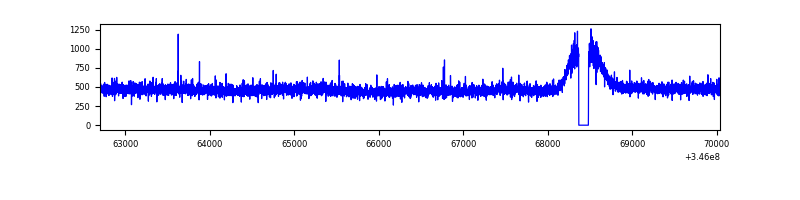 |
| B | 7339 | 7224 | 3 | 3 | 0.04% | 0.04% | 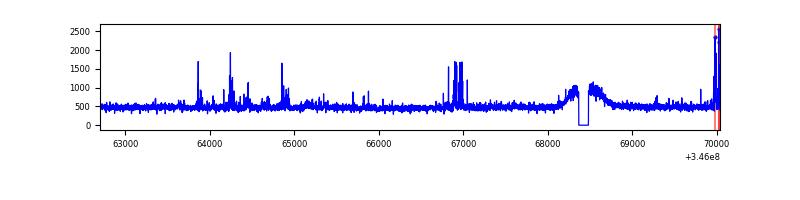 |
| C | 7339 | 7224 | 6 | 6 | 0.08% | 0.08% | 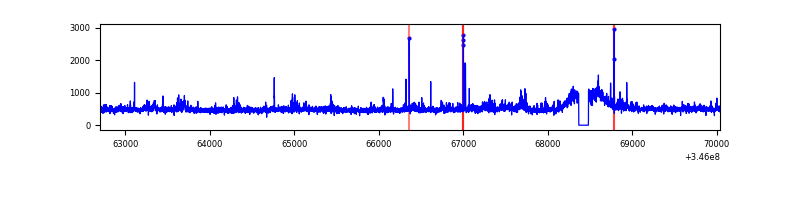 |
| D | 7339 | 7224 | 278 | 278 | 3.79% | 3.85% | 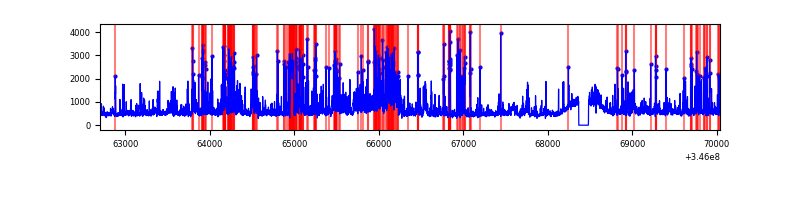 |
Top three noisy pixels from each quadrant. If the there are fewer than three noisy pixels in the level2.evt file, extra rows are filled as -1
| Pixel properties | Quadrant properties | ||||||
|---|---|---|---|---|---|---|---|
| Quadrant | DetID | PixID | Counts | Sigma | Mean | Median | Sigma |
| A | 13 | 254 | 12020 | 60.6 | 901 | 883 | 183.8 |
| A | 3 | 137 | 9236 | 45.45 | 901 | 883 | 183.8 |
| A | 0 | 226 | 7673 | 36.95 | 901 | 883 | 183.8 |
| B | 10 | 245 | 118715 | 678.0 | 886 | 863 | 173.8 |
| B | 10 | 246 | 32459 | 181.77 | 886 | 863 | 173.8 |
| B | 4 | 200 | 26079 | 145.07 | 886 | 863 | 173.8 |
| C | 3 | 233 | 289452 | 1416.36 | 857 | 860 | 203.8 |
| C | 14 | 238 | 135937 | 662.94 | 857 | 860 | 203.8 |
| C | 9 | 54 | 6394 | 27.16 | 857 | 860 | 203.8 |
| D | 1 | 52 | 1529963 | 7388.35 | 858 | 833 | 207.0 |
| D | 5 | 222 | 251213 | 1209.77 | 858 | 833 | 207.0 |
| D | 8 | 195 | 188394 | 906.24 | 858 | 833 | 207.0 |
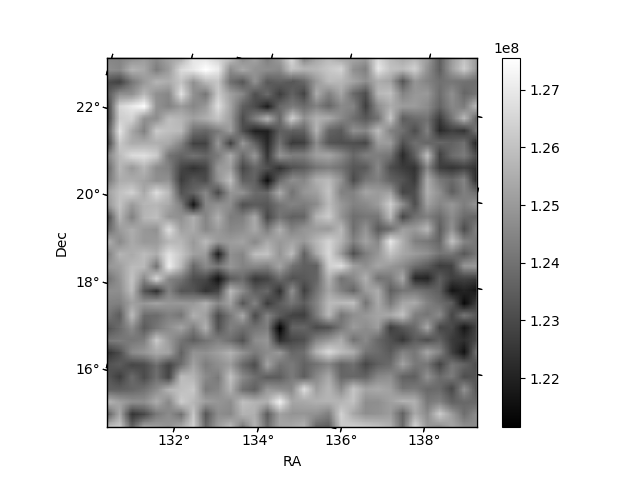
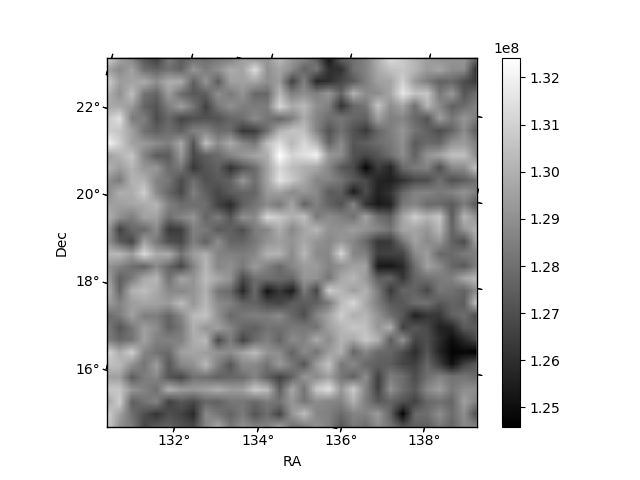
Histogram calculated using DETX and DETY for each event in the final _common_clean file
| Quadrant A | 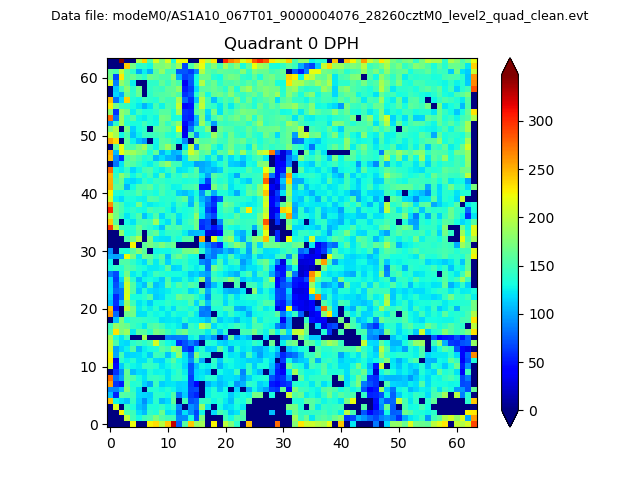 |
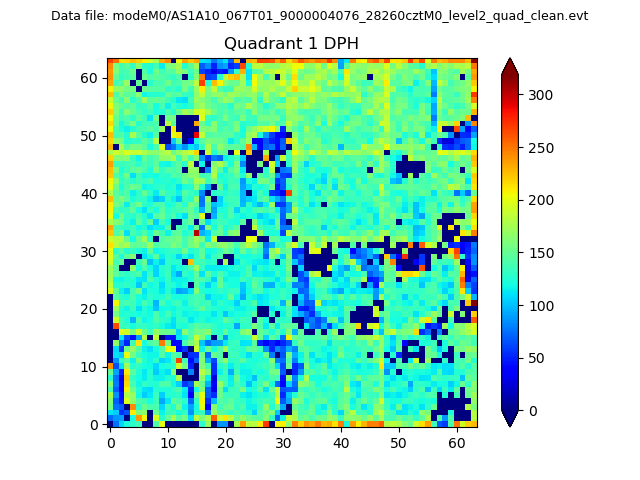 |
Quadrant B |
|---|---|---|---|
| Quadrant D | 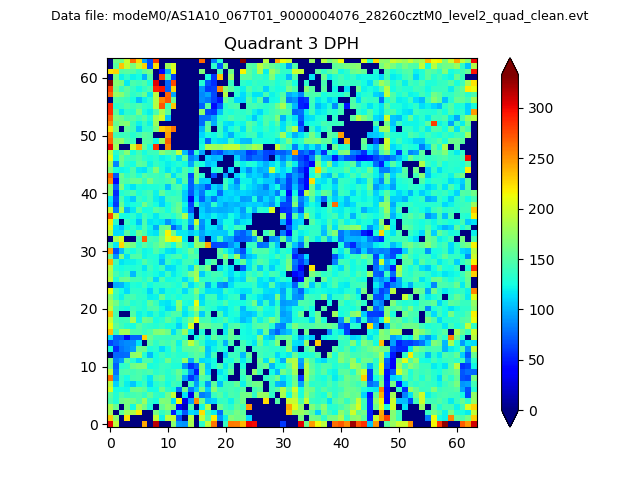 |
 |
Quadrant C |
| Plot type | Count rate plots | Images |
|---|---|---|
| Comparison with Poisson distribution Blue bars denote a histogram of data divided into 1 sec bins. Red curve is a Poisson curve with rate = median count rate of data. |
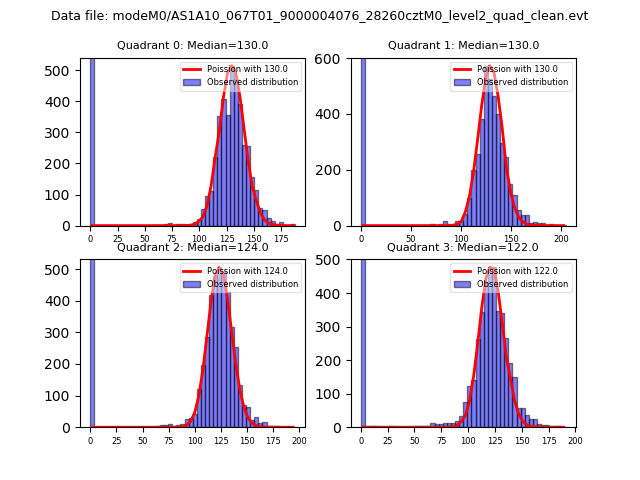 |
 |
| Quadrant-wise count rates Data is divided into 100 sec bins |
 |
|
| Module-wise count rates for Quadrant A Data is divided into 100 sec bins |
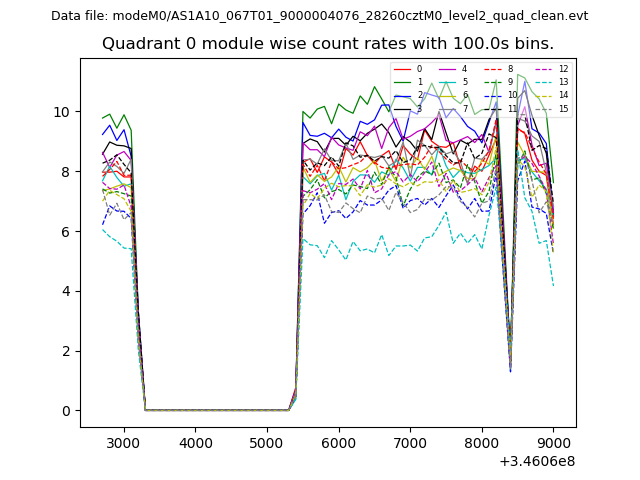 |
 |
| Module-wise count rates for Quadrant B Data is divided into 100 sec bins |
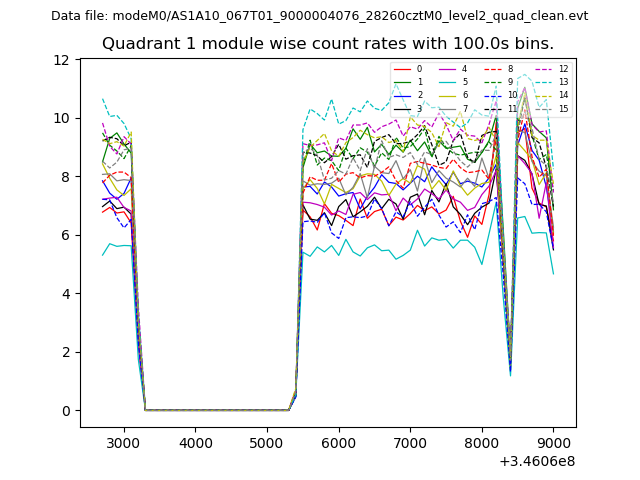 |
 |
| Module-wise count rates for Quadrant C Data is divided into 100 sec bins |
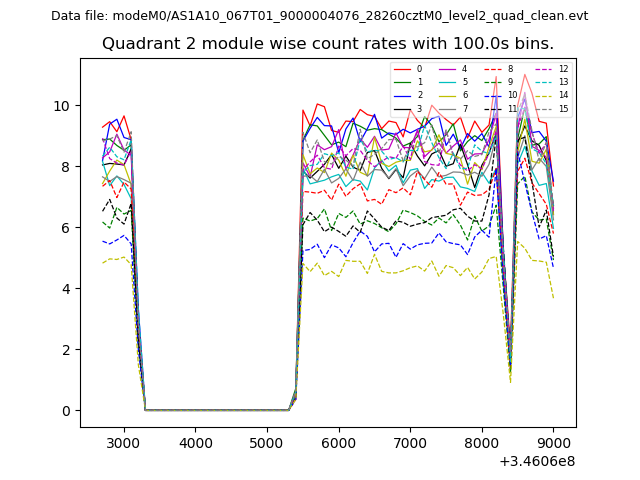 |
 |
| Module-wise count rates for Quadrant D Data is divided into 100 sec bins |
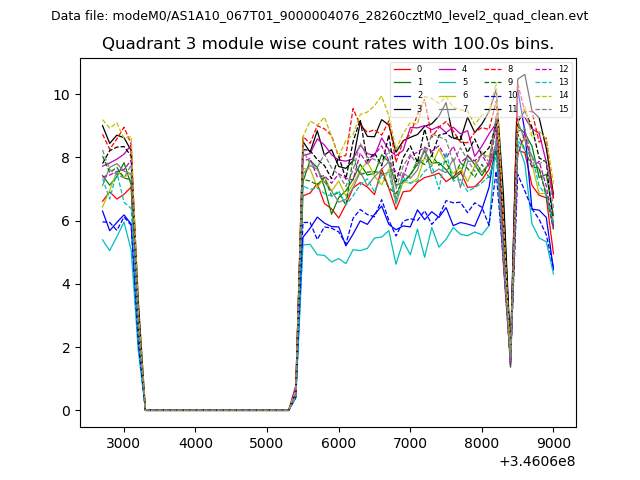 |
 |
| Parameter | Plot |
|---|---|
| CZT HV Monitor | 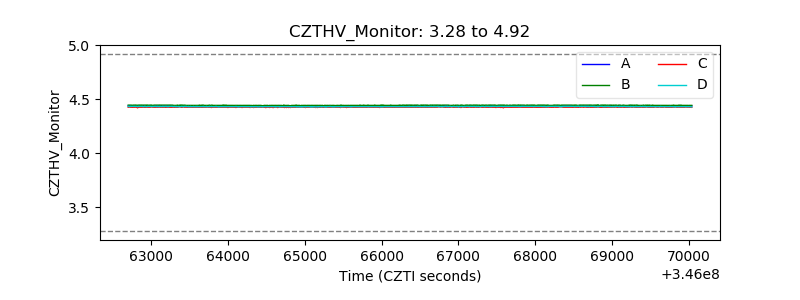 |
| D_VDD | 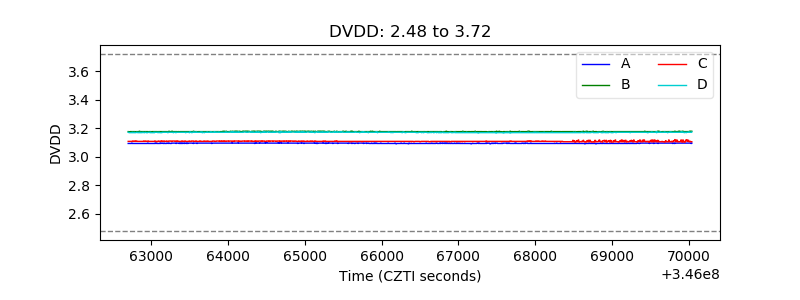 |
| Temperature 1 | 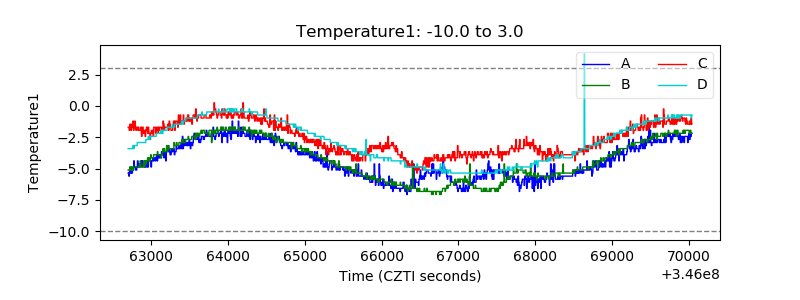 |
| Veto HV Monitor | 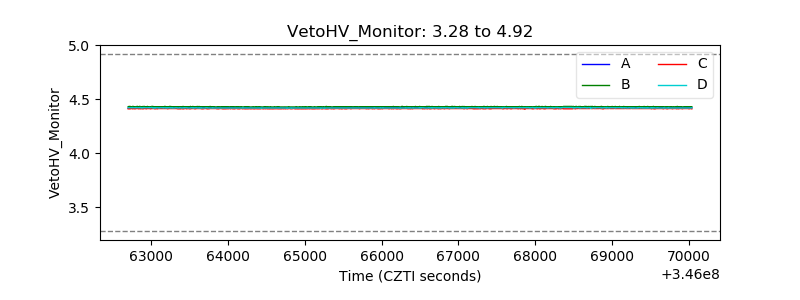 |
| Veto LLD | 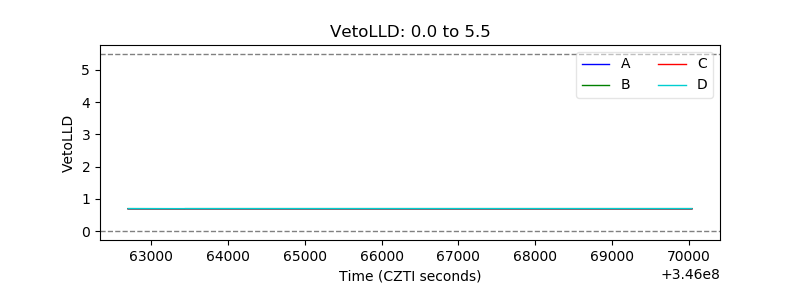 |
| Alpha Counter | 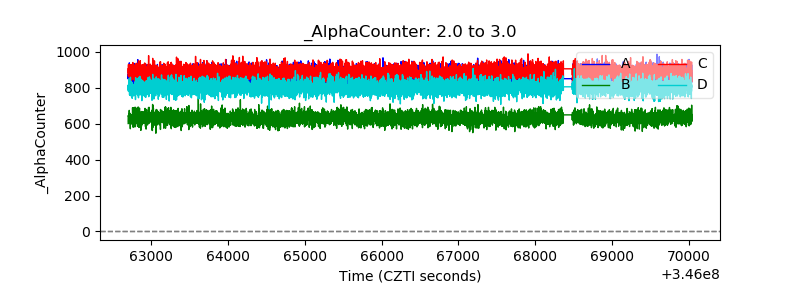 |
| _CPM_Rate | 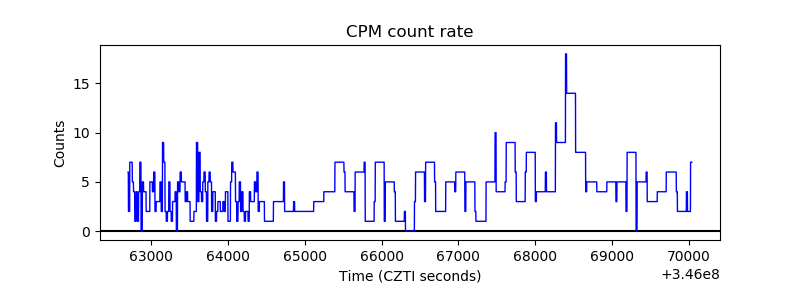 |
| CZT Counter | 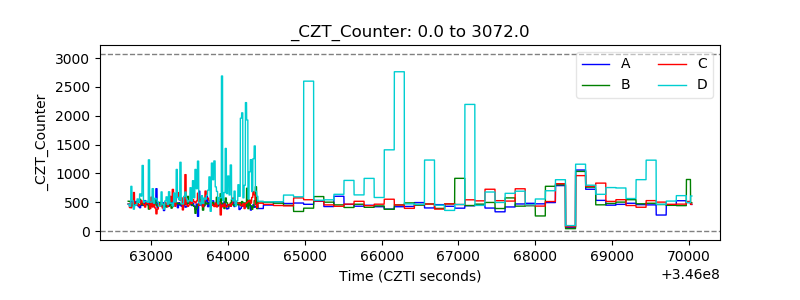 |
| +2.5 Volts monitor |  |
| +5 Volts monitor |  |
| _ROLL_ROT | 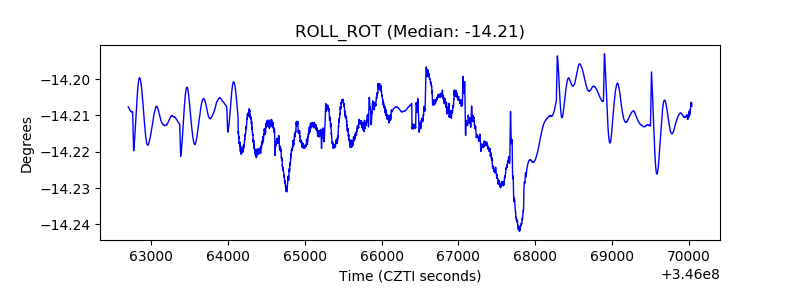 |
| _Roll_DEC | 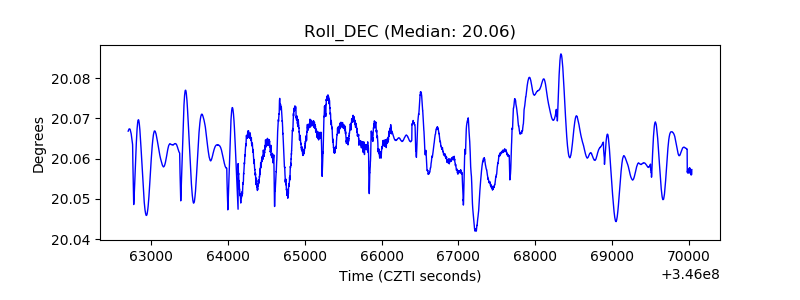 |
| _Roll_RA |  |
| Veto Counter | 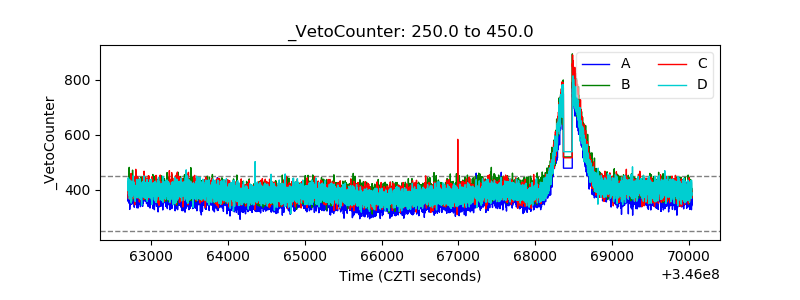 |