| Param | Original file | Final file |
|---|---|---|
| Filename | modeM0/AS1A10_067T01_9000004076_28261cztM0_level2.evt | modeM0/AS1A10_067T01_9000004076_28261cztM0_level2_quad_clean.evt |
| Size (bytes) | 383,797,440 | 55,920,960 |
| Size | 366.0 MB | 53.3 MB |
| Events in quadrant A | 2,316,383 | 346,630 |
| Events in quadrant B | 2,481,074 | 346,475 |
| Events in quadrant C | 2,465,898 | 330,057 |
| Events in quadrant D | 4,023,610 | 323,019 |
| Mode M0 | |||
|---|---|---|---|
| Quadrant | BADHDUFLAG | Total packets | Discarded packets |
| A | 0 | 10186 | 0 |
| B | 0 | 10567 | 0 |
| C | 0 | 10495 | 0 |
| D | 0 | 15394 | 0 |
| Quadrant | Total seconds | Saturated seconds | Saturation percentage |
|---|---|---|---|
| A | 4945 | 87 | 1.759353% |
| B | 4945 | 106 | 2.143579% |
| C | 4946 | 137 | 2.769915% |
| D | 4946 | 328 | 6.631622% |
Noise dominated data is calculated using 1-second bins in cleaned event files. If a bin has >2000 counts, and if more than 50% of those come from <1% of pixels, then it is considered to be noise-dominated and hence unusable.
| Quadrant | # 1 sec bins | Bins with >0 counts | Bins with >2000 counts | High rate bins dominated by noise | Noise dominated (total time) | Noise dominated (detector-on time) | Marked lightcurve |
|---|---|---|---|---|---|---|---|
| A | 4945 | 4945 | 0 | 0 | 0.00% | 0.00% | 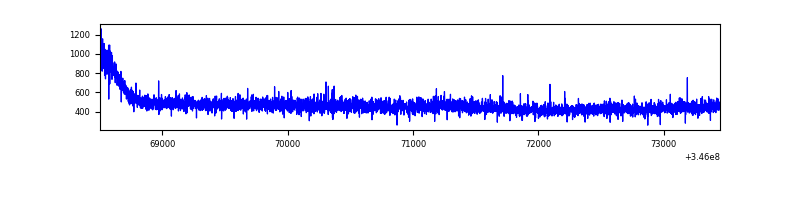 |
| B | 4945 | 4945 | 8 | 8 | 0.16% | 0.16% | 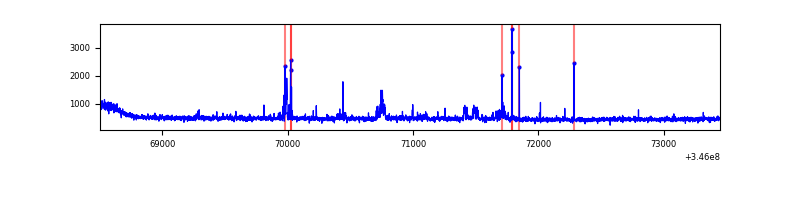 |
| C | 4946 | 4946 | 2 | 2 | 0.04% | 0.04% | 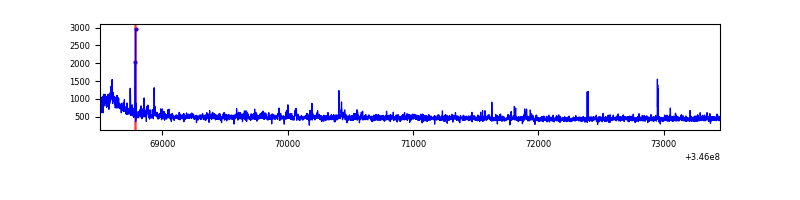 |
| D | 4946 | 4946 | 228 | 228 | 4.61% | 4.61% | 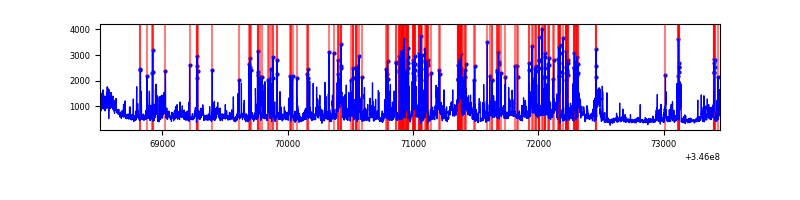 |
Top three noisy pixels from each quadrant. If the there are fewer than three noisy pixels in the level2.evt file, extra rows are filled as -1
| Pixel properties | Quadrant properties | ||||||
|---|---|---|---|---|---|---|---|
| Quadrant | DetID | PixID | Counts | Sigma | Mean | Median | Sigma |
| A | 13 | 254 | 7845 | 59.37 | 600 | 588 | 122.2 |
| A | 3 | 137 | 6092 | 45.03 | 600 | 588 | 122.2 |
| A | 0 | 226 | 5146 | 37.29 | 600 | 588 | 122.2 |
| B | 10 | 245 | 98104 | 833.0 | 591 | 574 | 117.1 |
| B | 10 | 246 | 34343 | 288.42 | 591 | 574 | 117.1 |
| B | 12 | 111 | 14429 | 118.33 | 591 | 574 | 117.1 |
| C | 3 | 233 | 120879 | 879.88 | 573 | 577 | 136.7 |
| C | 14 | 238 | 91582 | 665.6 | 573 | 577 | 136.7 |
| C | 8 | 128 | 7944 | 53.88 | 573 | 577 | 136.7 |
| D | 1 | 52 | 1200096 | 8572.88 | 573 | 556 | 139.9 |
| D | 8 | 195 | 265147 | 1890.98 | 573 | 556 | 139.9 |
| D | 2 | 250 | 168650 | 1201.34 | 573 | 556 | 139.9 |
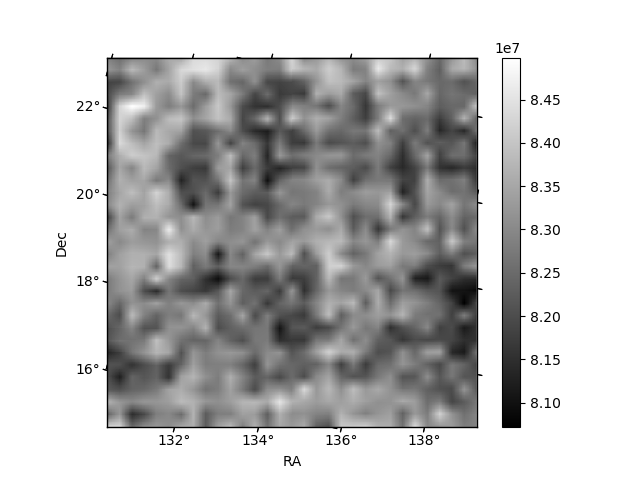
Histogram calculated using DETX and DETY for each event in the final _common_clean file
| Quadrant A | 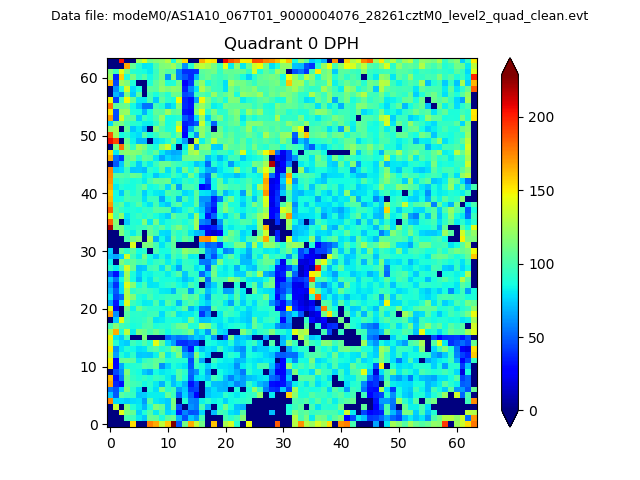 |
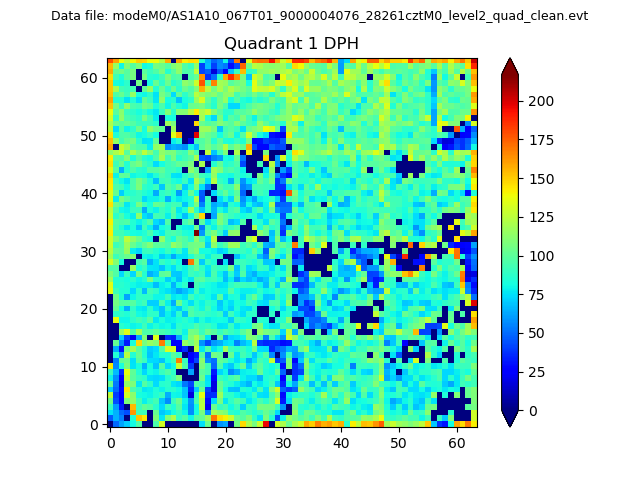 |
Quadrant B |
|---|---|---|---|
| Quadrant D | 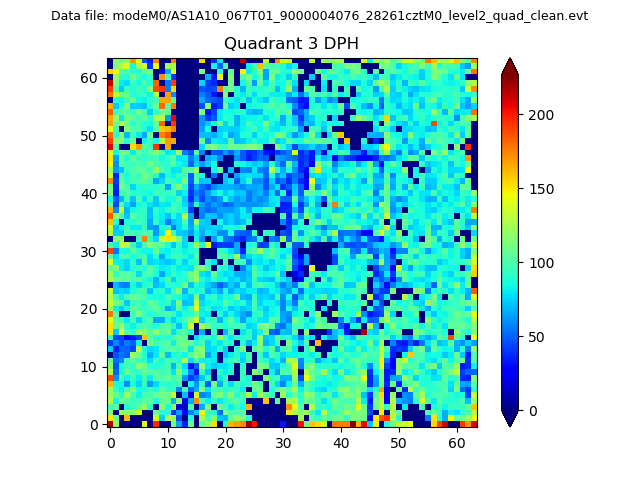 |
 |
Quadrant C |
| Plot type | Count rate plots | Images |
|---|---|---|
| Comparison with Poisson distribution Blue bars denote a histogram of data divided into 1 sec bins. Red curve is a Poisson curve with rate = median count rate of data. |
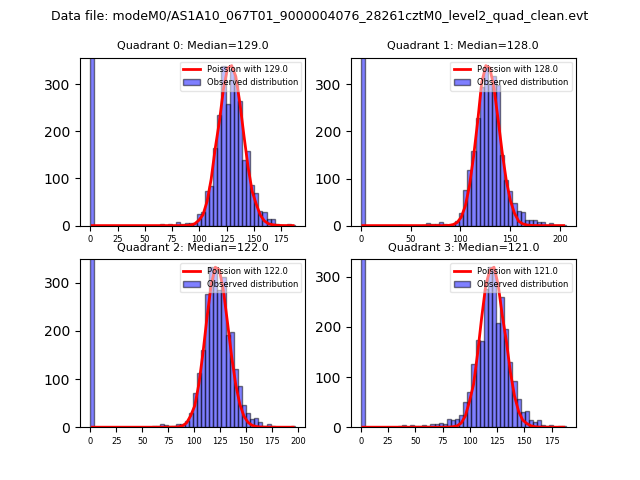 |
 |
| Quadrant-wise count rates Data is divided into 100 sec bins |
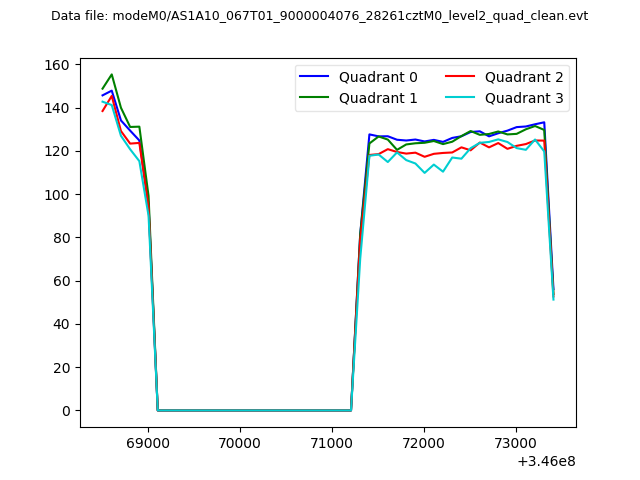 |
|
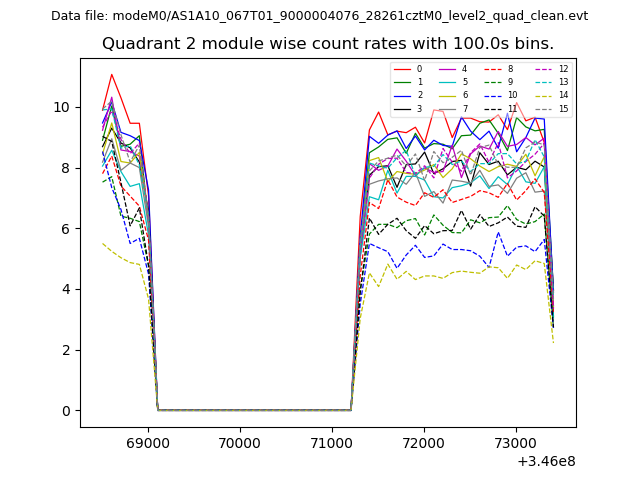
| Module-wise count rates for Quadrant A Data is divided into 100 sec bins |
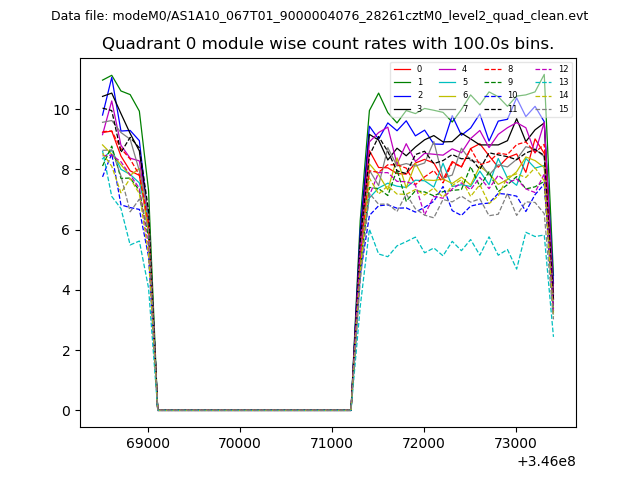 |
 |
| Module-wise count rates for Quadrant B Data is divided into 100 sec bins |
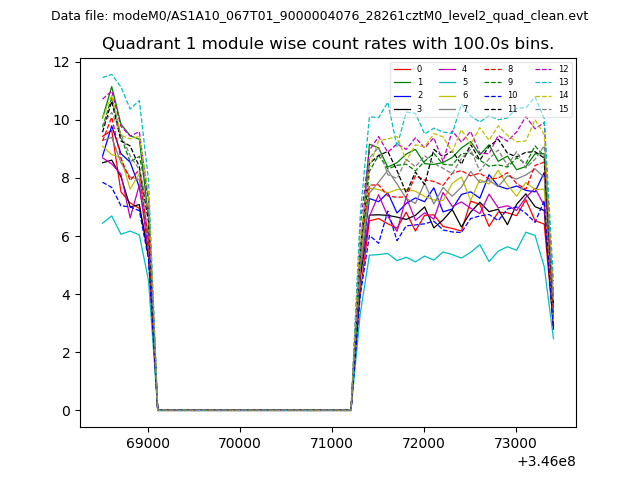 |
 |
| Module-wise count rates for Quadrant C Data is divided into 100 sec bins |
 |
 |
| Module-wise count rates for Quadrant D Data is divided into 100 sec bins |
 |
 |
| Parameter | Plot |
|---|---|
| CZT HV Monitor | 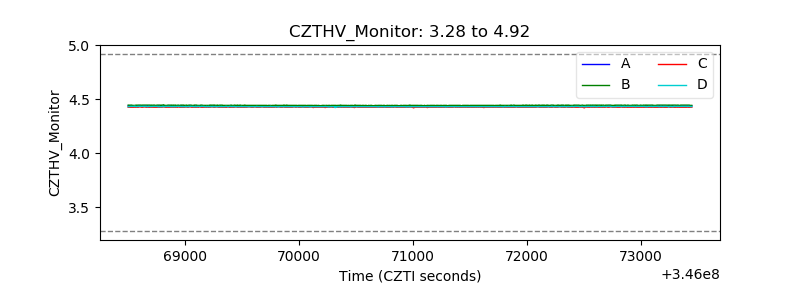 |
| D_VDD | 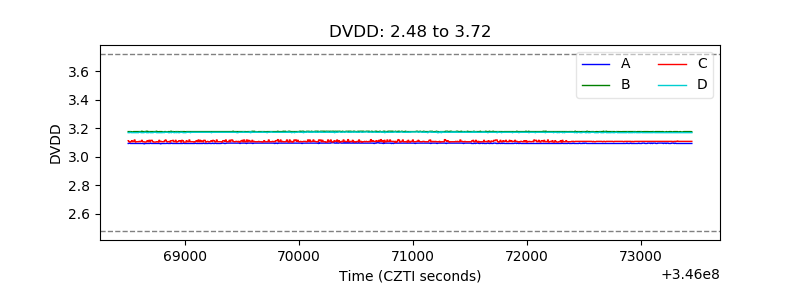 |
| Temperature 1 | 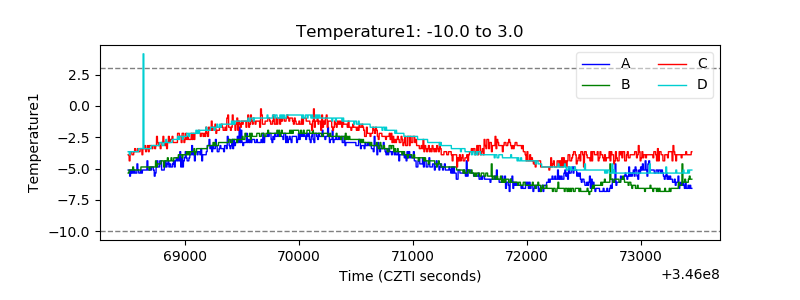 |
| Veto HV Monitor | 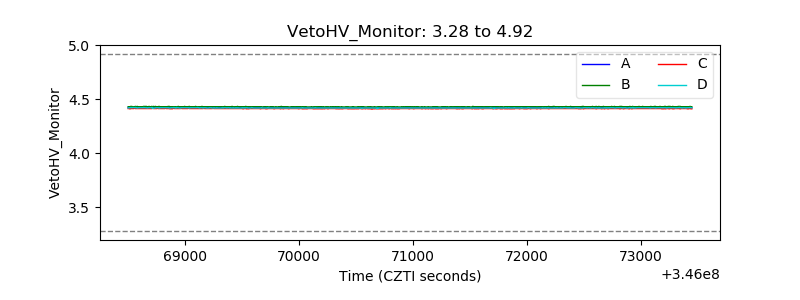 |
| Veto LLD | 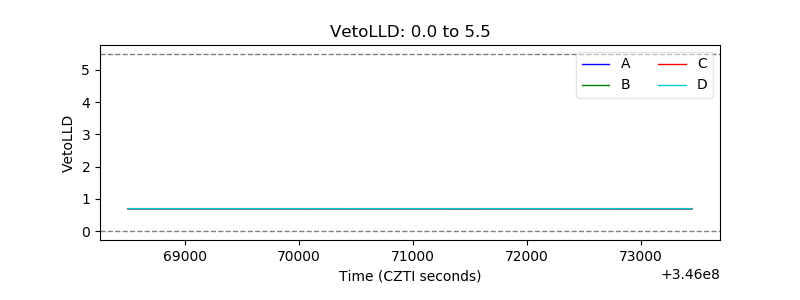 |
| Alpha Counter | 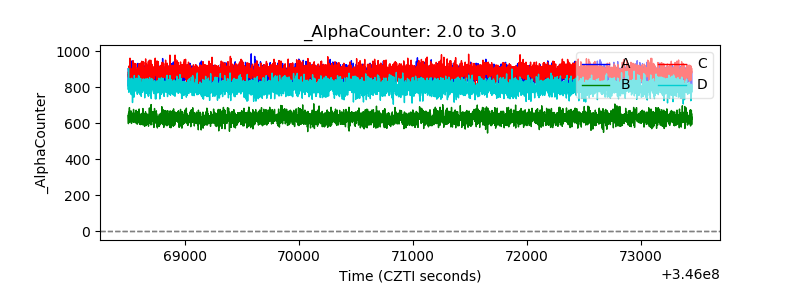 |
| _CPM_Rate | 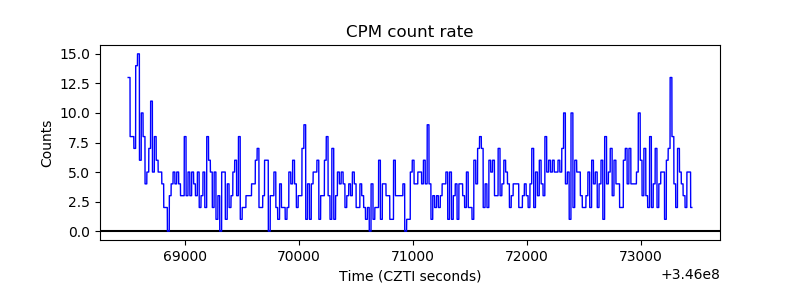 |
| CZT Counter |  |
| +2.5 Volts monitor |  |
| +5 Volts monitor | 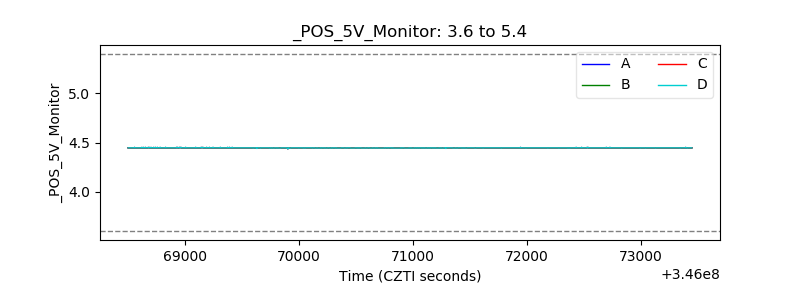 |
| _ROLL_ROT |  |
| _Roll_DEC |  |
| _Roll_RA |  |
| Veto Counter |  |