| Param | Original file | Final file |
|---|---|---|
| Filename | modeM0/AS1A10_067T01_9000004076_28263cztM0_level2.evt | modeM0/AS1A10_067T01_9000004076_28263cztM0_level2_quad_clean.evt |
| Size (bytes) | 1,264,982,400 | 192,381,120 |
| Size | 1.2 GB | 183.5 MB |
| Events in quadrant A | 7,167,503 | 1,236,620 |
| Events in quadrant B | 8,320,638 | 1,219,547 |
| Events in quadrant C | 7,710,724 | 1,175,207 |
| Events in quadrant D | 14,085,839 | 1,146,874 |
| Mode M0 | |||
|---|---|---|---|
| Quadrant | BADHDUFLAG | Total packets | Discarded packets |
| A | 0 | 31101 | 0 |
| B | 0 | 34513 | 0 |
| C | 0 | 32484 | 0 |
| D | 0 | 52287 | 0 |
| Mode M9 | |||
|---|---|---|---|
| Quadrant | BADHDUFLAG | Total packets | Discarded packets |
| A | 0 | 17 | 0 |
| B | 0 | 17 | 0 |
| C | 0 | 17 | 0 |
| D | 0 | 17 | 0 |
| Quadrant | Total seconds | Saturated seconds | Saturation percentage |
|---|---|---|---|
| A | 15180 | 135 | 0.889328% |
| B | 15181 | 406 | 2.674396% |
| C | 15181 | 286 | 1.883934% |
| D | 15181 | 1701 | 11.204795% |
Noise dominated data is calculated using 1-second bins in cleaned event files. If a bin has >2000 counts, and if more than 50% of those come from <1% of pixels, then it is considered to be noise-dominated and hence unusable.
| Quadrant | # 1 sec bins | Bins with >0 counts | Bins with >2000 counts | High rate bins dominated by noise | Noise dominated (total time) | Noise dominated (detector-on time) | Marked lightcurve |
|---|---|---|---|---|---|---|---|
| A | 16990 | 15181 | 0 | 0 | 0.00% | 0.00% | 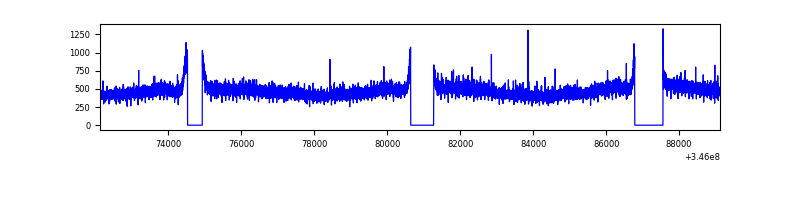 |
| B | 16991 | 15182 | 146 | 146 | 0.86% | 0.96% | 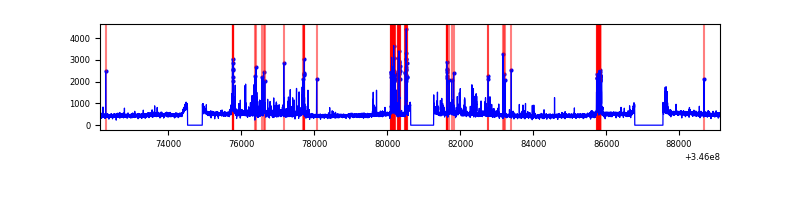 |
| C | 16991 | 15181 | 12 | 12 | 0.07% | 0.08% | 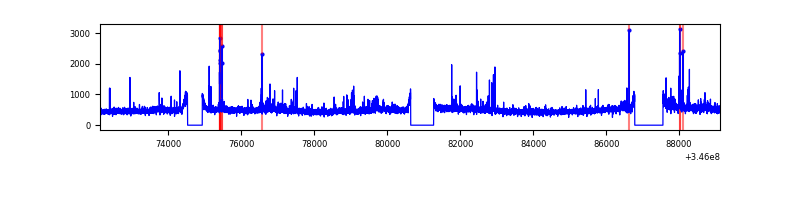 |
| D | 16991 | 15181 | 1420 | 1420 | 8.36% | 9.35% | 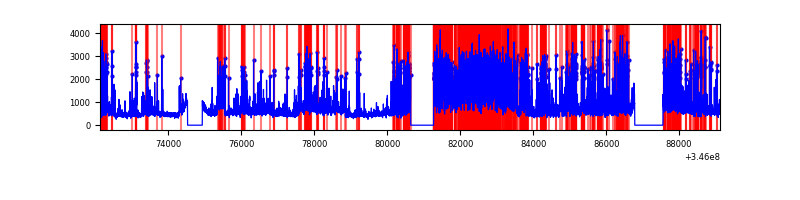 |
Top three noisy pixels from each quadrant. If the there are fewer than three noisy pixels in the level2.evt file, extra rows are filled as -1
| Pixel properties | Quadrant properties | ||||||
|---|---|---|---|---|---|---|---|
| Quadrant | DetID | PixID | Counts | Sigma | Mean | Median | Sigma |
| A | 13 | 254 | 24174 | 59.99 | 1853 | 1816 | 372.7 |
| A | 3 | 137 | 18745 | 45.42 | 1853 | 1816 | 372.7 |
| A | 0 | 226 | 15853 | 37.66 | 1853 | 1816 | 372.7 |
| B | 10 | 245 | 434847 | 1231.87 | 1822 | 1776 | 351.6 |
| B | 10 | 246 | 360202 | 1019.54 | 1822 | 1776 | 351.6 |
| B | 15 | 222 | 156137 | 439.08 | 1822 | 1776 | 351.6 |
| C | 3 | 233 | 526967 | 1264.64 | 1768 | 1780 | 415.3 |
| C | 14 | 238 | 281728 | 674.11 | 1768 | 1780 | 415.3 |
| C | 13 | 61 | 12173 | 25.02 | 1768 | 1780 | 415.3 |
| D | 1 | 52 | 5209527 | 12539.91 | 1728 | 1682 | 415.3 |
| D | 8 | 195 | 1627280 | 3914.26 | 1728 | 1682 | 415.3 |
| D | 2 | 250 | 308989 | 739.96 | 1728 | 1682 | 415.3 |
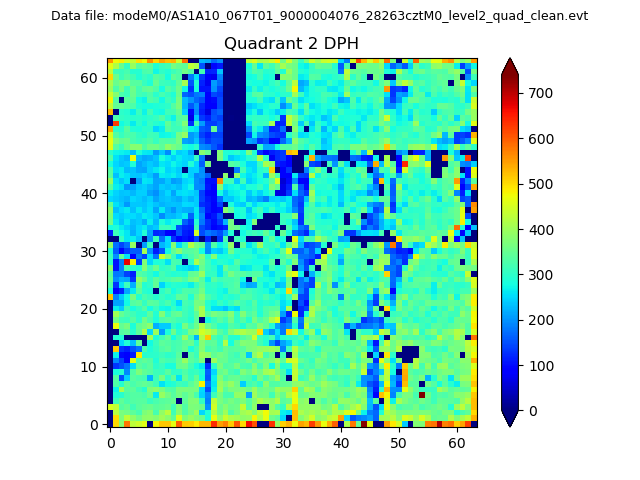
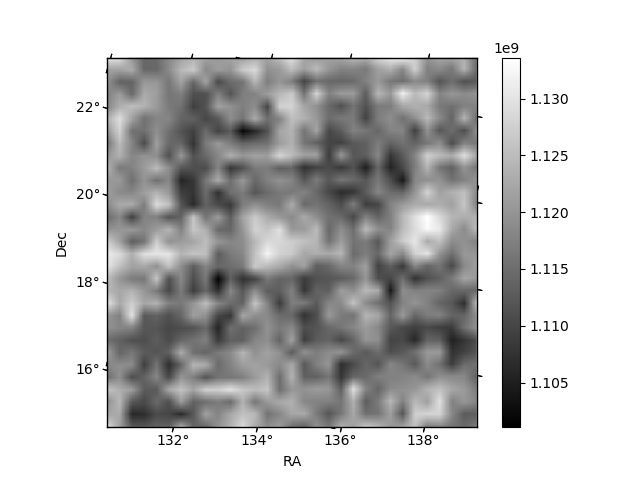
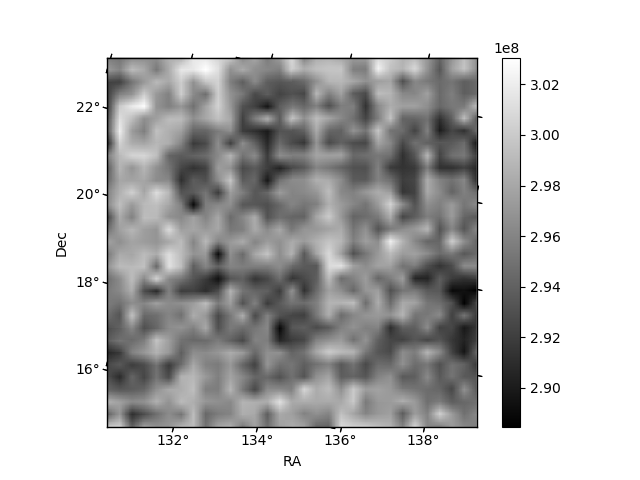
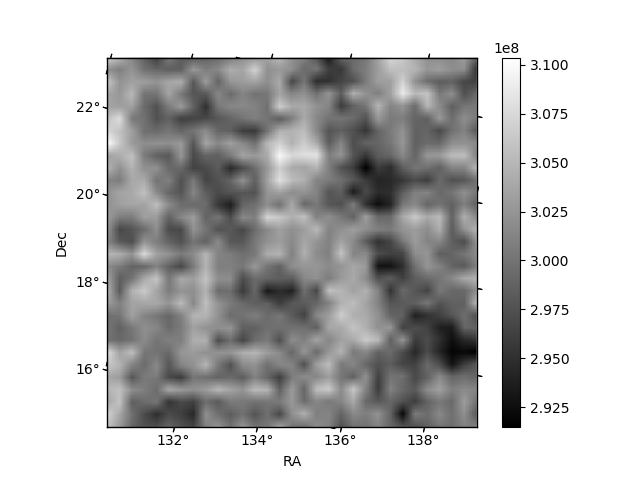
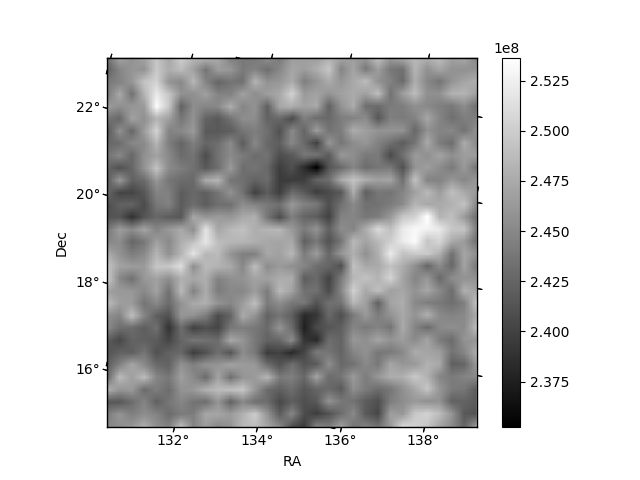
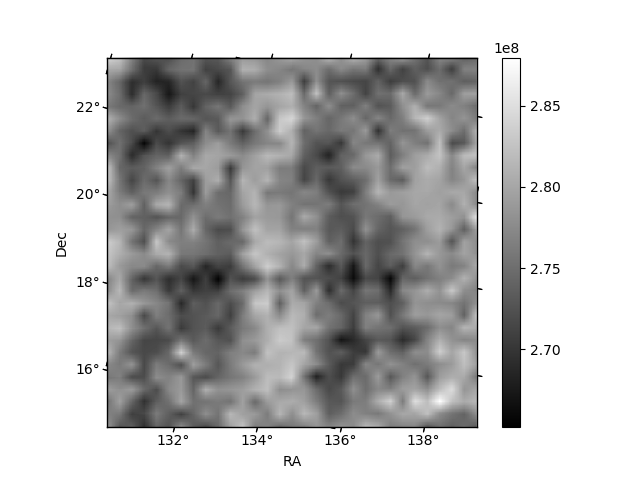
Histogram calculated using DETX and DETY for each event in the final _common_clean file
| Quadrant A | 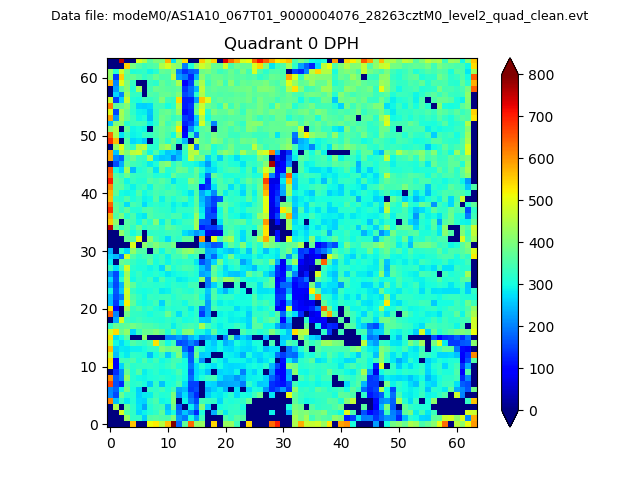 |
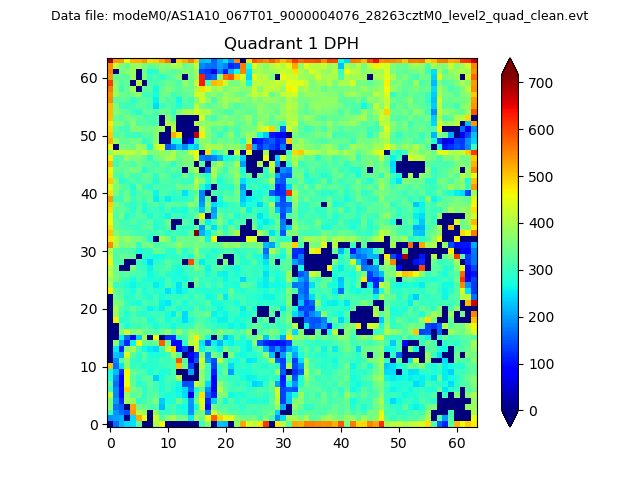 |
Quadrant B |
|---|---|---|---|
| Quadrant D | 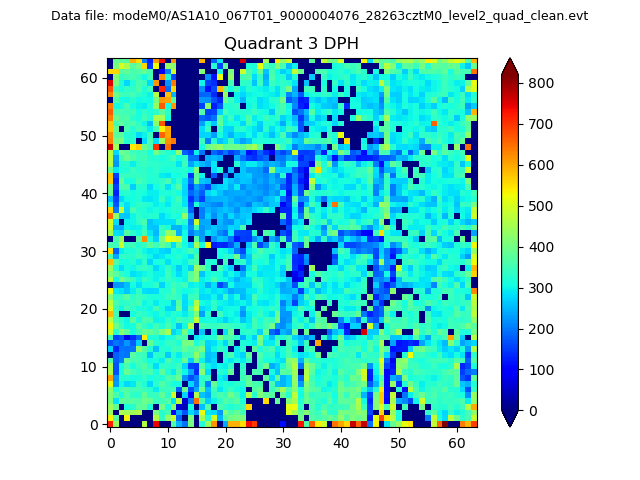 |
 |
Quadrant C |
| Plot type | Count rate plots | Images |
|---|---|---|
| Comparison with Poisson distribution Blue bars denote a histogram of data divided into 1 sec bins. Red curve is a Poisson curve with rate = median count rate of data. |
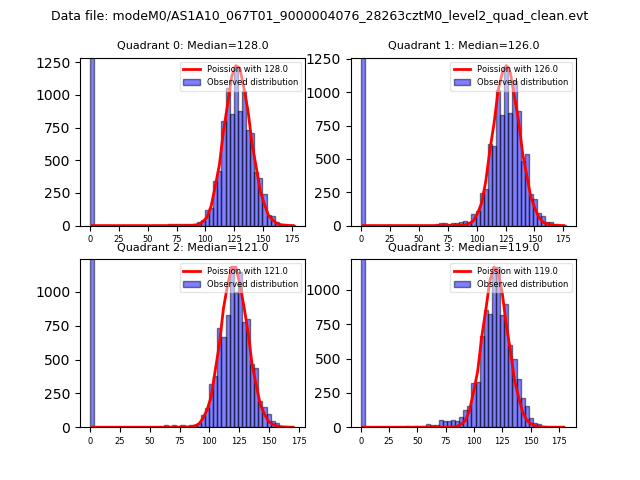 |
 |
| Quadrant-wise count rates Data is divided into 100 sec bins |
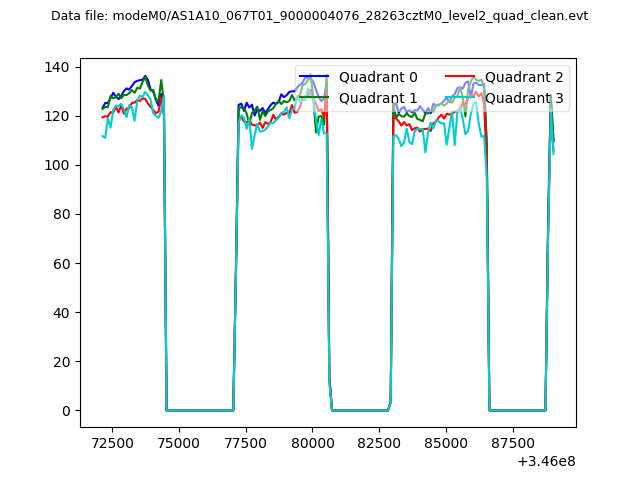 |
|
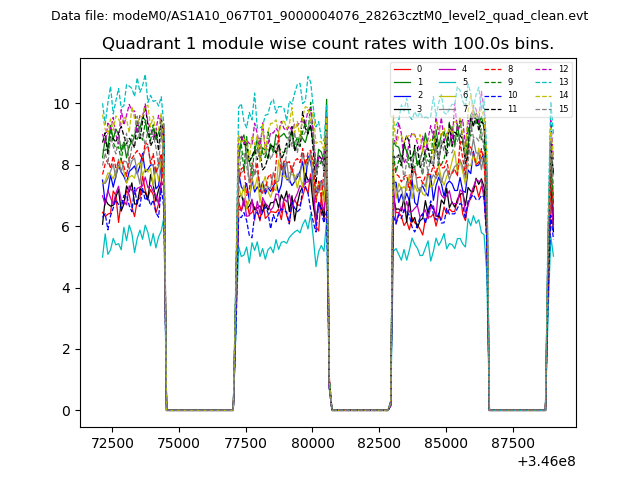
| Module-wise count rates for Quadrant A Data is divided into 100 sec bins |
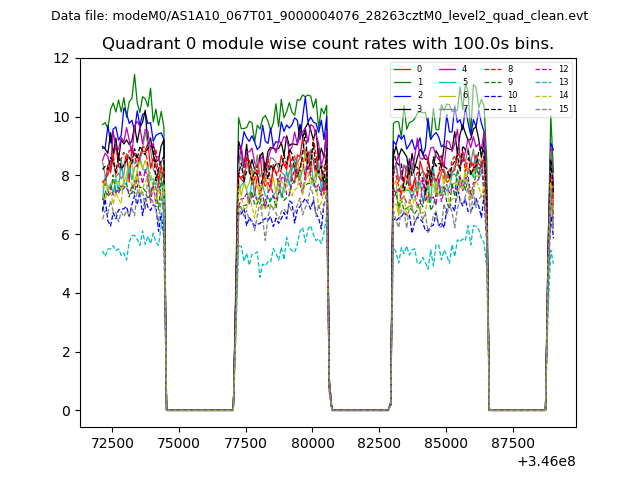 |
 |
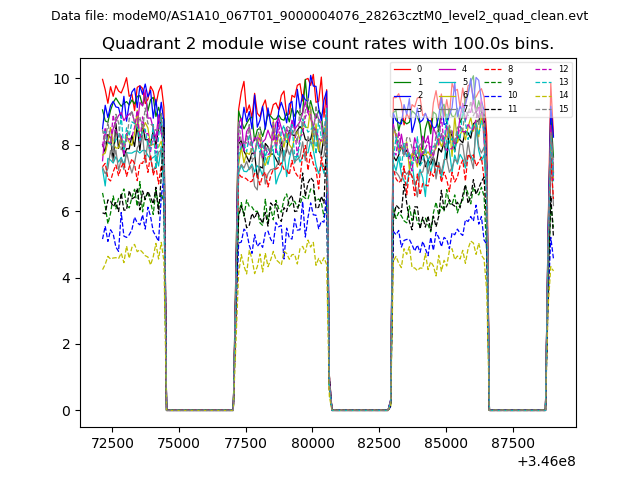
| Module-wise count rates for Quadrant B Data is divided into 100 sec bins |
 |
 |
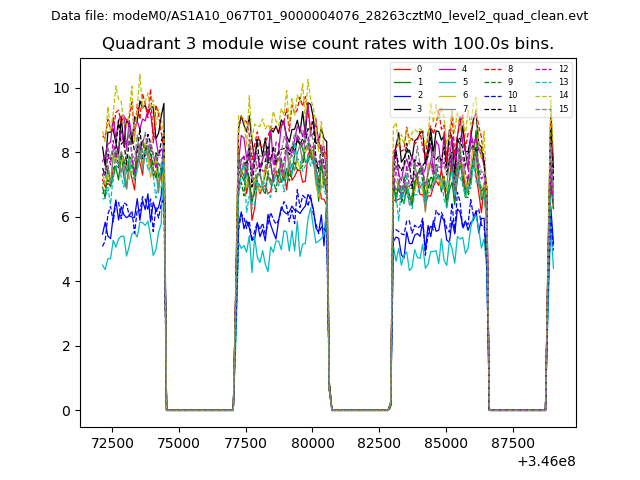
| Module-wise count rates for Quadrant C Data is divided into 100 sec bins |
 |
 |
| Module-wise count rates for Quadrant D Data is divided into 100 sec bins |
 |
 |
| Parameter | Plot |
|---|---|
| CZT HV Monitor | 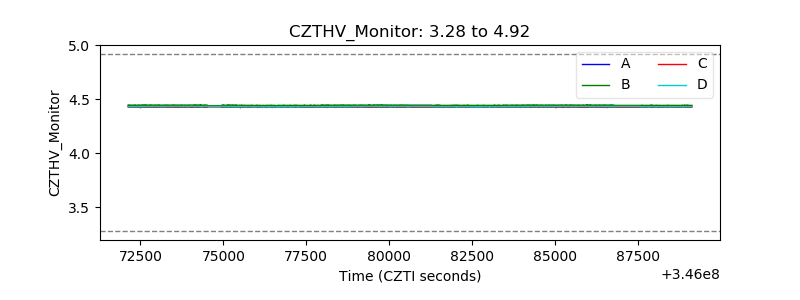 |
| D_VDD | 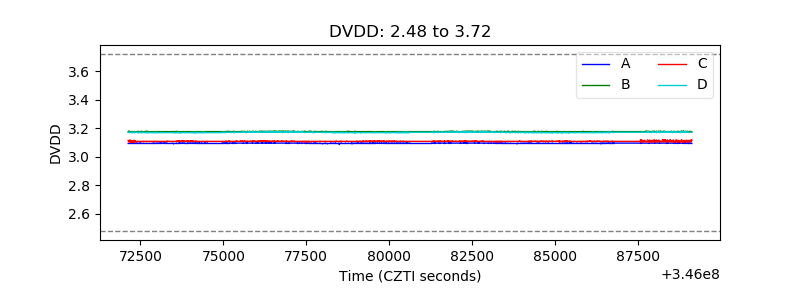 |
| Temperature 1 | 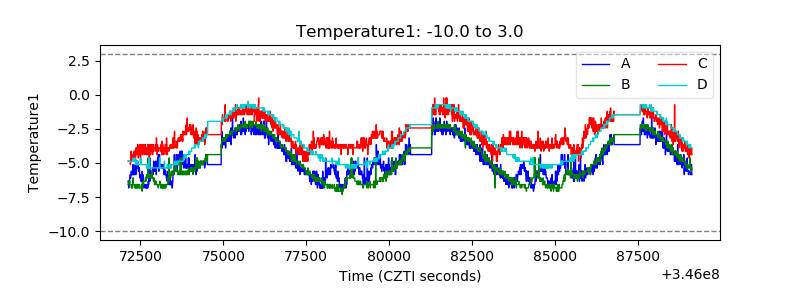 |
| Veto HV Monitor | 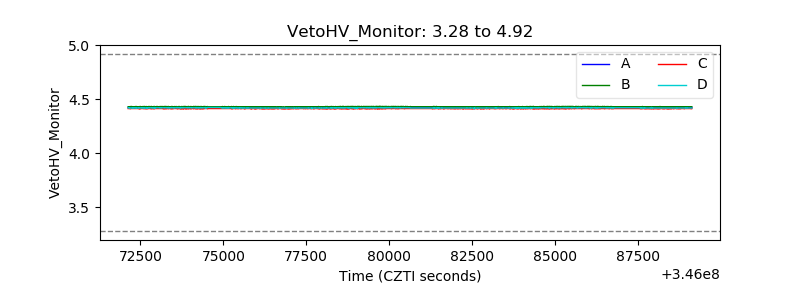 |
| Veto LLD | 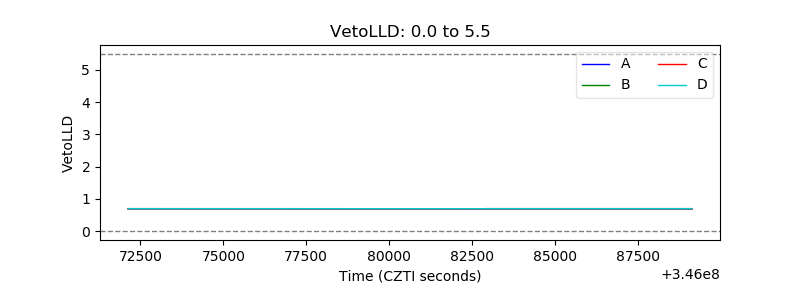 |
| Alpha Counter | 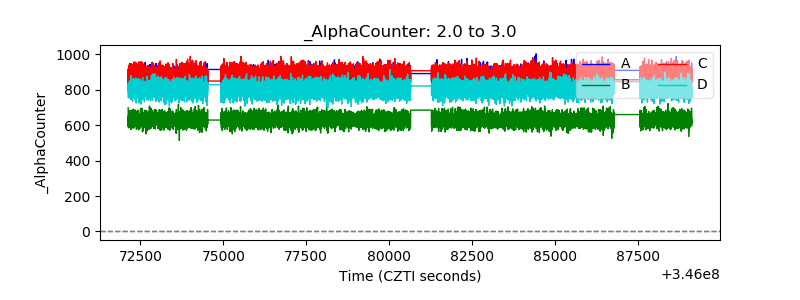 |
| _CPM_Rate | 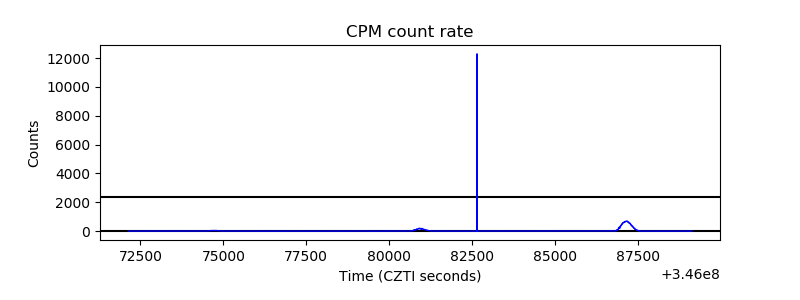 |
| CZT Counter | 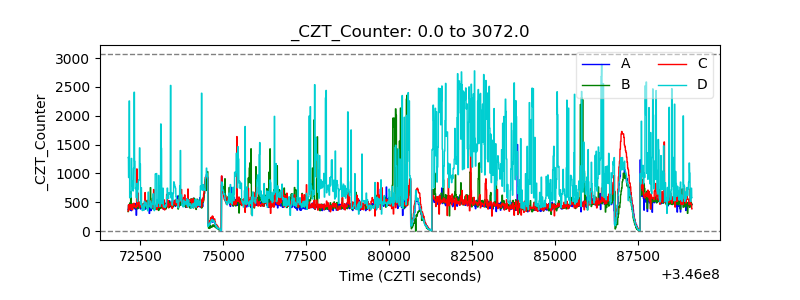 |
| +2.5 Volts monitor | 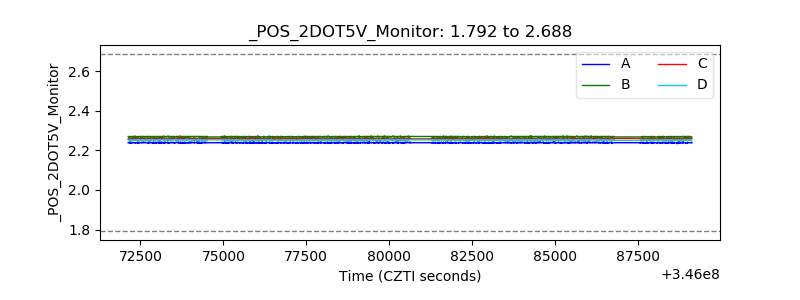 |
| +5 Volts monitor |  |
| _ROLL_ROT | 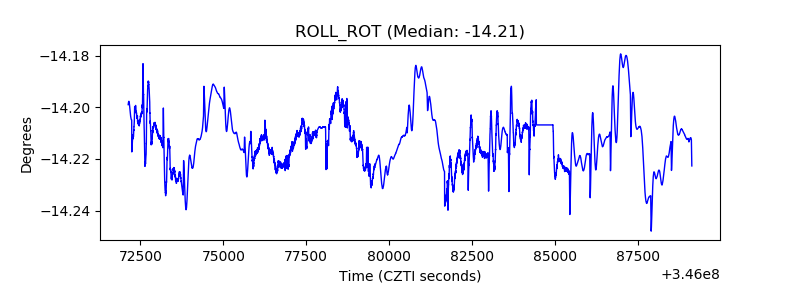 |
| _Roll_DEC | 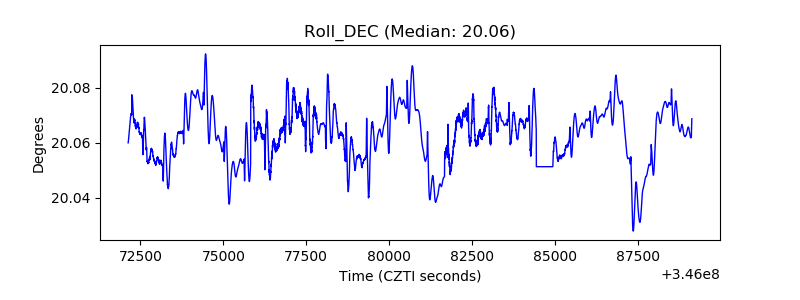 |
| _Roll_RA | 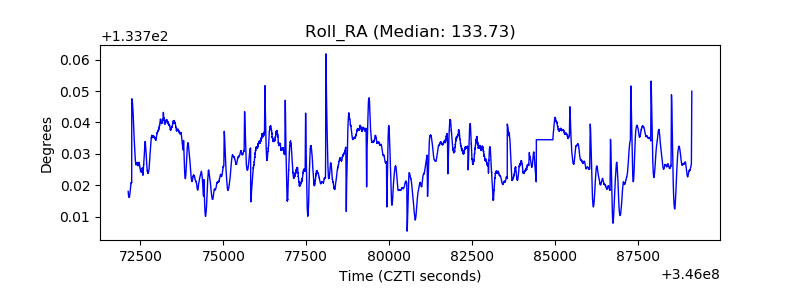 |
| Veto Counter | 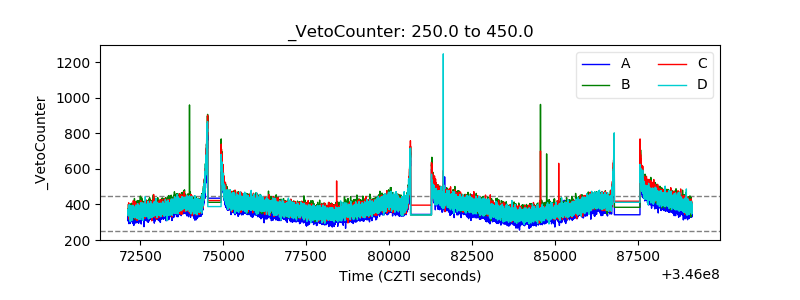 |