| Param | Original file | Final file |
|---|---|---|
| Filename | modeM0/AS1A10_067T01_9000004076_28264cztM0_level2.evt | modeM0/AS1A10_067T01_9000004076_28264cztM0_level2_quad_clean.evt |
| Size (bytes) | 572,641,920 | 85,605,120 |
| Size | 546.1 MB | 81.6 MB |
| Events in quadrant A | 3,416,056 | 540,283 |
| Events in quadrant B | 3,568,510 | 538,082 |
| Events in quadrant C | 3,800,421 | 513,784 |
| Events in quadrant D | 6,079,932 | 509,331 |
| Mode M0 | |||
|---|---|---|---|
| Quadrant | BADHDUFLAG | Total packets | Discarded packets |
| A | 0 | 14683 | 0 |
| B | 0 | 15123 | 0 |
| C | 0 | 15742 | 0 |
| D | 0 | 22951 | 0 |
| Mode M9 | |||
|---|---|---|---|
| Quadrant | BADHDUFLAG | Total packets | Discarded packets |
| A | 0 | 16 | 0 |
| B | 0 | 16 | 0 |
| C | 0 | 16 | 0 |
| D | 0 | 16 | 0 |
| Quadrant | Total seconds | Saturated seconds | Saturation percentage |
|---|---|---|---|
| A | 7042 | 73 | 1.036637% |
| B | 7043 | 102 | 1.448246% |
| C | 7043 | 154 | 2.186568% |
| D | 7042 | 626 | 8.889520% |
Noise dominated data is calculated using 1-second bins in cleaned event files. If a bin has >2000 counts, and if more than 50% of those come from <1% of pixels, then it is considered to be noise-dominated and hence unusable.
| Quadrant | # 1 sec bins | Bins with >0 counts | Bins with >2000 counts | High rate bins dominated by noise | Noise dominated (total time) | Noise dominated (detector-on time) | Marked lightcurve |
|---|---|---|---|---|---|---|---|
| A | 8753 | 7043 | 0 | 0 | 0.00% | 0.00% | 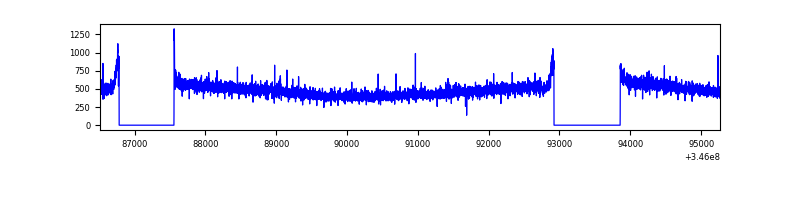 |
| B | 8754 | 7044 | 10 | 10 | 0.11% | 0.14% | 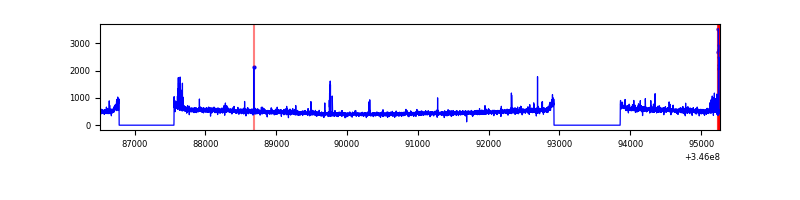 |
| C | 8754 | 7044 | 6 | 6 | 0.07% | 0.09% | 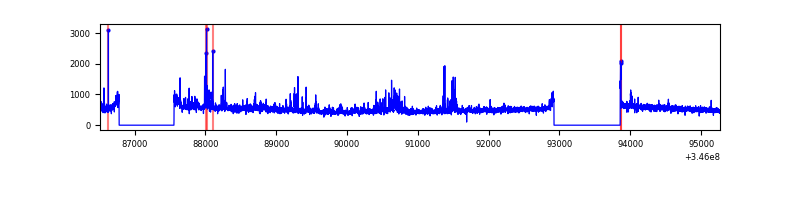 |
| D | 8753 | 7043 | 419 | 419 | 4.79% | 5.95% | 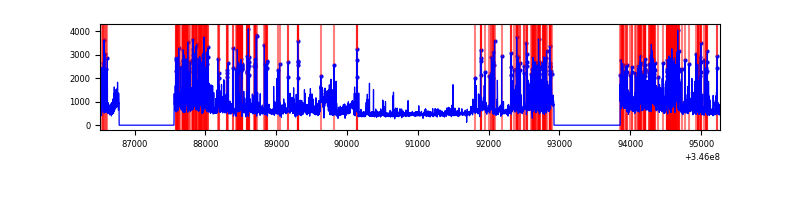 |
Top three noisy pixels from each quadrant. If the there are fewer than three noisy pixels in the level2.evt file, extra rows are filled as -1
| Pixel properties | Quadrant properties | ||||||
|---|---|---|---|---|---|---|---|
| Quadrant | DetID | PixID | Counts | Sigma | Mean | Median | Sigma |
| A | 13 | 254 | 11230 | 57.91 | 883 | 865 | 179.0 |
| A | 3 | 137 | 8942 | 45.13 | 883 | 865 | 179.0 |
| A | 0 | 226 | 7611 | 37.69 | 883 | 865 | 179.0 |
| B | 10 | 245 | 94635 | 554.18 | 872 | 849 | 169.2 |
| B | 0 | 230 | 26726 | 152.91 | 872 | 849 | 169.2 |
| B | 12 | 111 | 21255 | 120.58 | 872 | 849 | 169.2 |
| C | 3 | 233 | 361134 | 1812.5 | 845 | 851 | 198.8 |
| C | 14 | 238 | 135957 | 679.69 | 845 | 851 | 198.8 |
| C | 13 | 61 | 5700 | 24.39 | 845 | 851 | 198.8 |
| D | 1 | 52 | 2218772 | 11225.96 | 825 | 802 | 197.6 |
| D | 8 | 195 | 383421 | 1936.58 | 825 | 802 | 197.6 |
| D | 2 | 250 | 151416 | 762.31 | 825 | 802 | 197.6 |
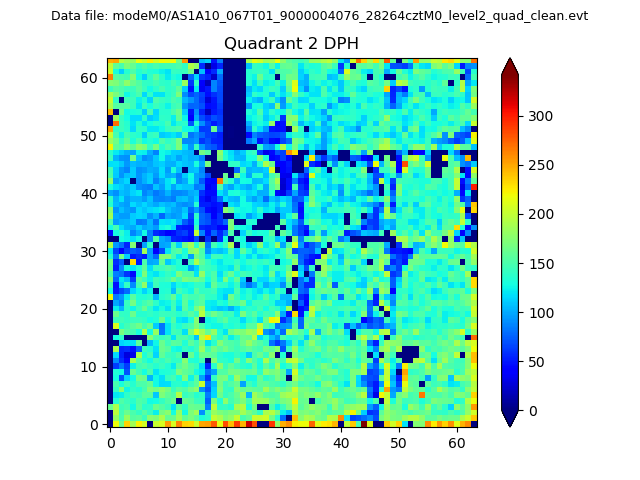
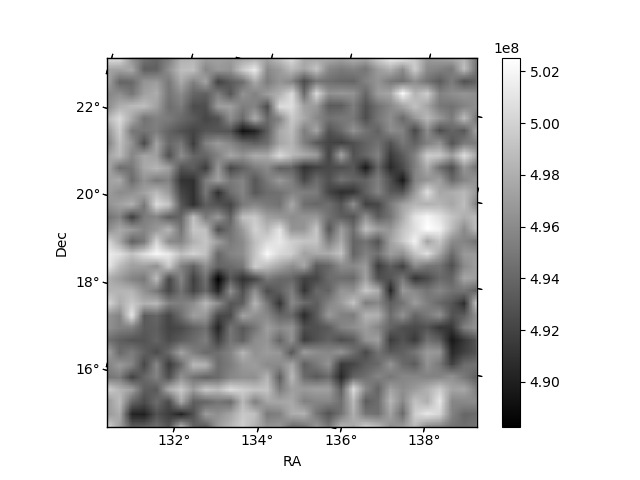
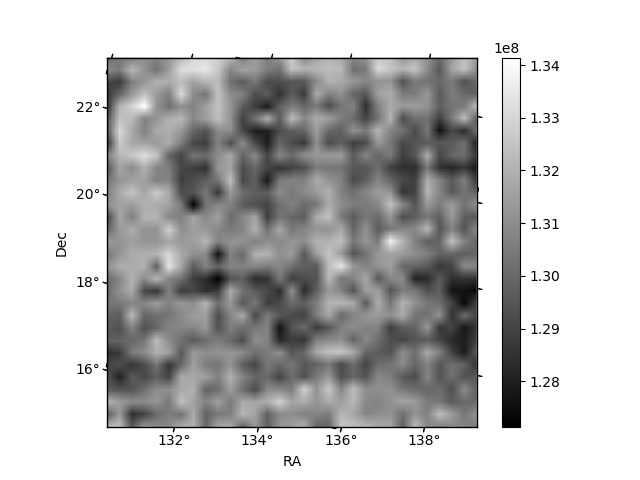
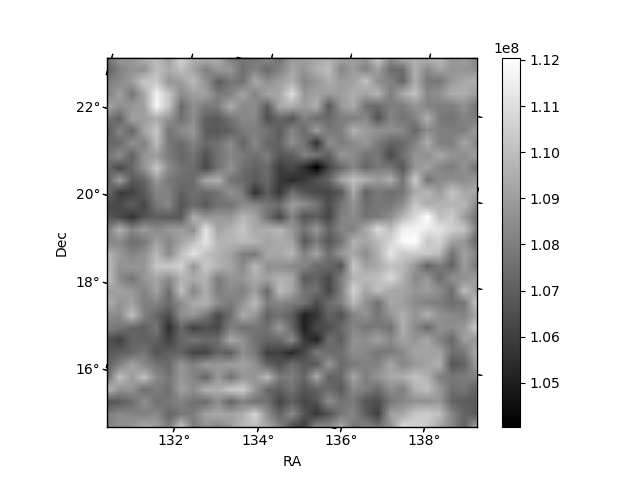
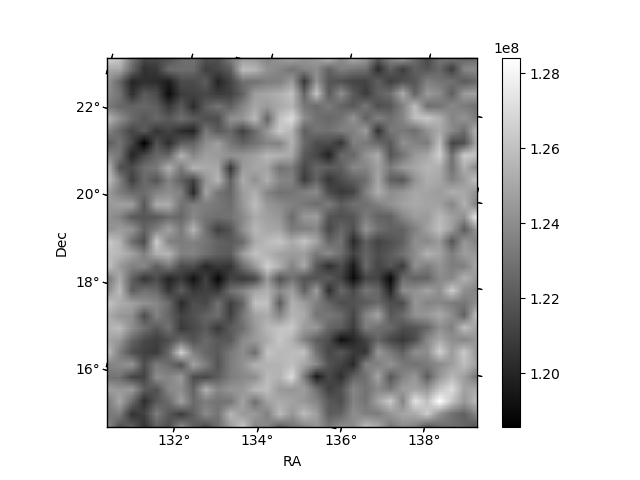
Histogram calculated using DETX and DETY for each event in the final _common_clean file
| Quadrant A | 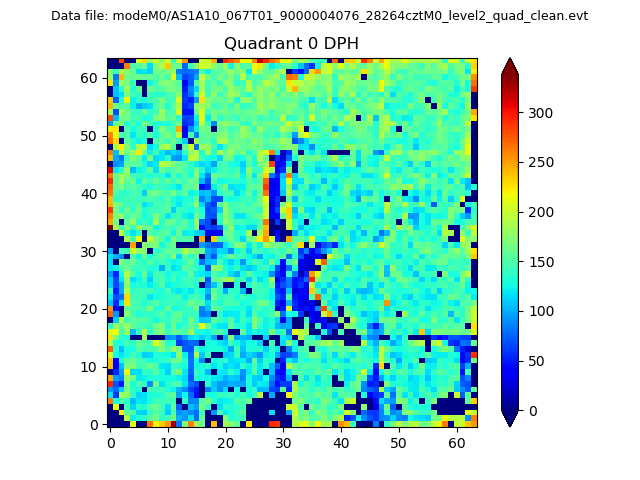 |
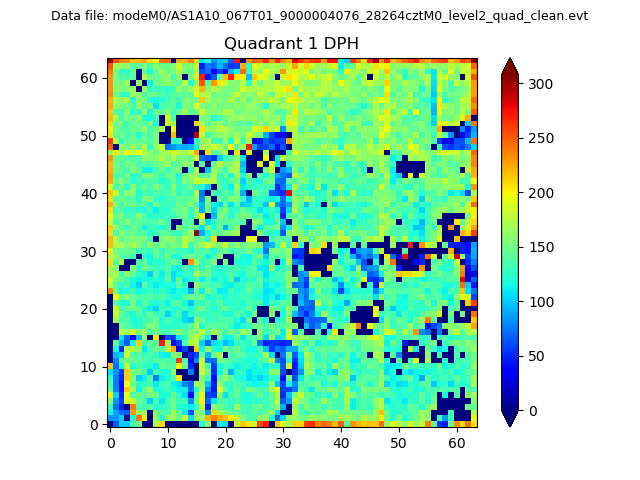 |
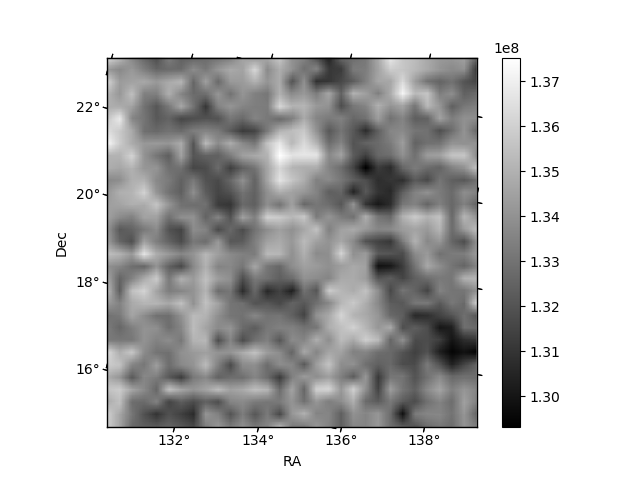
Quadrant B |
|---|---|---|---|
| Quadrant D | 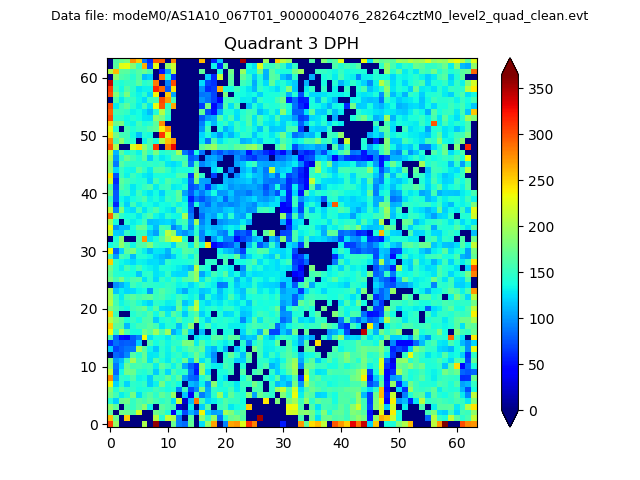 |
 |
Quadrant C |
| Plot type | Count rate plots | Images |
|---|---|---|
| Comparison with Poisson distribution Blue bars denote a histogram of data divided into 1 sec bins. Red curve is a Poisson curve with rate = median count rate of data. |
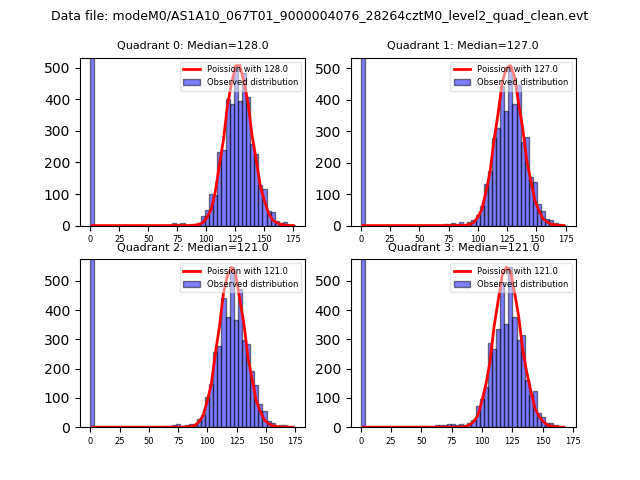 |
 |
| Quadrant-wise count rates Data is divided into 100 sec bins |
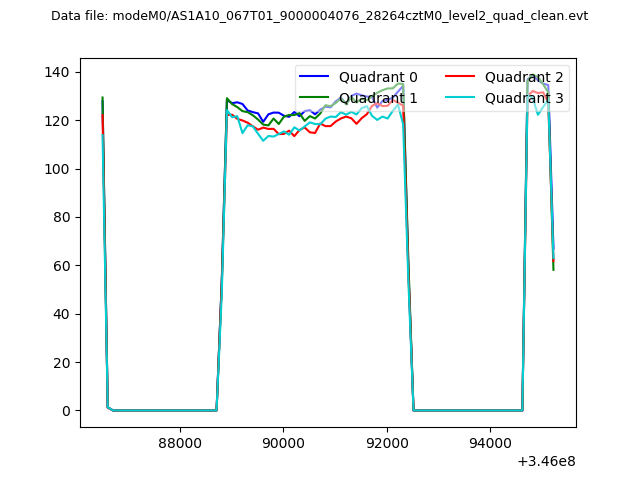 |
|
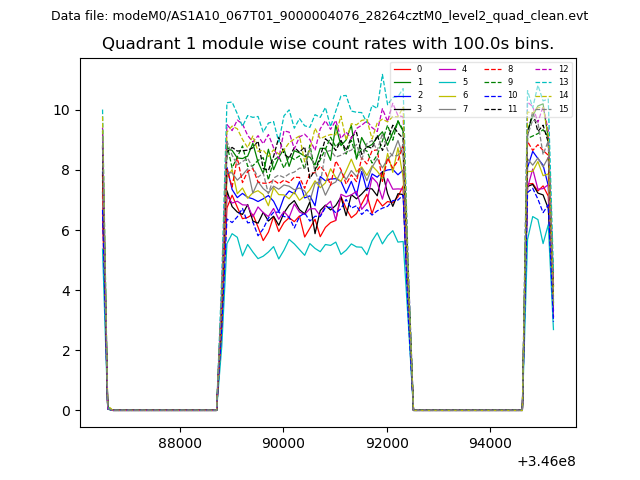
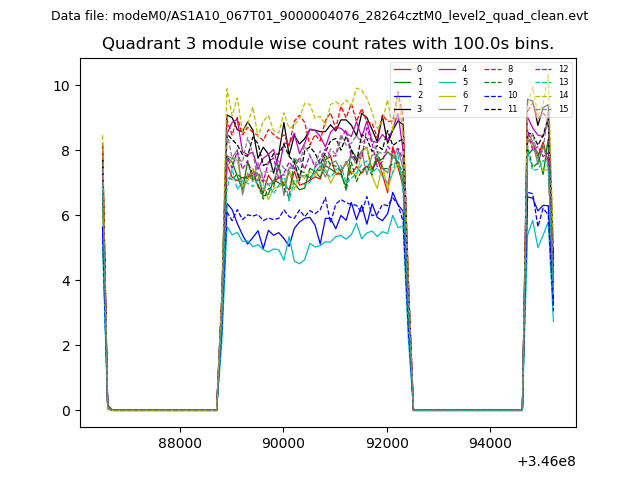
| Module-wise count rates for Quadrant A Data is divided into 100 sec bins |
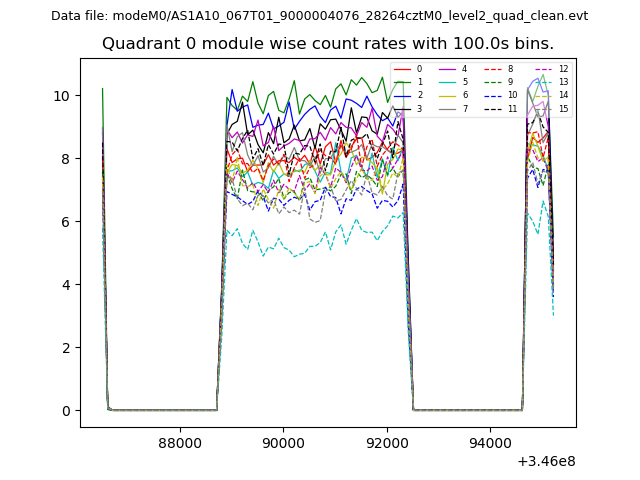 |
 |
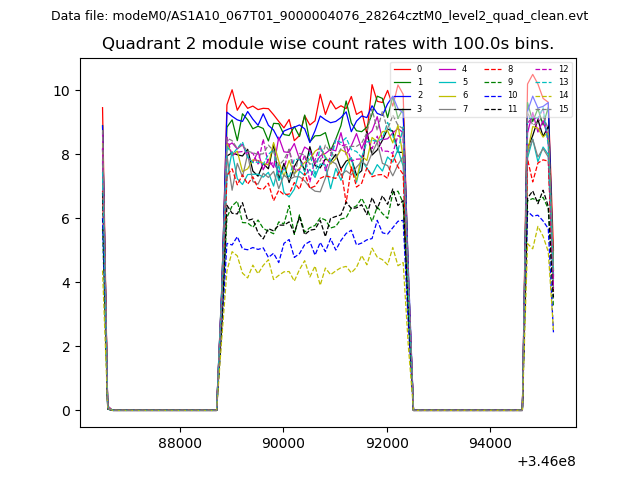
| Module-wise count rates for Quadrant B Data is divided into 100 sec bins |
 |
 |
| Module-wise count rates for Quadrant C Data is divided into 100 sec bins |
 |
 |
| Module-wise count rates for Quadrant D Data is divided into 100 sec bins |
 |
 |
| Parameter | Plot |
|---|---|
| CZT HV Monitor | 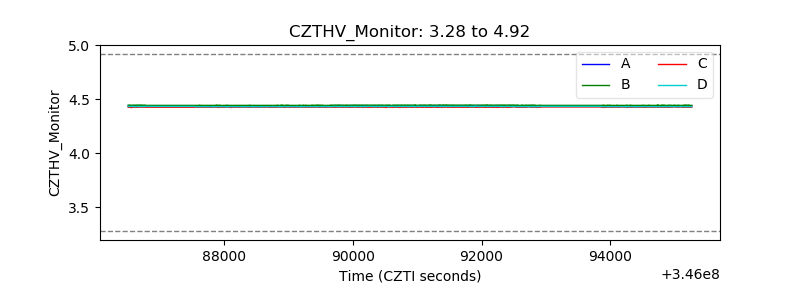 |
| D_VDD | 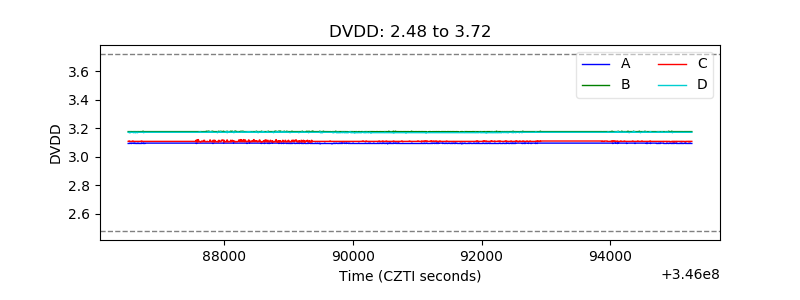 |
| Temperature 1 | 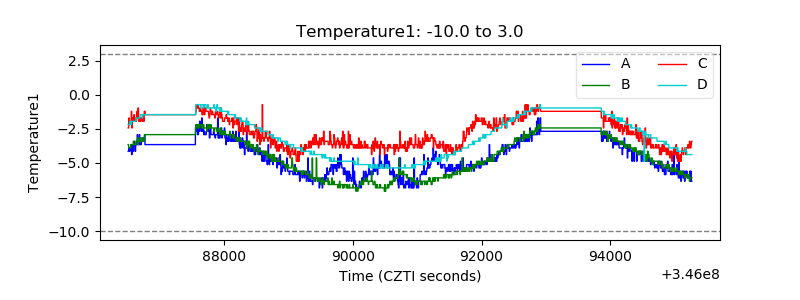 |
| Veto HV Monitor | 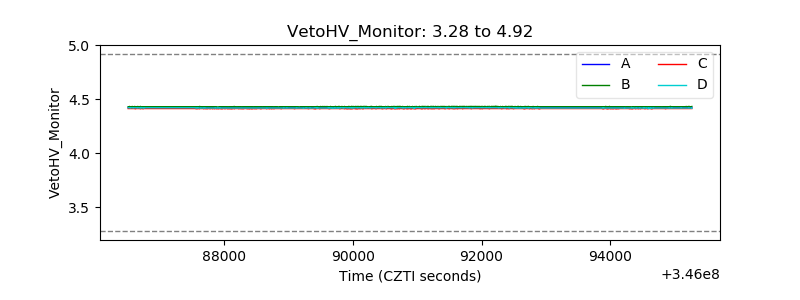 |
| Veto LLD | 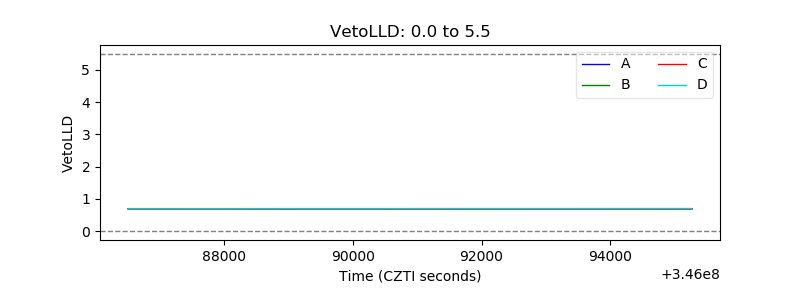 |
| Alpha Counter | 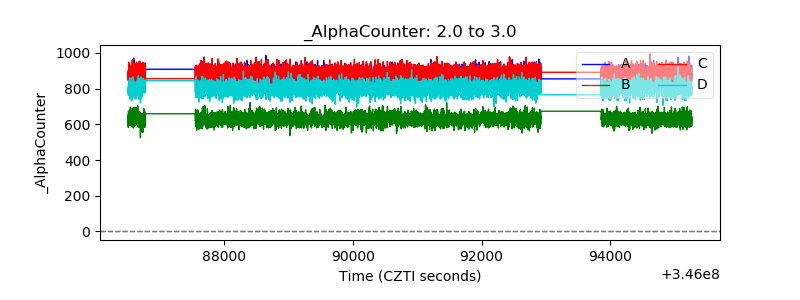 |
| _CPM_Rate | 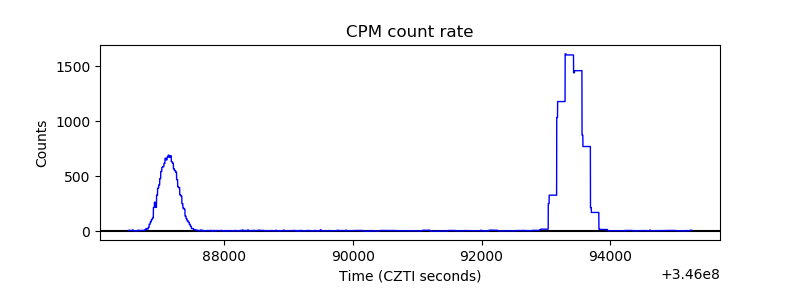 |
| CZT Counter |  |
| +2.5 Volts monitor |  |
| +5 Volts monitor | 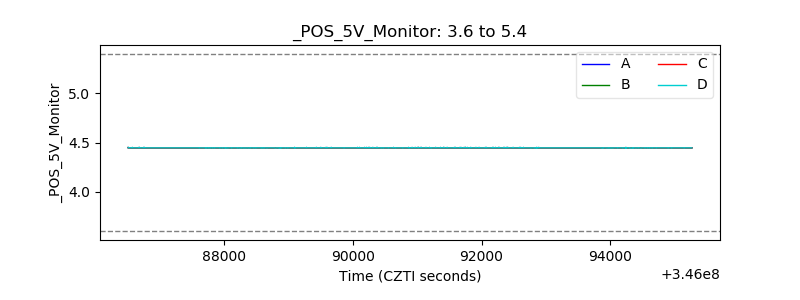 |
| _ROLL_ROT | 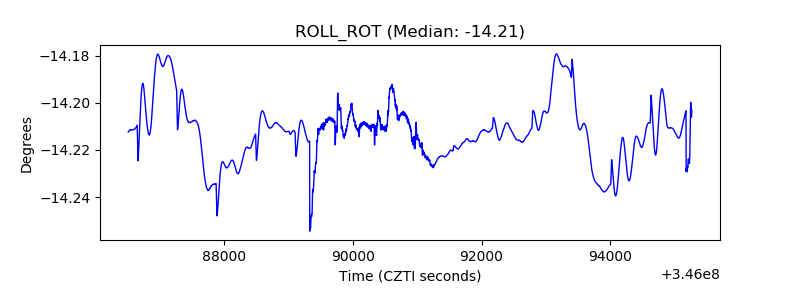 |
| _Roll_DEC | 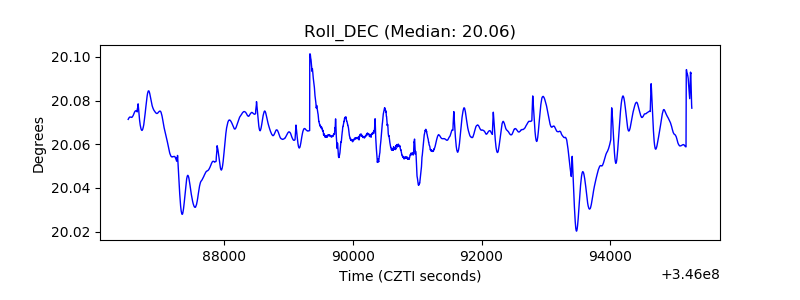 |
| _Roll_RA | 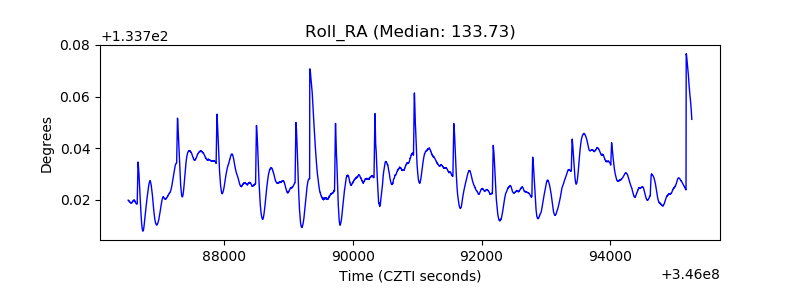 |
| Veto Counter | 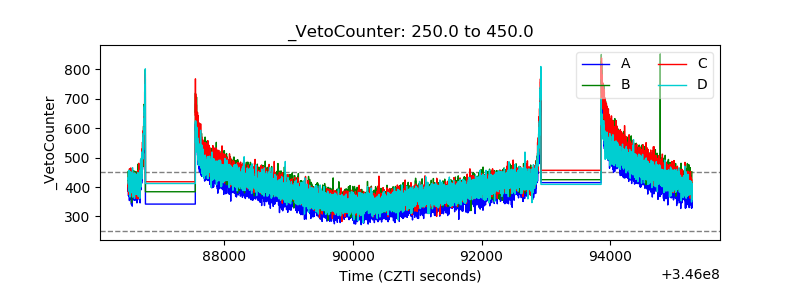 |