| Param | Original file | Final file |
|---|---|---|
| Filename | modeM0/AS1A10_067T01_9000004076_28265cztM0_level2.evt | modeM0/AS1A10_067T01_9000004076_28265cztM0_level2_quad_clean.evt |
| Size (bytes) | 622,537,920 | 89,210,880 |
| Size | 593.7 MB | 85.1 MB |
| Events in quadrant A | 3,277,834 | 591,388 |
| Events in quadrant B | 3,460,692 | 592,277 |
| Events in quadrant C | 3,432,527 | 565,307 |
| Events in quadrant D | 8,230,234 | 486,791 |
| Mode M0 | |||
|---|---|---|---|
| Quadrant | BADHDUFLAG | Total packets | Discarded packets |
| A | 0 | 14117 | 0 |
| B | 0 | 14619 | 0 |
| C | 0 | 14490 | 0 |
| D | 0 | 29050 | 0 |
| Mode M9 | |||
|---|---|---|---|
| Quadrant | BADHDUFLAG | Total packets | Discarded packets |
| A | 0 | 20 | 0 |
| B | 0 | 20 | 0 |
| C | 0 | 20 | 0 |
| D | 0 | 20 | 0 |
| Quadrant | Total seconds | Saturated seconds | Saturation percentage |
|---|---|---|---|
| A | 6674 | 47 | 0.704225% |
| B | 6675 | 93 | 1.393258% |
| C | 6675 | 125 | 1.872659% |
| D | 6674 | 1726 | 25.861552% |
Noise dominated data is calculated using 1-second bins in cleaned event files. If a bin has >2000 counts, and if more than 50% of those come from <1% of pixels, then it is considered to be noise-dominated and hence unusable.
| Quadrant | # 1 sec bins | Bins with >0 counts | Bins with >2000 counts | High rate bins dominated by noise | Noise dominated (total time) | Noise dominated (detector-on time) | Marked lightcurve |
|---|---|---|---|---|---|---|---|
| A | 8704 | 6675 | 0 | 0 | 0.00% | 0.00% | 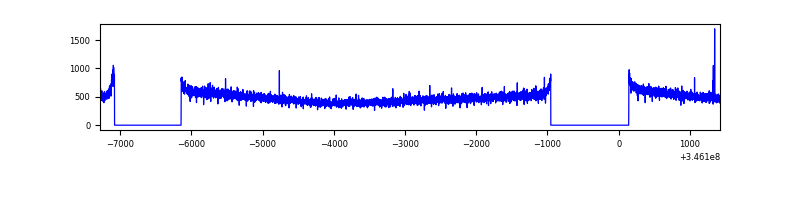 |
| B | 8705 | 6676 | 29 | 29 | 0.33% | 0.43% | 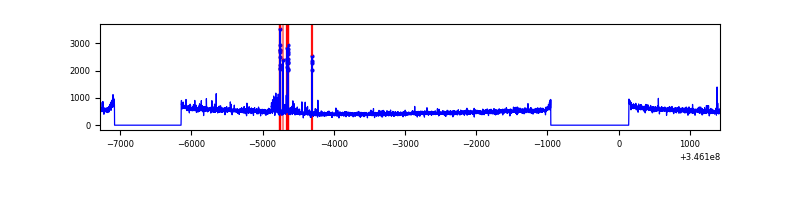 |
| C | 8705 | 6676 | 2 | 2 | 0.02% | 0.03% | 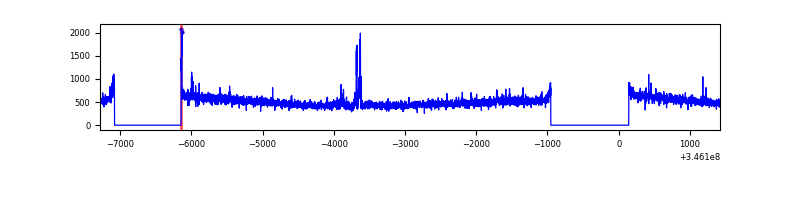 |
| D | 8704 | 6674 | 1541 | 1541 | 17.70% | 23.09% | 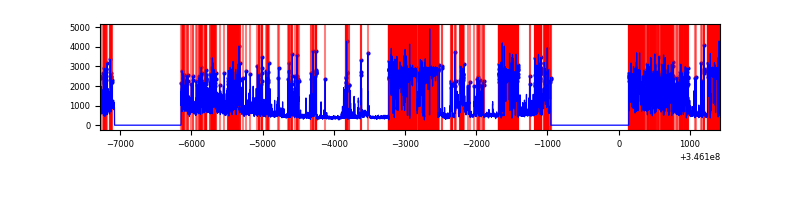 |
Top three noisy pixels from each quadrant. If the there are fewer than three noisy pixels in the level2.evt file, extra rows are filled as -1
| Pixel properties | Quadrant properties | ||||||
|---|---|---|---|---|---|---|---|
| Quadrant | DetID | PixID | Counts | Sigma | Mean | Median | Sigma |
| A | 13 | 254 | 11204 | 60.63 | 848 | 832 | 171.1 |
| A | 3 | 137 | 8392 | 44.2 | 848 | 832 | 171.1 |
| A | 0 | 226 | 7042 | 36.3 | 848 | 832 | 171.1 |
| B | 10 | 245 | 105456 | 646.2 | 842 | 820 | 161.9 |
| B | 0 | 230 | 23198 | 138.2 | 842 | 820 | 161.9 |
| B | 10 | 246 | 22944 | 136.63 | 842 | 820 | 161.9 |
| C | 14 | 238 | 131255 | 680.93 | 814 | 819 | 191.6 |
| C | 3 | 233 | 60352 | 310.79 | 814 | 819 | 191.6 |
| C | 2 | 16 | 39763 | 203.3 | 814 | 819 | 191.6 |
| D | 1 | 52 | 5032943 | 29203.2 | 720 | 702 | 172.3 |
| D | 8 | 195 | 290350 | 1680.89 | 720 | 702 | 172.3 |
| D | 2 | 250 | 91014 | 524.1 | 720 | 702 | 172.3 |
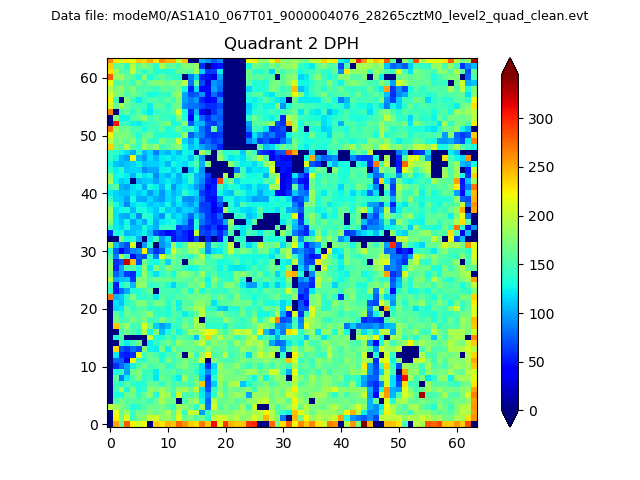
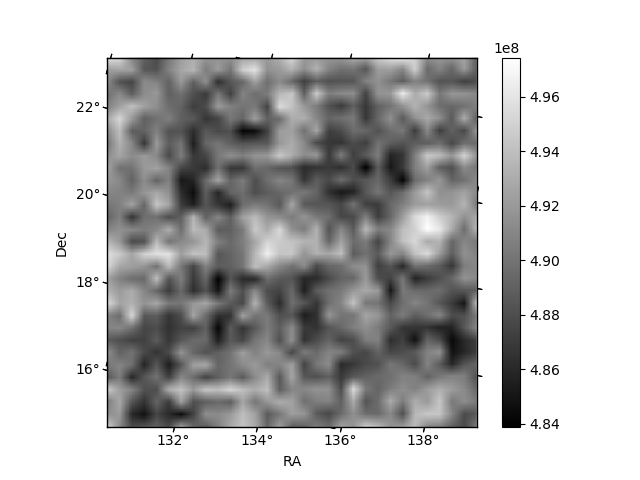
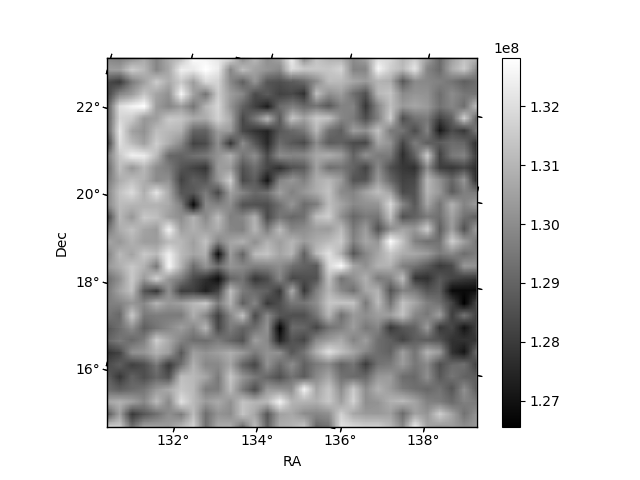
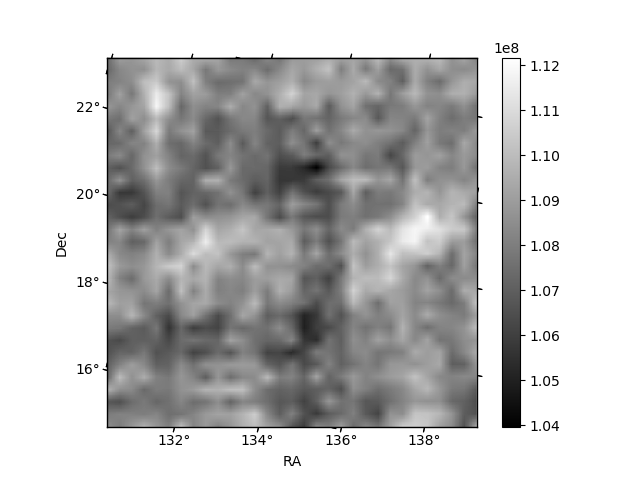
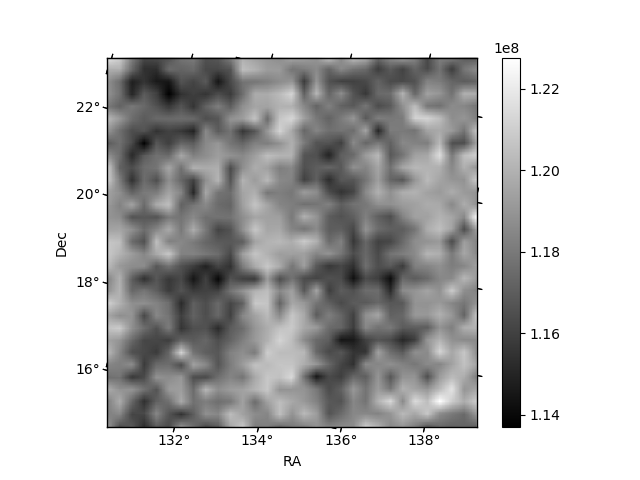
Histogram calculated using DETX and DETY for each event in the final _common_clean file
| Quadrant A | 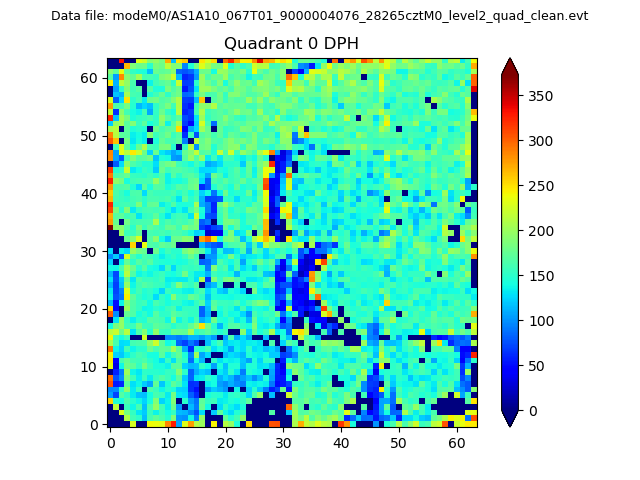 |
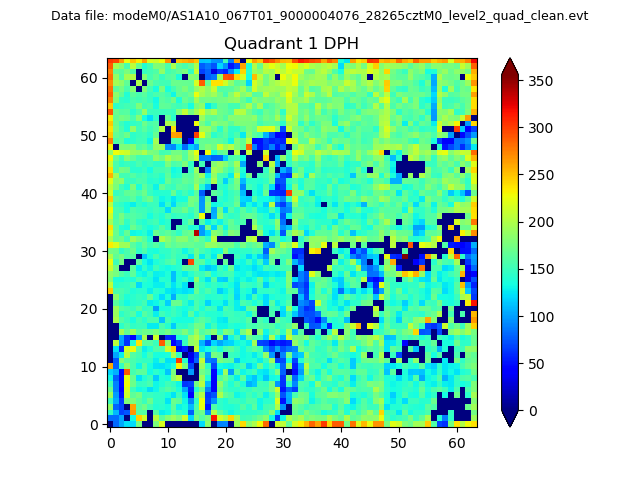 |
Quadrant B |
|---|---|---|---|
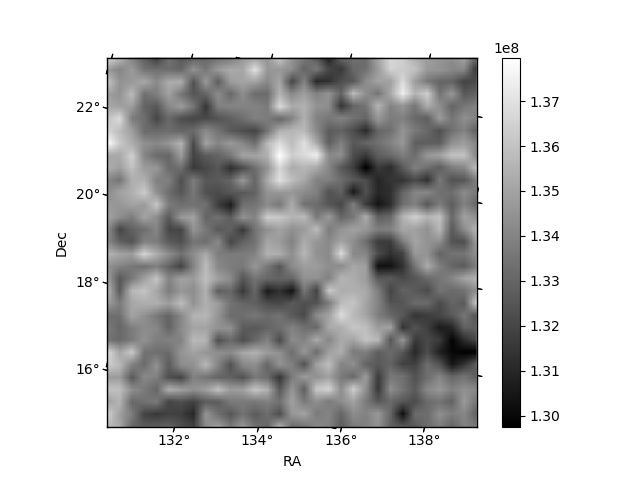
| Quadrant D | 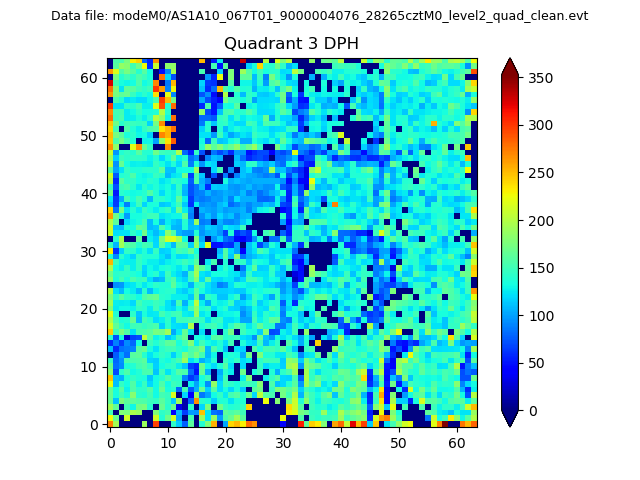 |
 |
Quadrant C |
| Plot type | Count rate plots | Images |
|---|---|---|
| Comparison with Poisson distribution Blue bars denote a histogram of data divided into 1 sec bins. Red curve is a Poisson curve with rate = median count rate of data. |
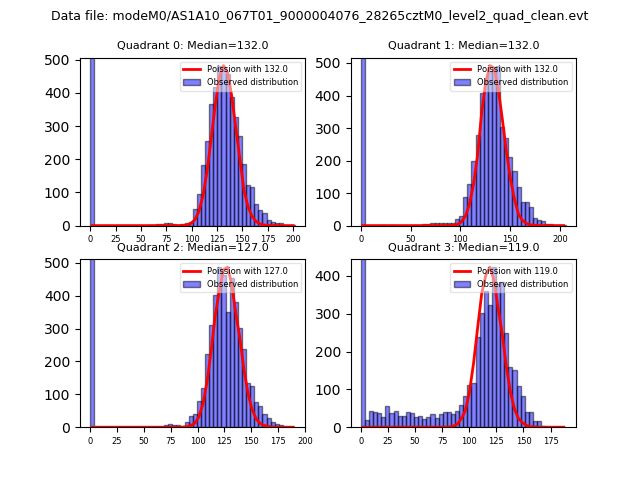 |
 |
| Quadrant-wise count rates Data is divided into 100 sec bins |
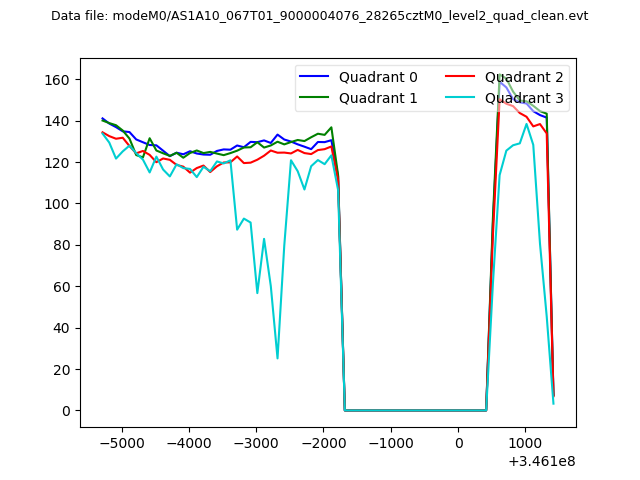 |
|
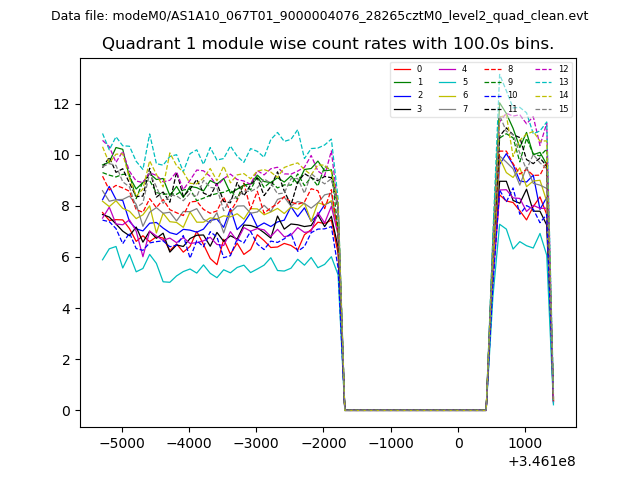
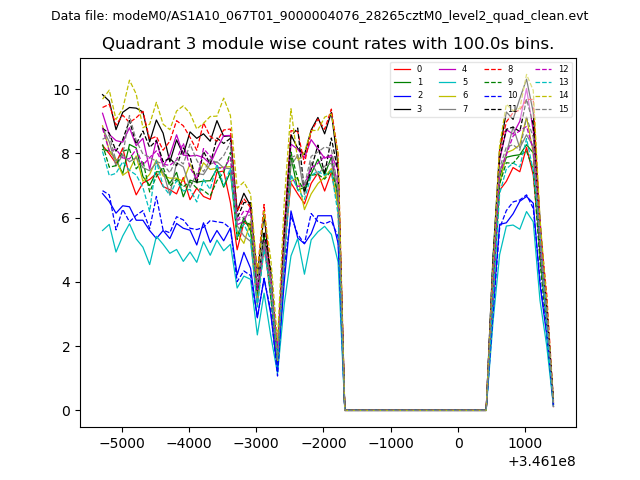
| Module-wise count rates for Quadrant A Data is divided into 100 sec bins |
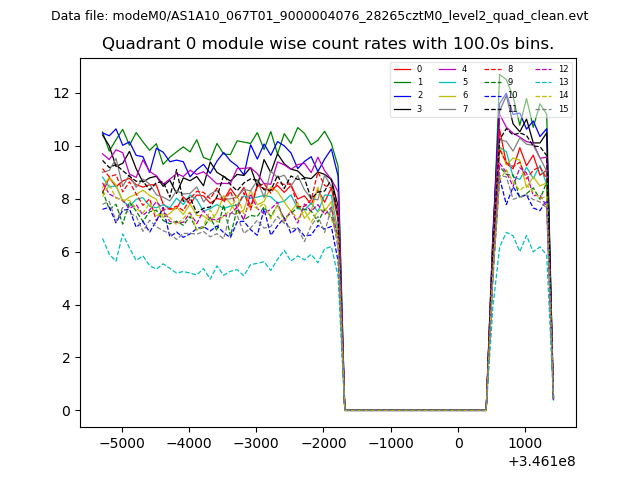 |
 |
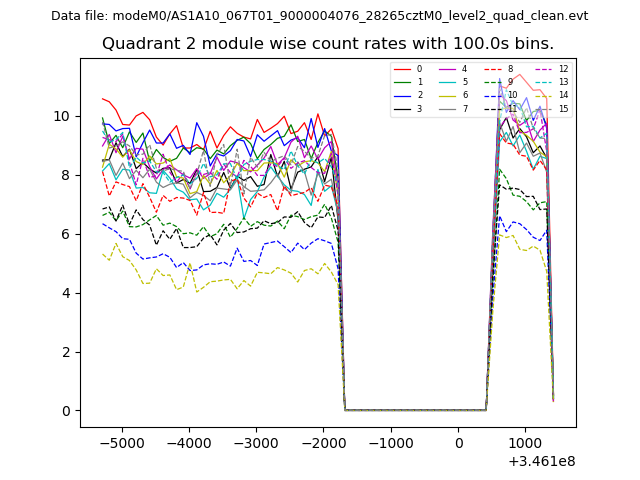
| Module-wise count rates for Quadrant B Data is divided into 100 sec bins |
 |
 |
| Module-wise count rates for Quadrant C Data is divided into 100 sec bins |
 |
 |
| Module-wise count rates for Quadrant D Data is divided into 100 sec bins |
 |
 |
| Parameter | Plot |
|---|---|
| CZT HV Monitor |  |
| D_VDD | 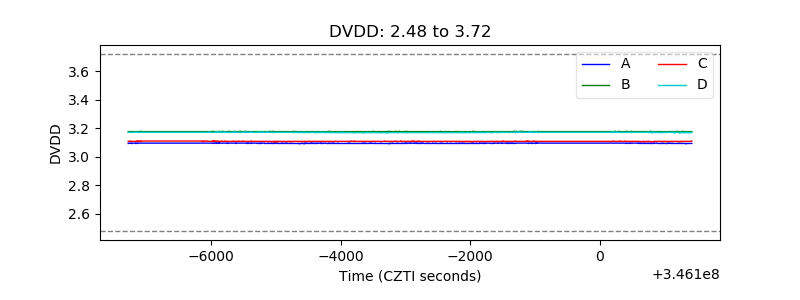 |
| Temperature 1 | 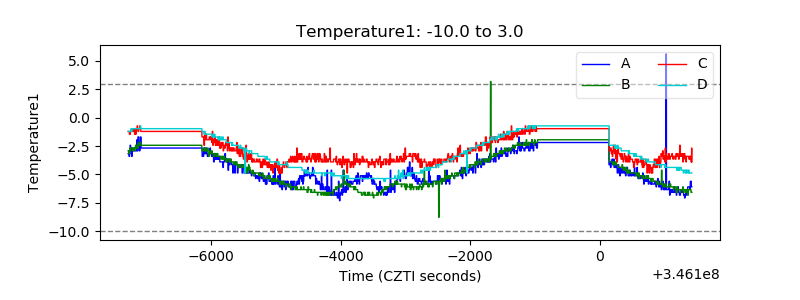 |
| Veto HV Monitor | 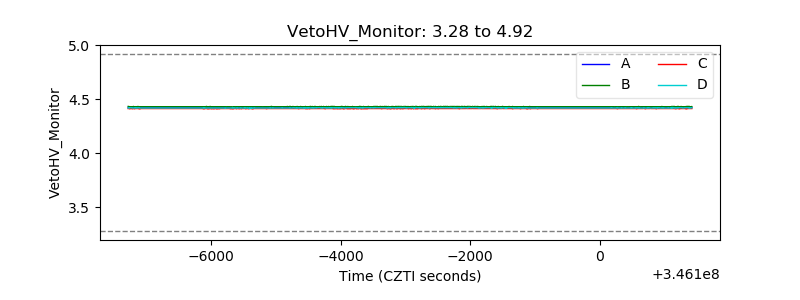 |
| Veto LLD | 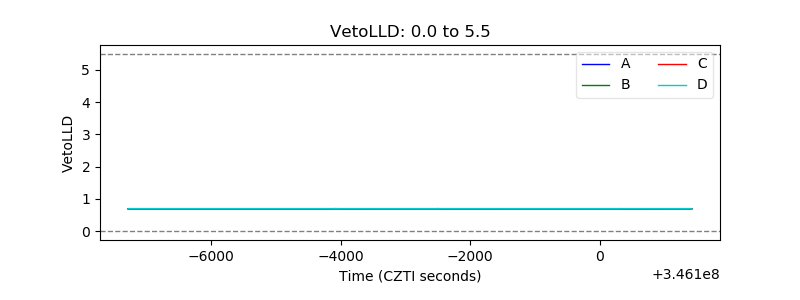 |
| Alpha Counter | 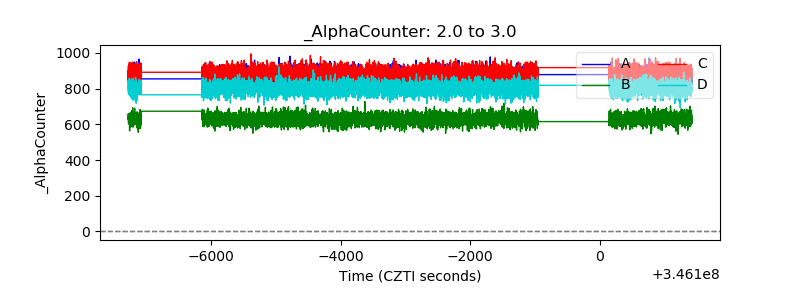 |
| _CPM_Rate | 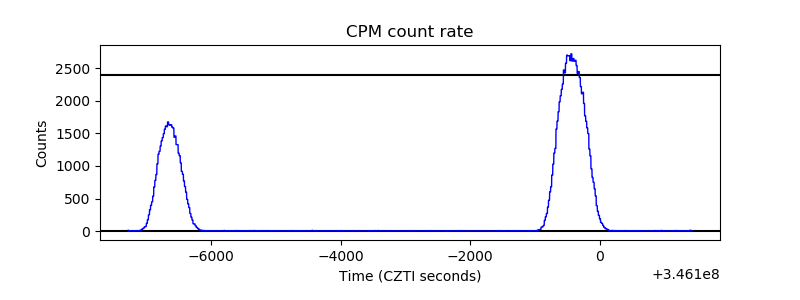 |
| CZT Counter | 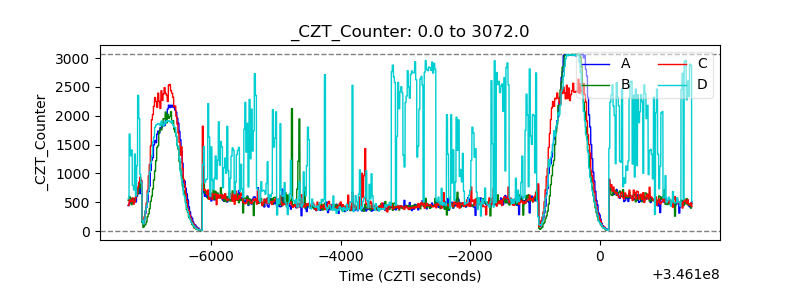 |
| +2.5 Volts monitor |  |
| +5 Volts monitor |  |
| _ROLL_ROT | 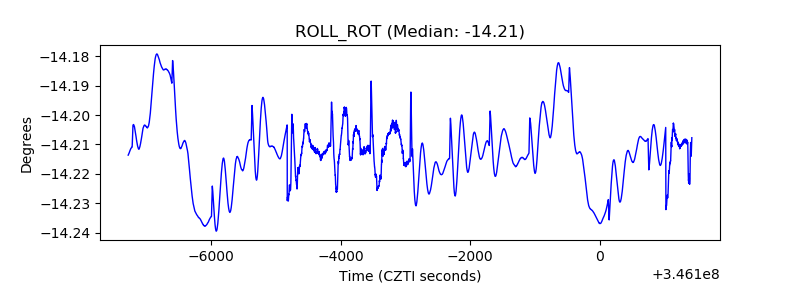 |
| _Roll_DEC | 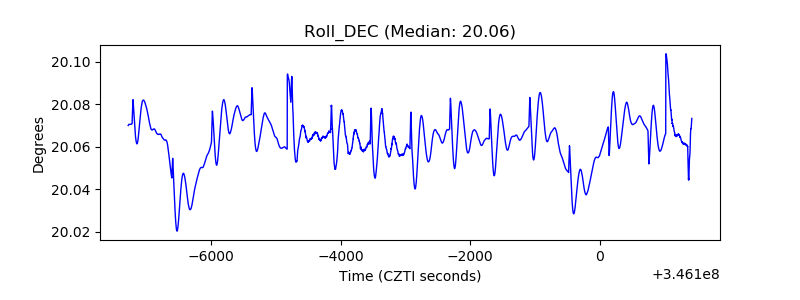 |
| _Roll_RA | 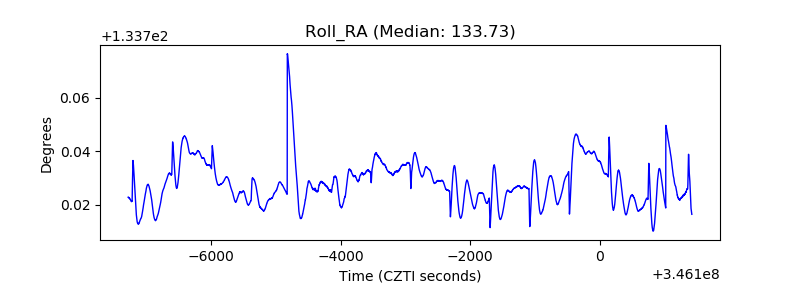 |
| Veto Counter | 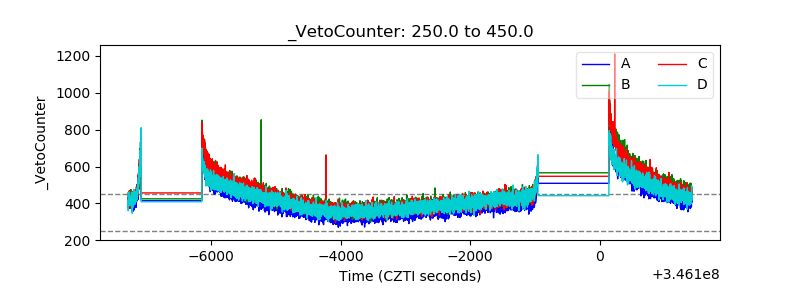 |