| Param | Original file | Final file |
|---|---|---|
| Filename | modeM0/AS1A10_067T01_9000004076_28267cztM0_level2.evt | modeM0/AS1A10_067T01_9000004076_28267cztM0_level2_quad_clean.evt |
| Size (bytes) | 687,159,360 | 100,488,960 |
| Size | 655.3 MB | 95.8 MB |
| Events in quadrant A | 3,346,444 | 696,142 |
| Events in quadrant B | 3,990,870 | 704,645 |
| Events in quadrant C | 3,499,285 | 662,328 |
| Events in quadrant D | 9,525,387 | 516,939 |
| Mode M0 | |||
|---|---|---|---|
| Quadrant | BADHDUFLAG | Total packets | Discarded packets |
| A | 0 | 14233 | 0 |
| B | 0 | 16210 | 0 |
| C | 0 | 14670 | 0 |
| D | 0 | 32767 | 0 |
| Mode M9 | |||
|---|---|---|---|
| Quadrant | BADHDUFLAG | Total packets | Discarded packets |
| A | 0 | 23 | 0 |
| B | 0 | 23 | 0 |
| C | 0 | 23 | 0 |
| D | 0 | 23 | 0 |
| Quadrant | Total seconds | Saturated seconds | Saturation percentage |
|---|---|---|---|
| A | 6634 | 36 | 0.542659% |
| B | 6634 | 194 | 2.924329% |
| C | 6634 | 106 | 1.597829% |
| D | 6635 | 2229 | 33.594574% |
Noise dominated data is calculated using 1-second bins in cleaned event files. If a bin has >2000 counts, and if more than 50% of those come from <1% of pixels, then it is considered to be noise-dominated and hence unusable.
| Quadrant | # 1 sec bins | Bins with >0 counts | Bins with >2000 counts | High rate bins dominated by noise | Noise dominated (total time) | Noise dominated (detector-on time) | Marked lightcurve |
|---|---|---|---|---|---|---|---|
| A | 8919 | 6636 | 5 | 5 | 0.06% | 0.08% | 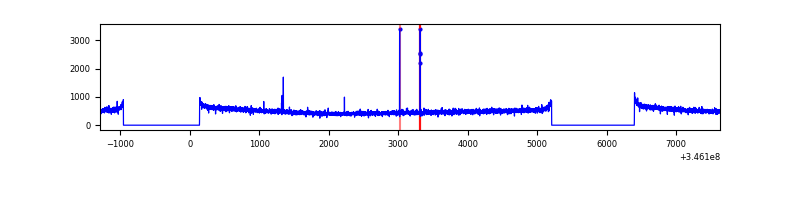 |
| B | 8919 | 6636 | 116 | 116 | 1.30% | 1.75% | 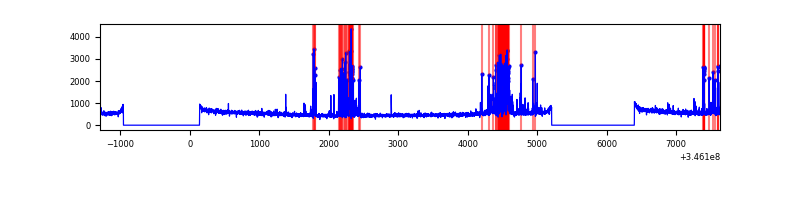 |
| C | 8919 | 6636 | 10 | 10 | 0.11% | 0.15% | 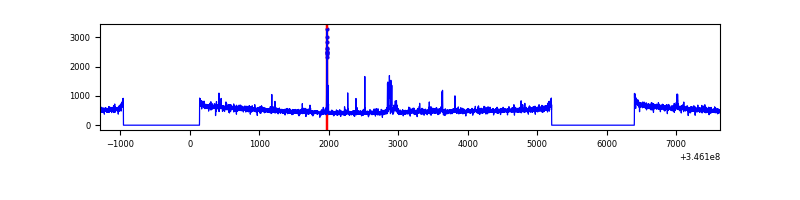 |
| D | 8920 | 6635 | 2151 | 2151 | 24.11% | 32.42% | 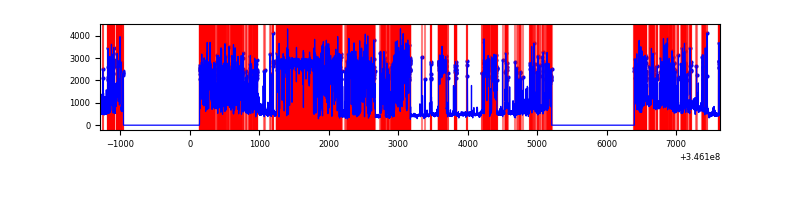 |
Top three noisy pixels from each quadrant. If the there are fewer than three noisy pixels in the level2.evt file, extra rows are filled as -1
| Pixel properties | Quadrant properties | ||||||
|---|---|---|---|---|---|---|---|
| Quadrant | DetID | PixID | Counts | Sigma | Mean | Median | Sigma |
| A | 12 | 96 | 20270 | 113.05 | 863 | 848 | 171.8 |
| A | 13 | 254 | 11271 | 60.67 | 863 | 848 | 171.8 |
| A | 3 | 137 | 8143 | 42.46 | 863 | 848 | 171.8 |
| B | 10 | 245 | 613967 | 3780.79 | 855 | 836 | 162.2 |
| B | 12 | 111 | 19966 | 117.96 | 855 | 836 | 162.2 |
| B | 11 | 111 | 17924 | 105.37 | 855 | 836 | 162.2 |
| C | 14 | 238 | 134900 | 689.5 | 827 | 835 | 194.4 |
| C | 3 | 233 | 79460 | 404.37 | 827 | 835 | 194.4 |
| C | 2 | 16 | 48372 | 244.48 | 827 | 835 | 194.4 |
| D | 1 | 52 | 6141901 | 37171.45 | 695 | 677 | 165.2 |
| D | 8 | 195 | 547337 | 3308.81 | 695 | 677 | 165.2 |
| D | 2 | 250 | 118796 | 714.95 | 695 | 677 | 165.2 |
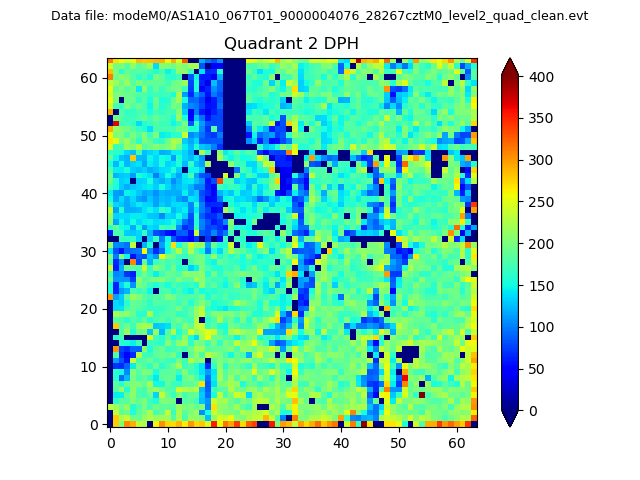
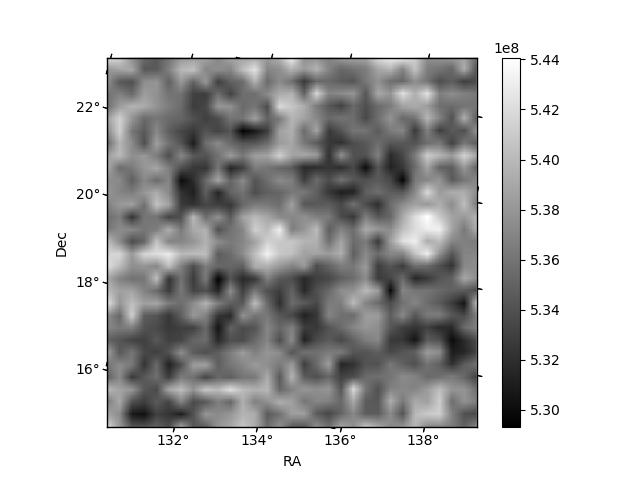
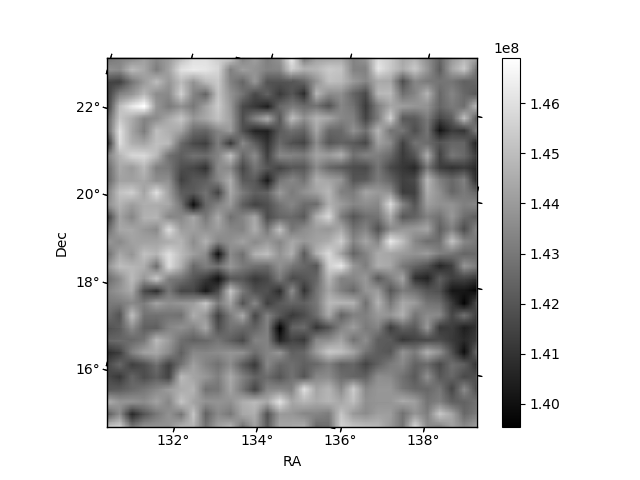
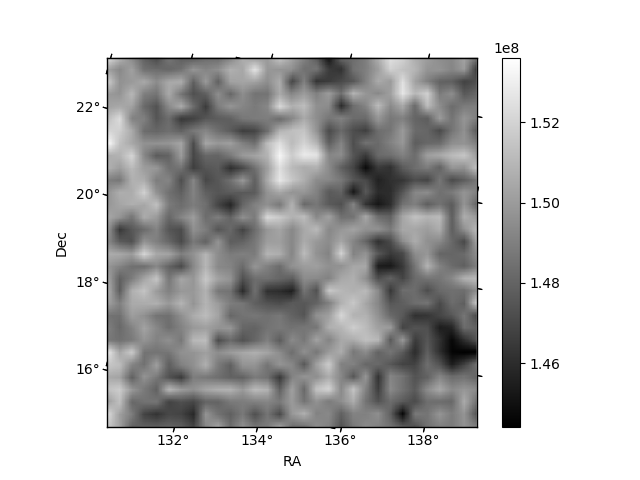
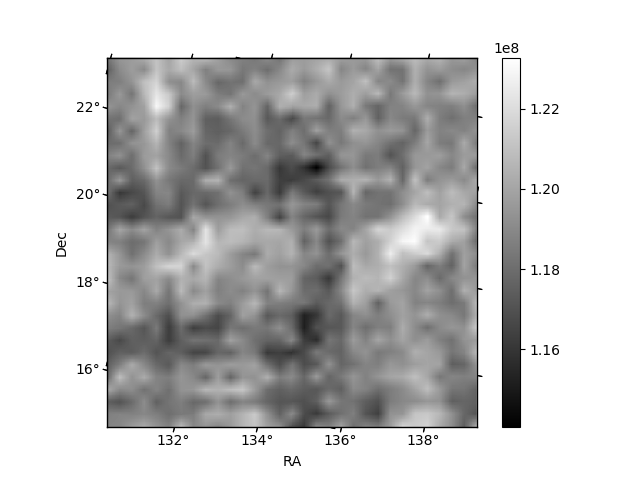
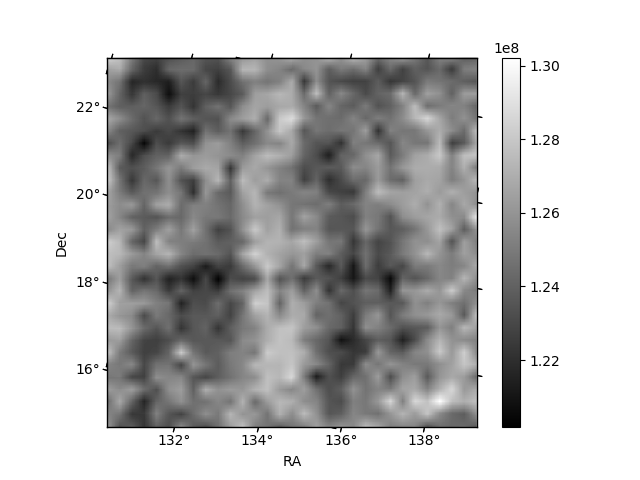
Histogram calculated using DETX and DETY for each event in the final _common_clean file
| Quadrant A | 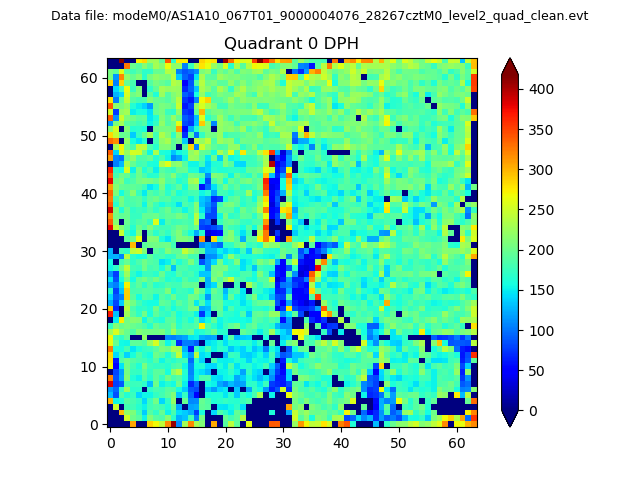 |
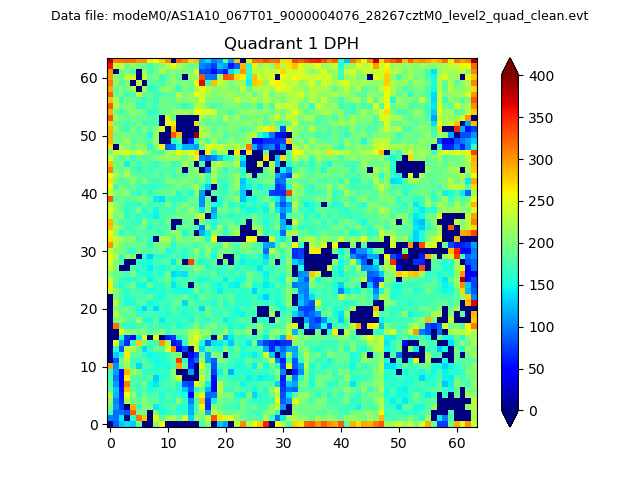 |
Quadrant B |
|---|---|---|---|
| Quadrant D | 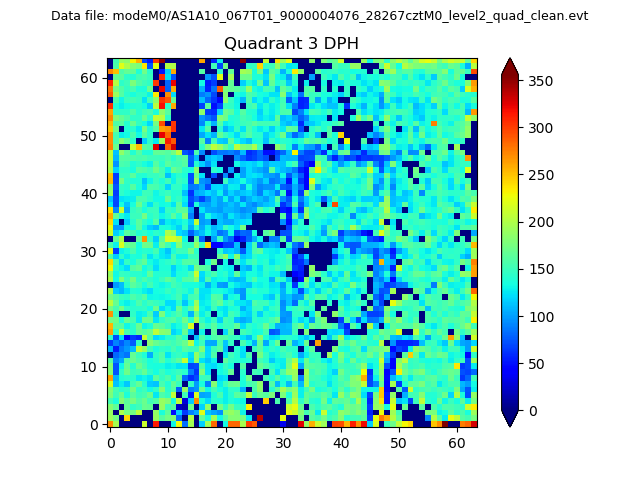 |
 |
Quadrant C |
| Plot type | Count rate plots | Images |
|---|---|---|
| Comparison with Poisson distribution Blue bars denote a histogram of data divided into 1 sec bins. Red curve is a Poisson curve with rate = median count rate of data. |
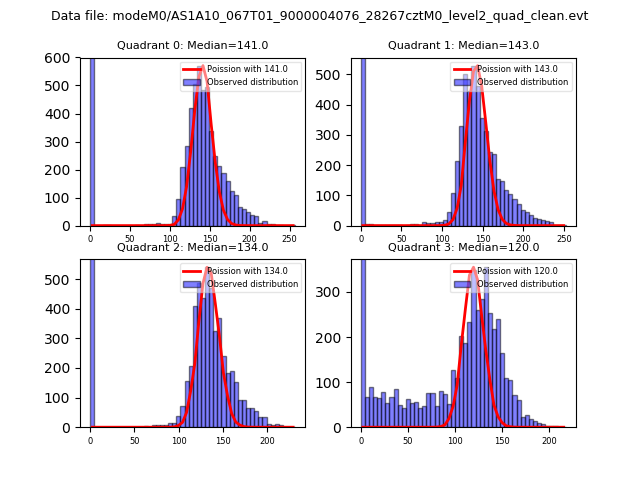 |
 |
| Quadrant-wise count rates Data is divided into 100 sec bins |
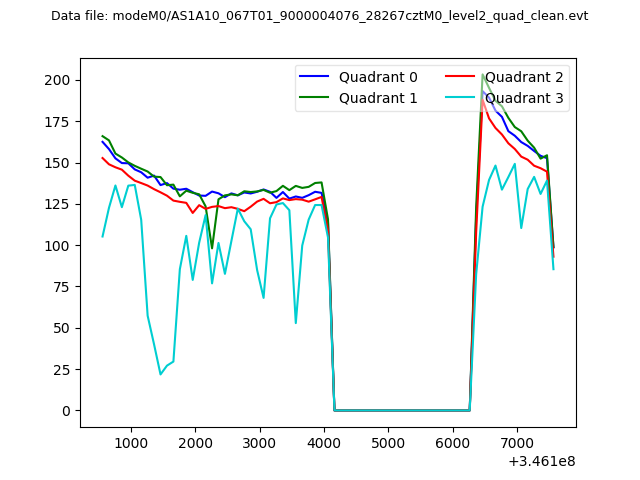 |
|
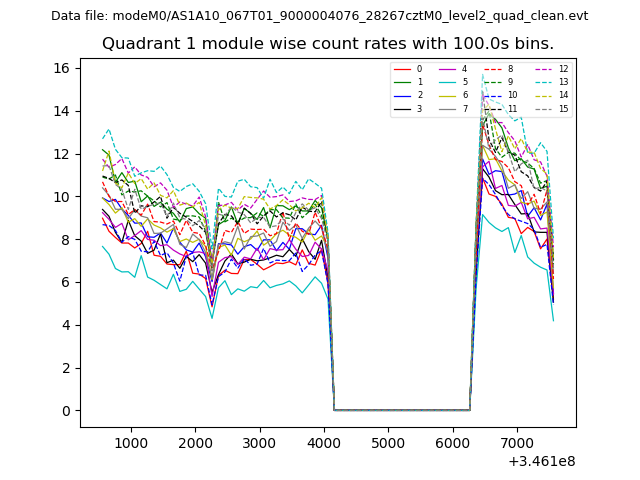
| Module-wise count rates for Quadrant A Data is divided into 100 sec bins |
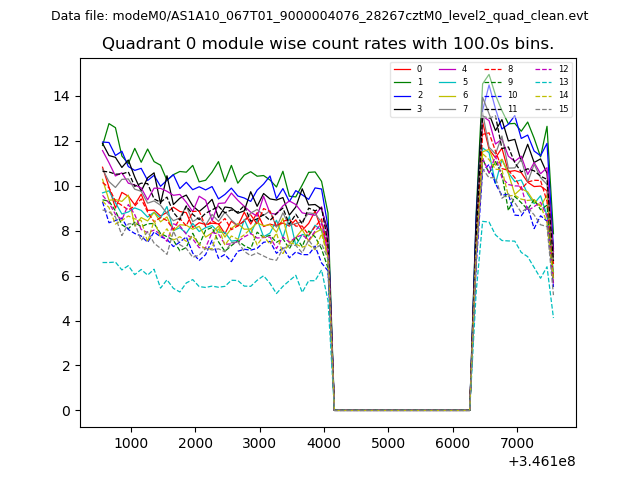 |
 |
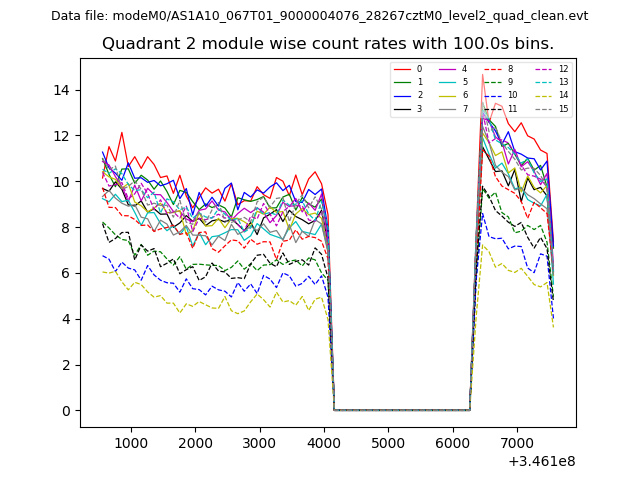
| Module-wise count rates for Quadrant B Data is divided into 100 sec bins |
 |
 |
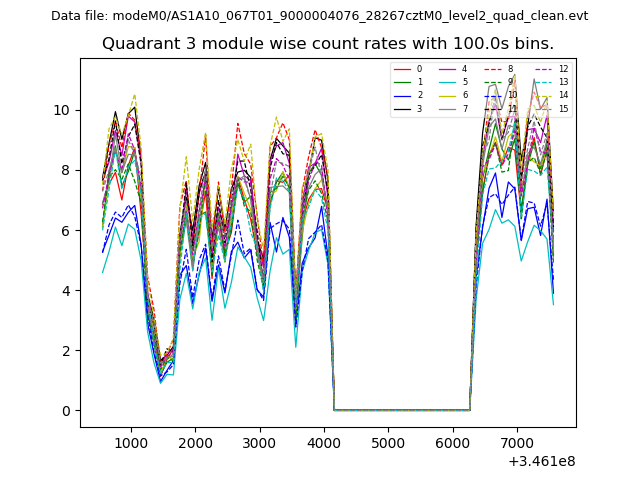
| Module-wise count rates for Quadrant C Data is divided into 100 sec bins |
 |
 |
| Module-wise count rates for Quadrant D Data is divided into 100 sec bins |
 |
 |
| Parameter | Plot |
|---|---|
| CZT HV Monitor | 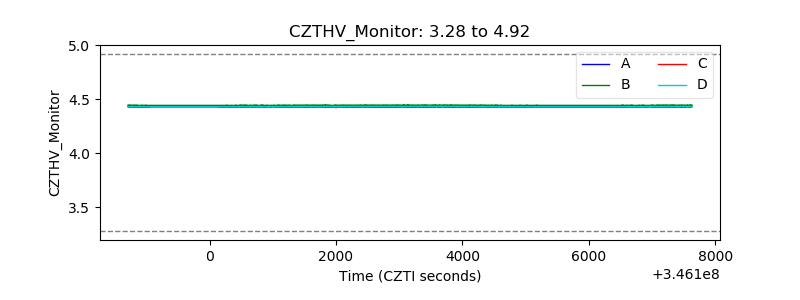 |
| D_VDD | 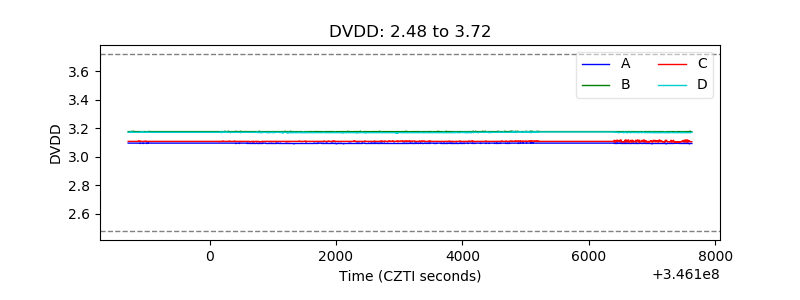 |
| Temperature 1 | 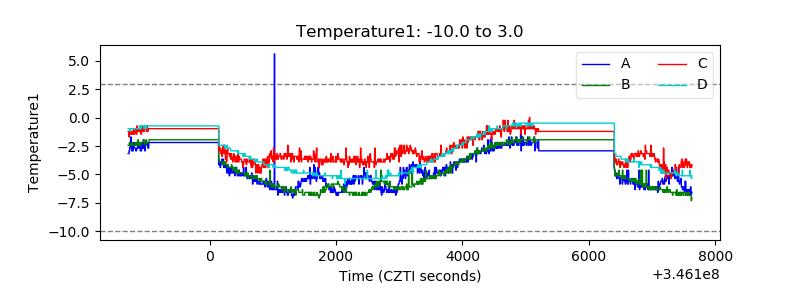 |
| Veto HV Monitor | 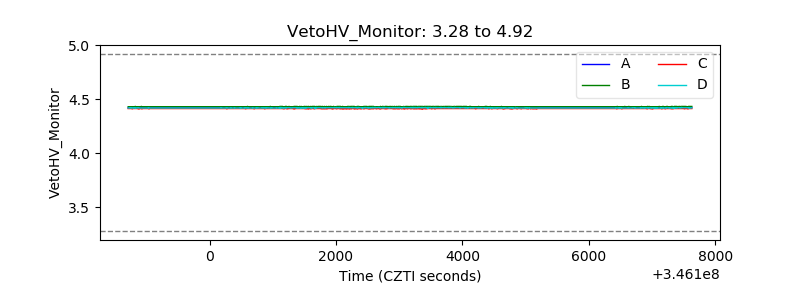 |
| Veto LLD | 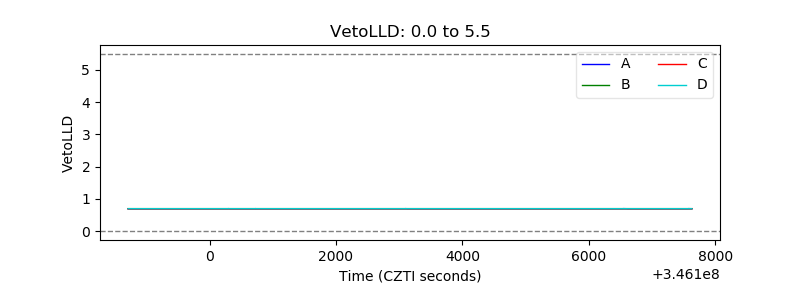 |
| Alpha Counter | 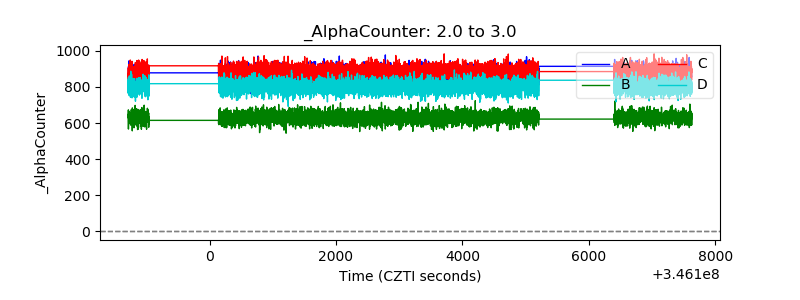 |
| _CPM_Rate | 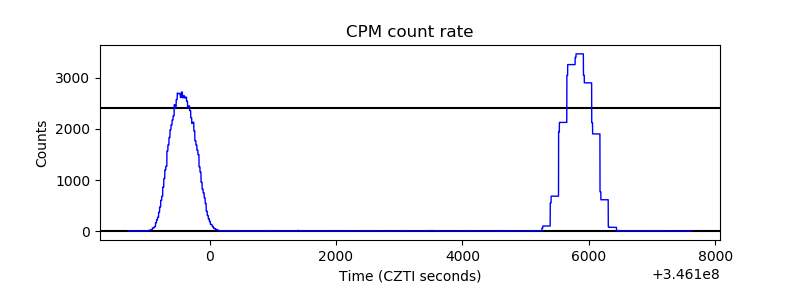 |
| CZT Counter | 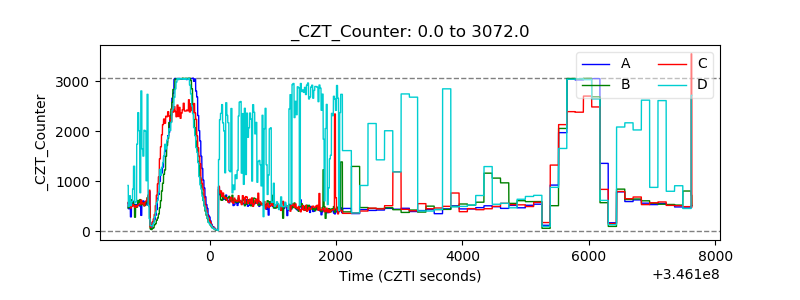 |
| +2.5 Volts monitor | 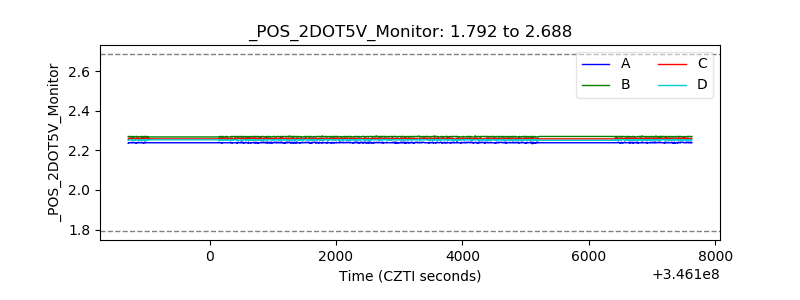 |
| +5 Volts monitor |  |
| _ROLL_ROT | 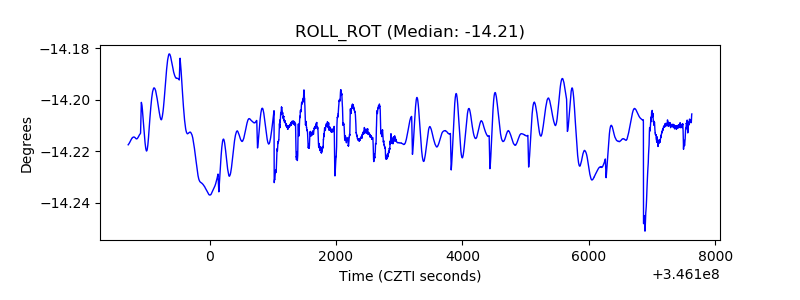 |
| _Roll_DEC | 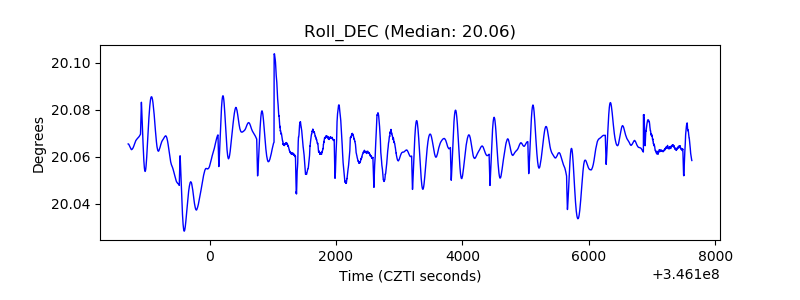 |
| _Roll_RA | 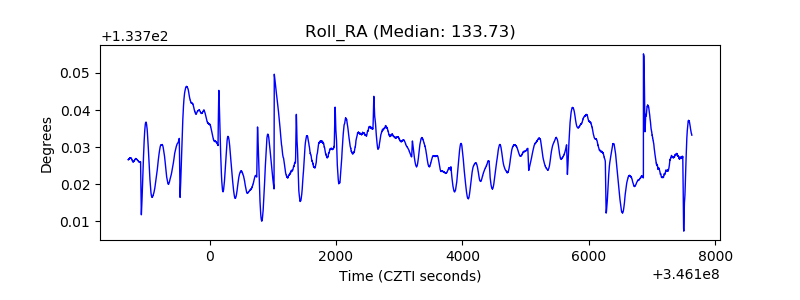 |
| Veto Counter | 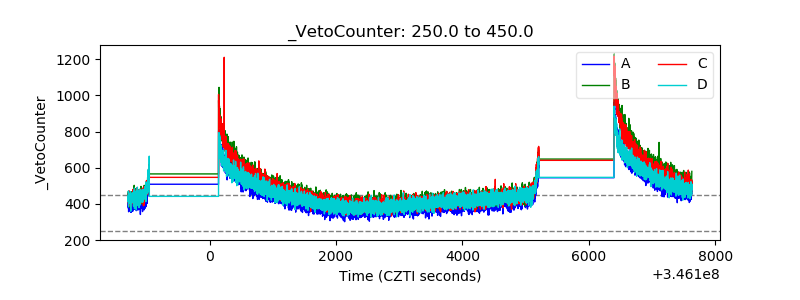 |