| Param | Original file | Final file |
|---|---|---|
| Filename | modeM0/AS1A10_067T01_9000004076_28268cztM0_level2.evt | modeM0/AS1A10_067T01_9000004076_28268cztM0_level2_quad_clean.evt |
| Size (bytes) | 559,641,600 | 117,480,960 |
| Size | 533.7 MB | 112.0 MB |
| Events in quadrant A | 3,358,126 | 806,138 |
| Events in quadrant B | 3,836,783 | 825,825 |
| Events in quadrant C | 3,446,294 | 766,681 |
| Events in quadrant D | 5,863,574 | 702,387 |
| Mode M0 | |||
|---|---|---|---|
| Quadrant | BADHDUFLAG | Total packets | Discarded packets |
| A | 0 | 14053 | 0 |
| B | 0 | 15629 | 0 |
| C | 0 | 14372 | 0 |
| D | 0 | 21863 | 0 |
| Mode M9 | |||
|---|---|---|---|
| Quadrant | BADHDUFLAG | Total packets | Discarded packets |
| A | 0 | 17 | 0 |
| B | 0 | 18 | 0 |
| C | 0 | 18 | 0 |
| D | 0 | 18 | 0 |
| Quadrant | Total seconds | Saturated seconds | Saturation percentage |
|---|---|---|---|
| A | 6557 | 33 | 0.503279% |
| B | 6557 | 110 | 1.677596% |
| C | 6557 | 73 | 1.113314% |
| D | 6557 | 664 | 10.126582% |
Noise dominated data is calculated using 1-second bins in cleaned event files. If a bin has >2000 counts, and if more than 50% of those come from <1% of pixels, then it is considered to be noise-dominated and hence unusable.
| Quadrant | # 1 sec bins | Bins with >0 counts | Bins with >2000 counts | High rate bins dominated by noise | Noise dominated (total time) | Noise dominated (detector-on time) | Marked lightcurve |
|---|---|---|---|---|---|---|---|
| A | 7837 | 6558 | 3 | 3 | 0.04% | 0.05% | 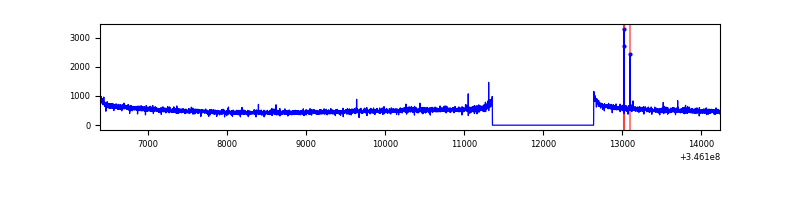 |
| B | 7837 | 6558 | 40 | 40 | 0.51% | 0.61% | 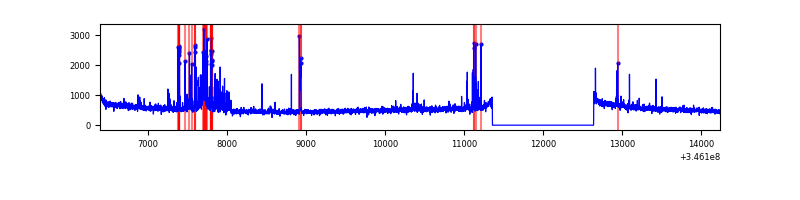 |
| C | 7837 | 6558 | 0 | 0 | 0.00% | 0.00% |  |
| D | 7837 | 6558 | 637 | 637 | 8.13% | 9.71% | 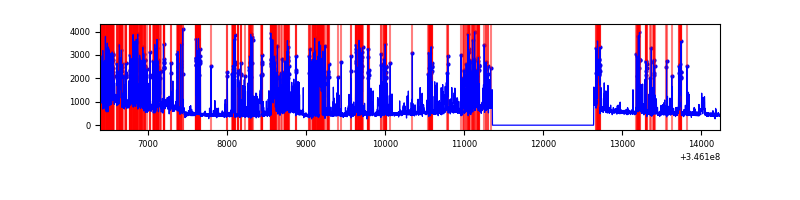 |
Top three noisy pixels from each quadrant. If the there are fewer than three noisy pixels in the level2.evt file, extra rows are filled as -1
| Pixel properties | Quadrant properties | ||||||
|---|---|---|---|---|---|---|---|
| Quadrant | DetID | PixID | Counts | Sigma | Mean | Median | Sigma |
| A | 12 | 96 | 11203 | 60.09 | 868 | 854 | 172.2 |
| A | 13 | 254 | 10946 | 58.6 | 868 | 854 | 172.2 |
| A | 3 | 137 | 7948 | 41.19 | 868 | 854 | 172.2 |
| B | 10 | 245 | 369880 | 2287.98 | 870 | 848 | 161.3 |
| B | 10 | 246 | 47297 | 287.98 | 870 | 848 | 161.3 |
| B | 12 | 111 | 19695 | 116.85 | 870 | 848 | 161.3 |
| C | 14 | 238 | 136916 | 705.49 | 830 | 839 | 192.9 |
| C | 3 | 233 | 32931 | 166.38 | 830 | 839 | 192.9 |
| C | 15 | 208 | 21555 | 107.4 | 830 | 839 | 192.9 |
| D | 1 | 52 | 2163662 | 11482.28 | 793 | 773 | 188.4 |
| D | 8 | 195 | 375696 | 1990.38 | 793 | 773 | 188.4 |
| D | 7 | 238 | 148900 | 786.37 | 793 | 773 | 188.4 |
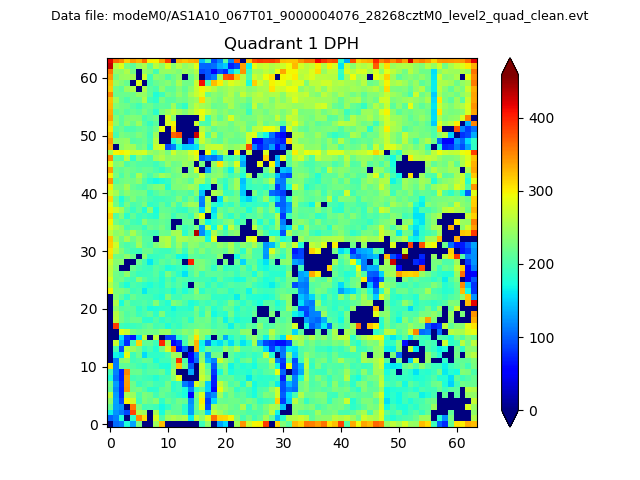
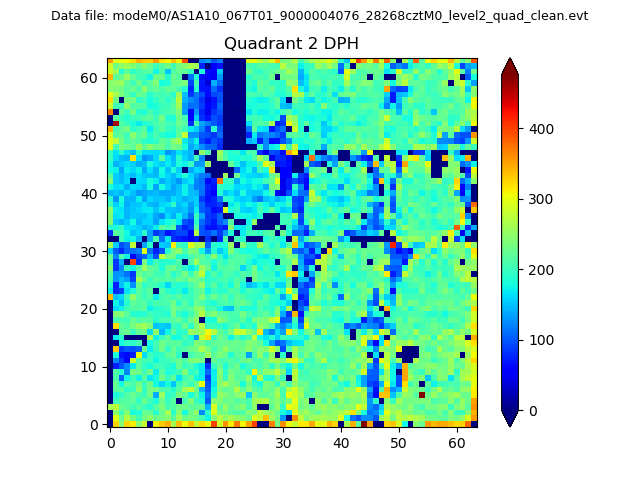
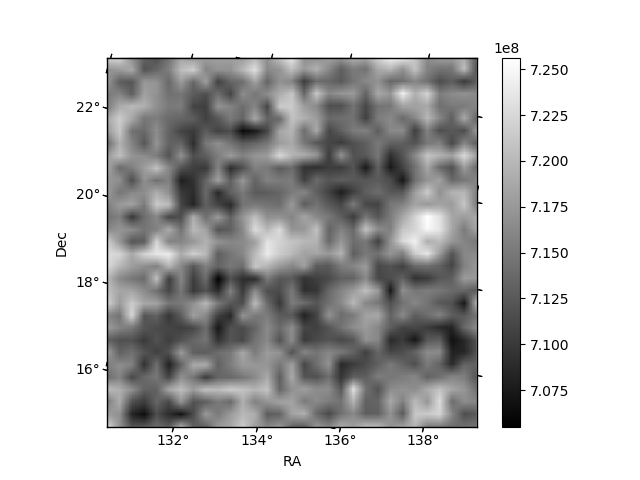
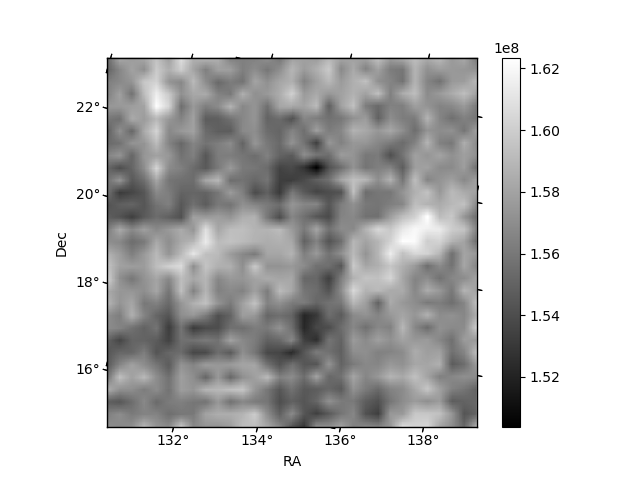
Histogram calculated using DETX and DETY for each event in the final _common_clean file
| Quadrant A | 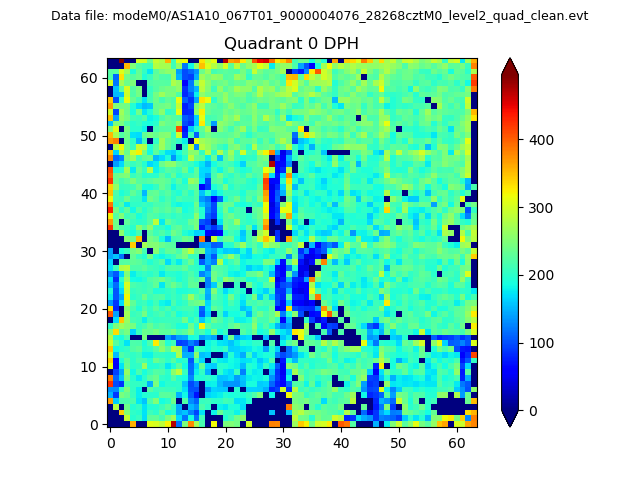 |
 |
Quadrant B |
|---|---|---|---|
| Quadrant D | 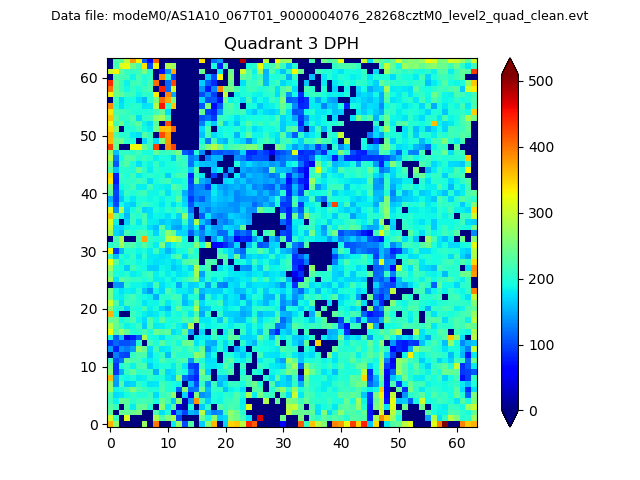 |
 |
Quadrant C |
| Plot type | Count rate plots | Images |
|---|---|---|
| Comparison with Poisson distribution Blue bars denote a histogram of data divided into 1 sec bins. Red curve is a Poisson curve with rate = median count rate of data. |
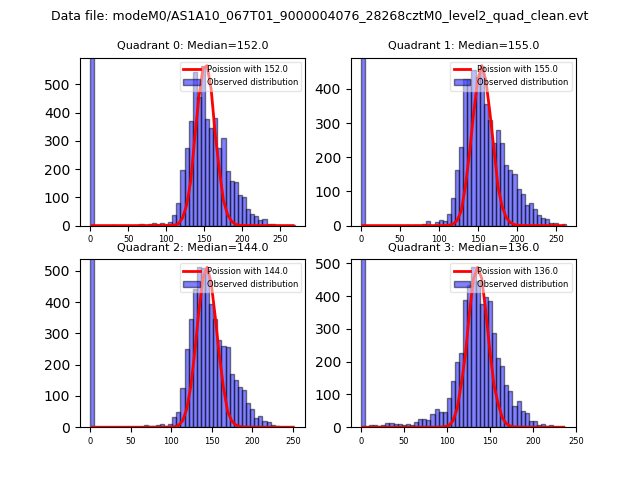 |
 |
| Quadrant-wise count rates Data is divided into 100 sec bins |
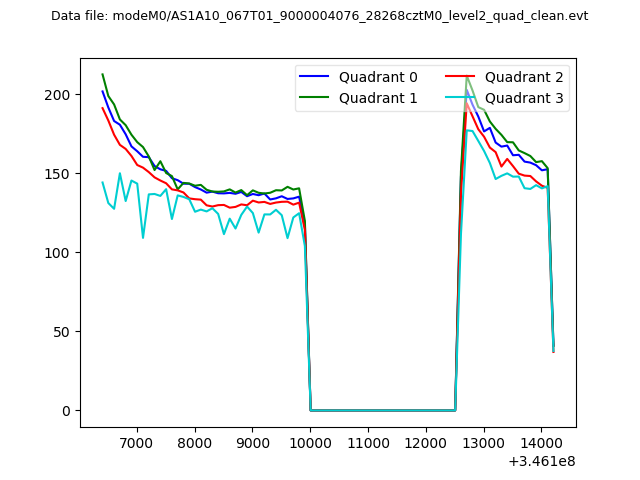 |
|
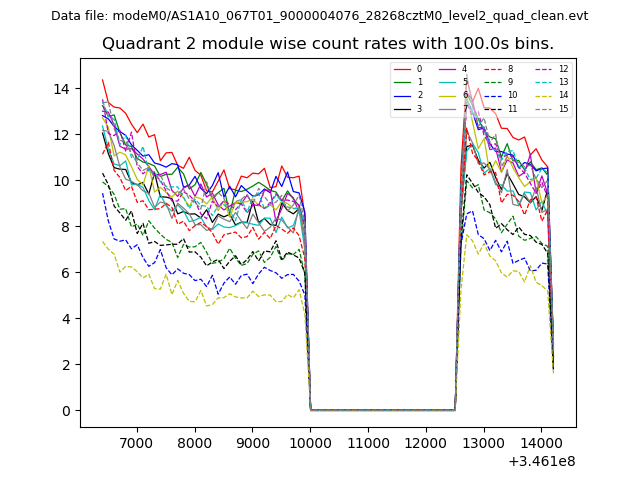
| Module-wise count rates for Quadrant A Data is divided into 100 sec bins |
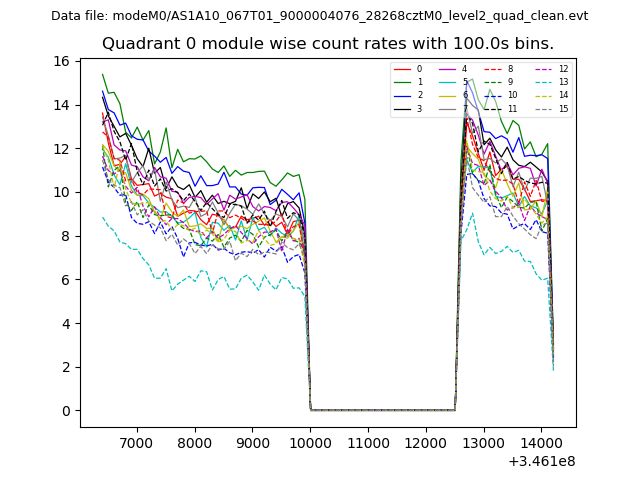 |
 |
| Module-wise count rates for Quadrant B Data is divided into 100 sec bins |
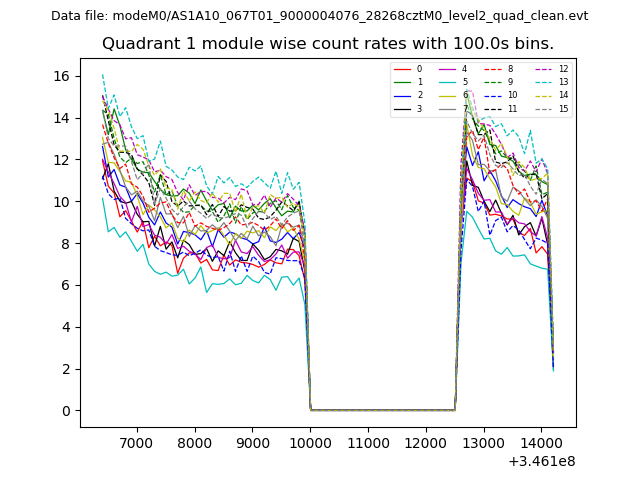 |
 |
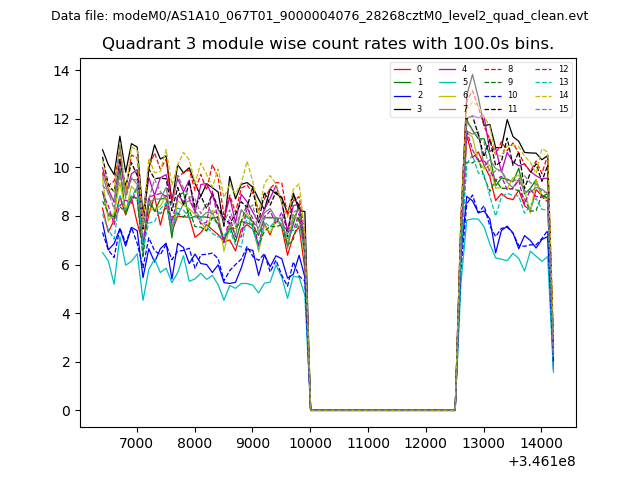
| Module-wise count rates for Quadrant C Data is divided into 100 sec bins |
 |
 |
| Module-wise count rates for Quadrant D Data is divided into 100 sec bins |
 |
 |
| Parameter | Plot |
|---|---|
| CZT HV Monitor | 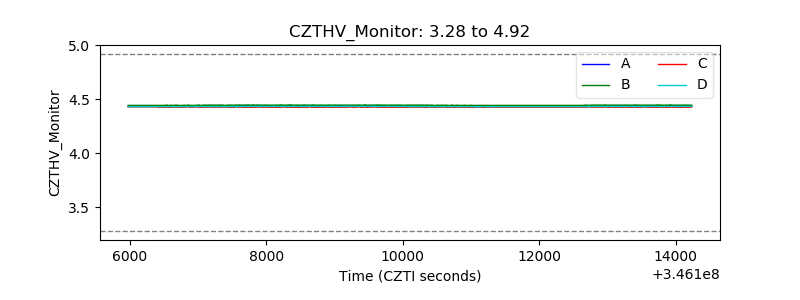 |
| D_VDD | 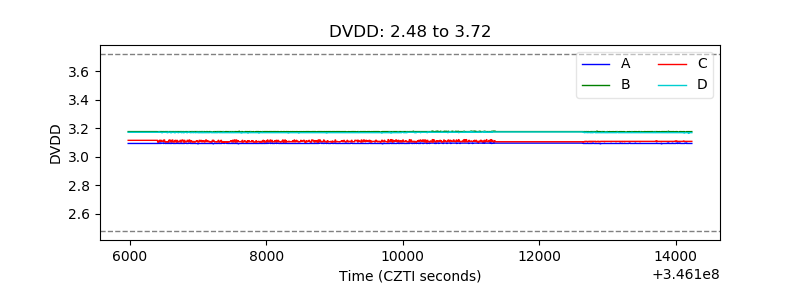 |
| Temperature 1 | 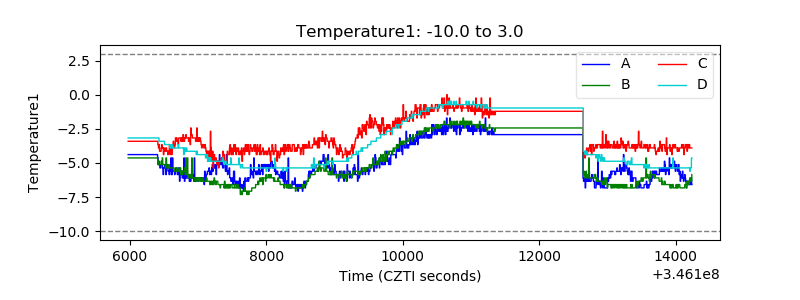 |
| Veto HV Monitor | 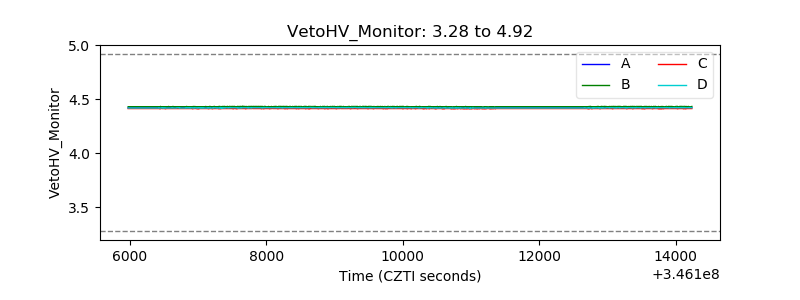 |
| Veto LLD | 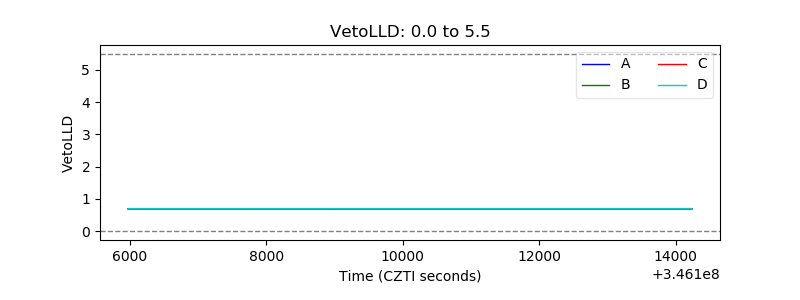 |
| Alpha Counter | 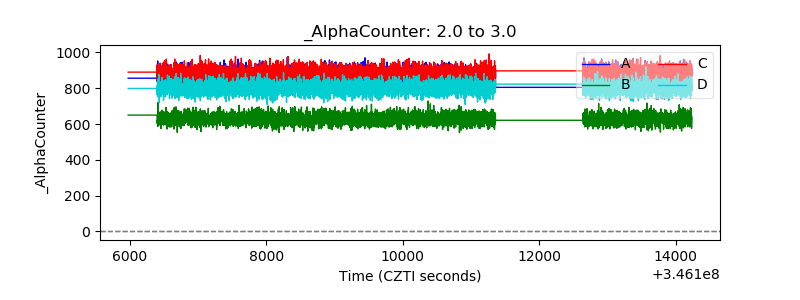 |
| _CPM_Rate | 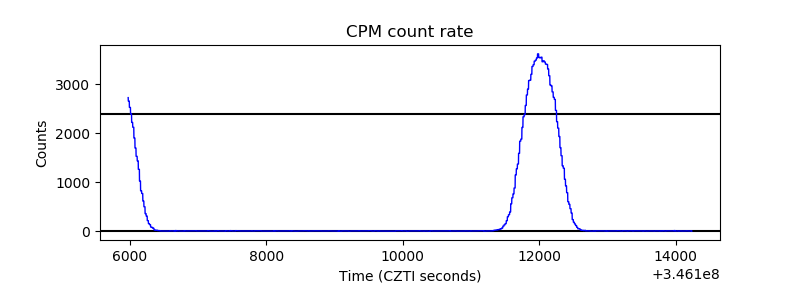 |
| CZT Counter | 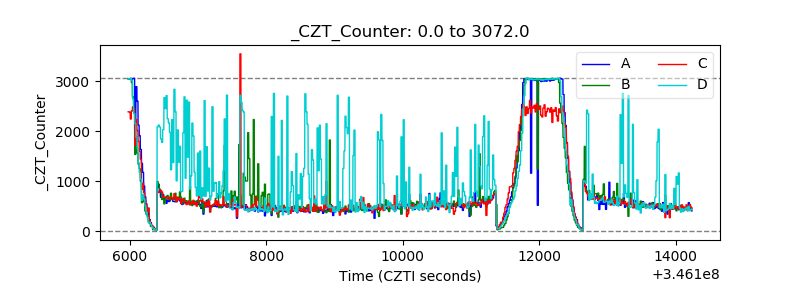 |
| +2.5 Volts monitor |  |
| +5 Volts monitor | 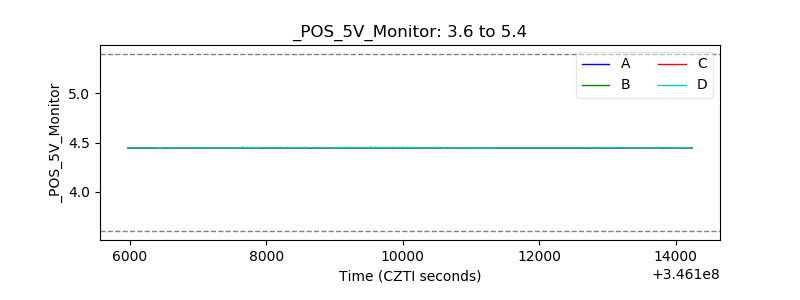 |
| _ROLL_ROT | 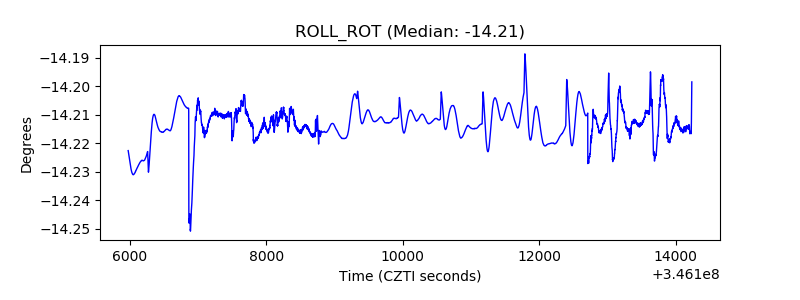 |
| _Roll_DEC | 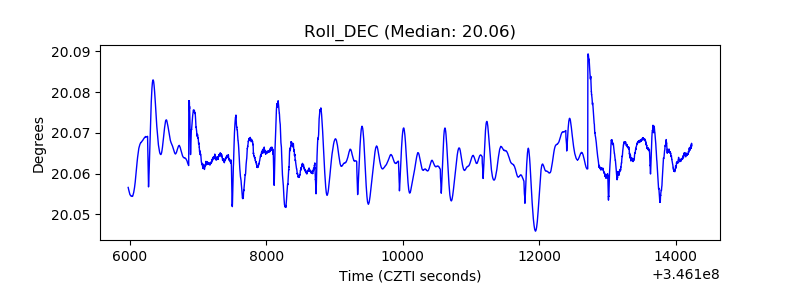 |
| _Roll_RA | 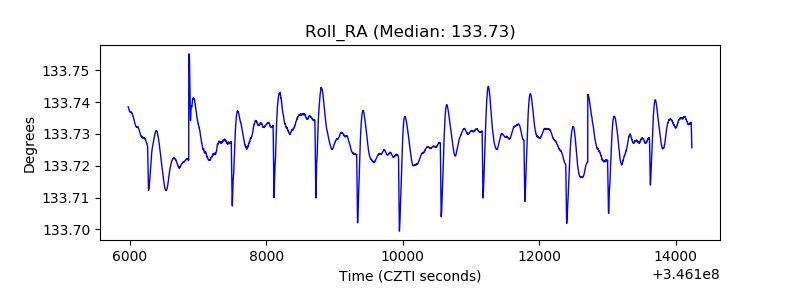 |
| Veto Counter | 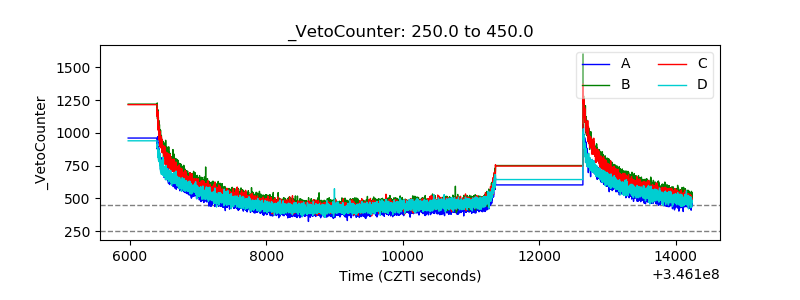 |