| Param | Original file | Final file |
|---|---|---|
| Filename | modeM0/AS1A10_067T01_9000004076_28269cztM0_level2.evt | modeM0/AS1A10_067T01_9000004076_28269cztM0_level2_quad_clean.evt |
| Size (bytes) | 550,560,960 | 112,049,280 |
| Size | 525.1 MB | 106.9 MB |
| Events in quadrant A | 3,353,682 | 760,941 |
| Events in quadrant B | 3,471,161 | 781,514 |
| Events in quadrant C | 3,379,386 | 723,234 |
| Events in quadrant D | 6,031,645 | 676,918 |
| Mode M0 | |||
|---|---|---|---|
| Quadrant | BADHDUFLAG | Total packets | Discarded packets |
| A | 0 | 13816 | 0 |
| B | 0 | 14257 | 0 |
| C | 0 | 13961 | 0 |
| D | 0 | 22316 | 0 |
| Mode M9 | |||
|---|---|---|---|
| Quadrant | BADHDUFLAG | Total packets | Discarded packets |
| A | 0 | 19 | 0 |
| B | 0 | 20 | 0 |
| C | 0 | 20 | 0 |
| D | 0 | 20 | 0 |
| Quadrant | Total seconds | Saturated seconds | Saturation percentage |
|---|---|---|---|
| A | 6469 | 35 | 0.541042% |
| B | 6468 | 59 | 0.912183% |
| C | 6468 | 87 | 1.345083% |
| D | 6468 | 505 | 7.807669% |
Noise dominated data is calculated using 1-second bins in cleaned event files. If a bin has >2000 counts, and if more than 50% of those come from <1% of pixels, then it is considered to be noise-dominated and hence unusable.
| Quadrant | # 1 sec bins | Bins with >0 counts | Bins with >2000 counts | High rate bins dominated by noise | Noise dominated (total time) | Noise dominated (detector-on time) | Marked lightcurve |
|---|---|---|---|---|---|---|---|
| A | 7809 | 6470 | 3 | 3 | 0.04% | 0.05% | 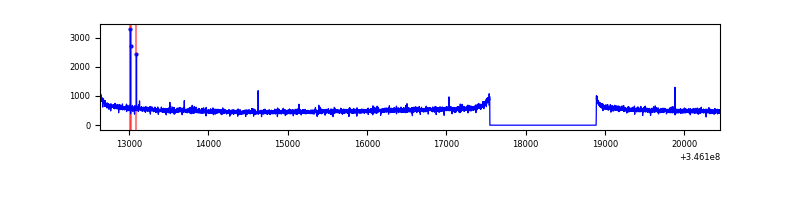 |
| B | 7808 | 6469 | 2 | 2 | 0.03% | 0.03% | 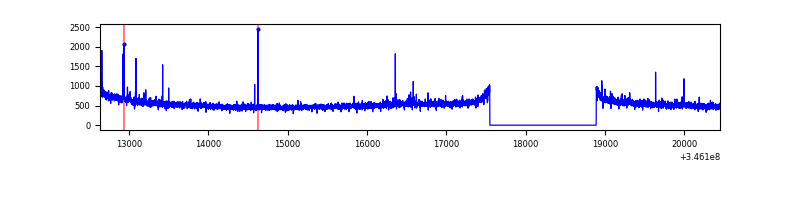 |
| C | 7808 | 6469 | 0 | 0 | 0.00% | 0.00% | 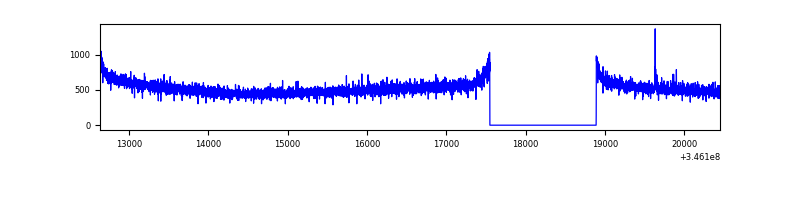 |
| D | 7808 | 6468 | 404 | 404 | 5.17% | 6.25% | 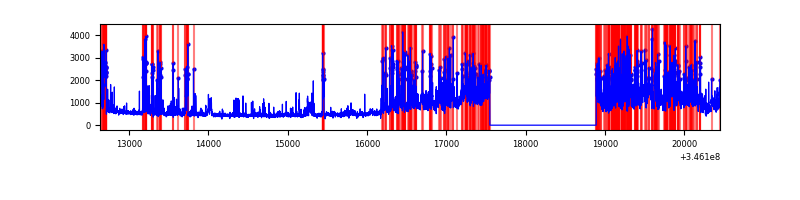 |
Top three noisy pixels from each quadrant. If the there are fewer than three noisy pixels in the level2.evt file, extra rows are filled as -1
| Pixel properties | Quadrant properties | ||||||
|---|---|---|---|---|---|---|---|
| Quadrant | DetID | PixID | Counts | Sigma | Mean | Median | Sigma |
| A | 13 | 254 | 10884 | 58.82 | 867 | 853 | 170.5 |
| A | 12 | 96 | 10631 | 57.34 | 867 | 853 | 170.5 |
| A | 3 | 137 | 7710 | 40.21 | 867 | 853 | 170.5 |
| B | 10 | 245 | 26663 | 159.15 | 871 | 851 | 162.2 |
| B | 10 | 246 | 25674 | 153.05 | 871 | 851 | 162.2 |
| B | 12 | 111 | 19446 | 114.65 | 871 | 851 | 162.2 |
| C | 14 | 238 | 137360 | 708.14 | 827 | 835 | 192.8 |
| C | 15 | 208 | 12066 | 58.25 | 827 | 835 | 192.8 |
| C | 3 | 233 | 8782 | 41.22 | 827 | 835 | 192.8 |
| D | 1 | 52 | 1849407 | 9842.04 | 799 | 779 | 187.8 |
| D | 8 | 195 | 756379 | 4022.79 | 799 | 779 | 187.8 |
| D | 7 | 238 | 107024 | 565.65 | 799 | 779 | 187.8 |
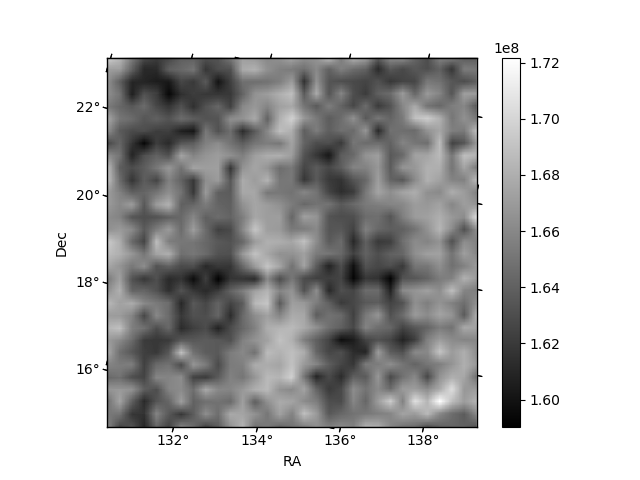
Histogram calculated using DETX and DETY for each event in the final _common_clean file
| Quadrant A | 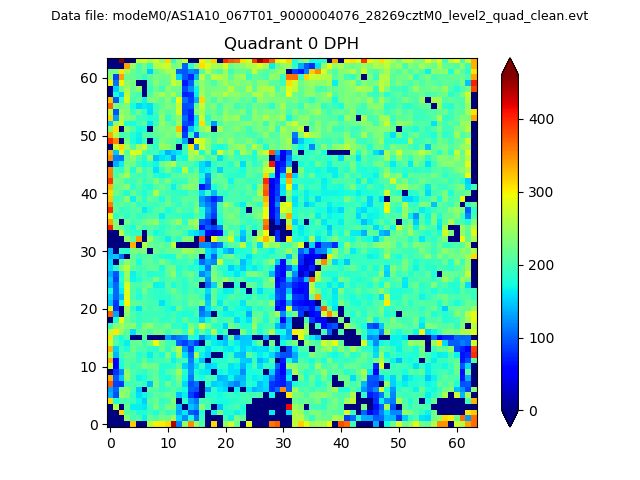 |
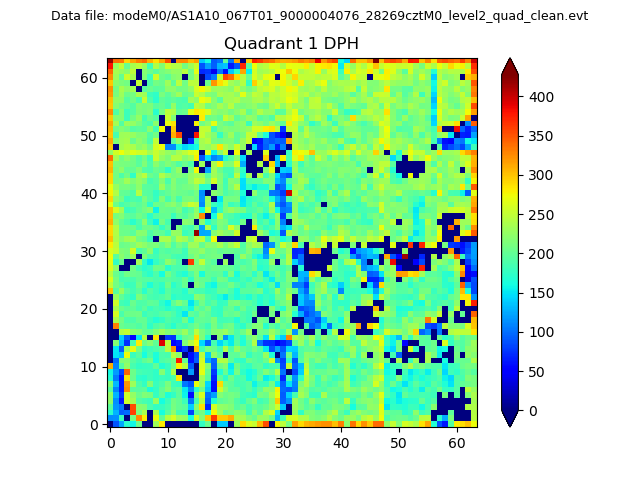 |
Quadrant B |
|---|---|---|---|
| Quadrant D | 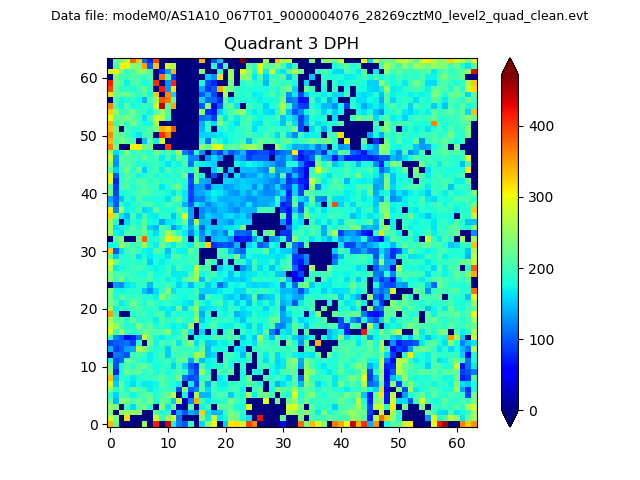 |
 |
Quadrant C |
| Plot type | Count rate plots | Images |
|---|---|---|
| Comparison with Poisson distribution Blue bars denote a histogram of data divided into 1 sec bins. Red curve is a Poisson curve with rate = median count rate of data. |
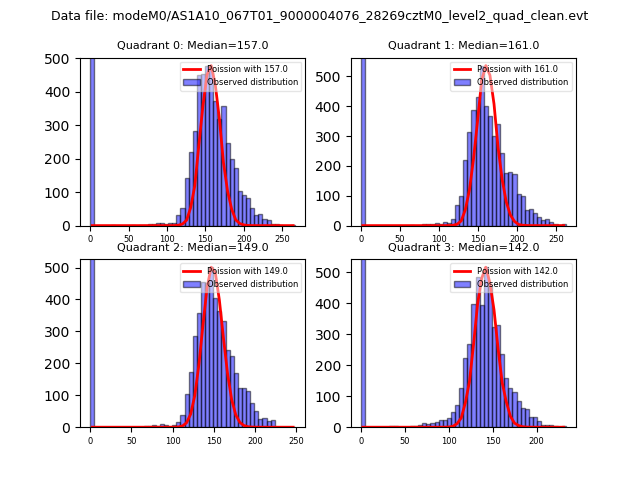 |
 |
| Quadrant-wise count rates Data is divided into 100 sec bins |
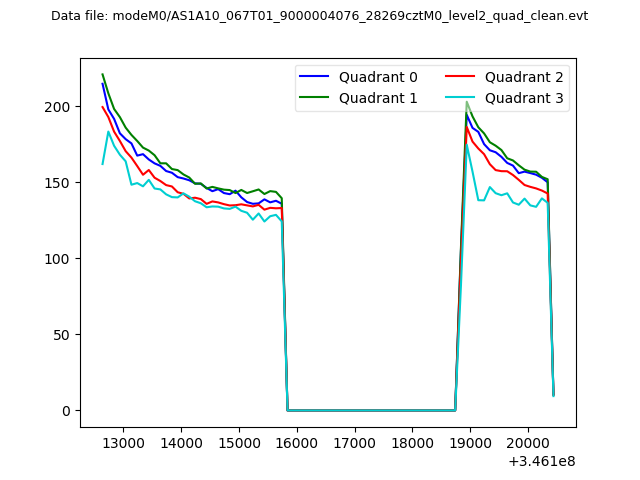 |
|
| Module-wise count rates for Quadrant A Data is divided into 100 sec bins |
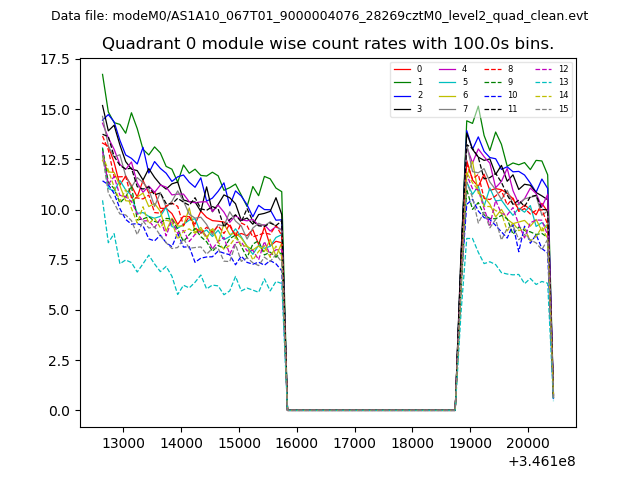 |
 |
| Module-wise count rates for Quadrant B Data is divided into 100 sec bins |
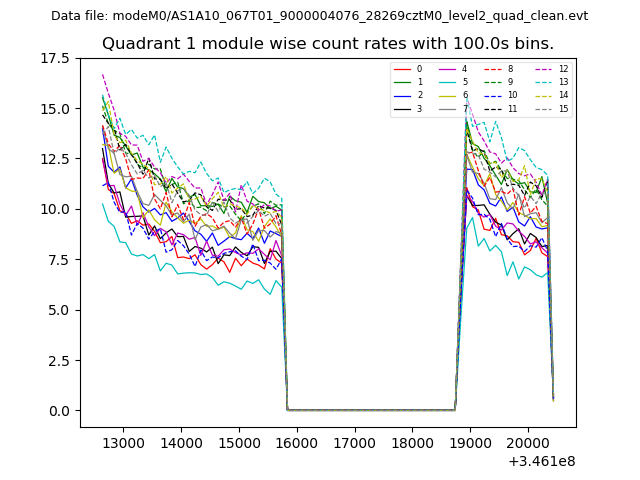 |
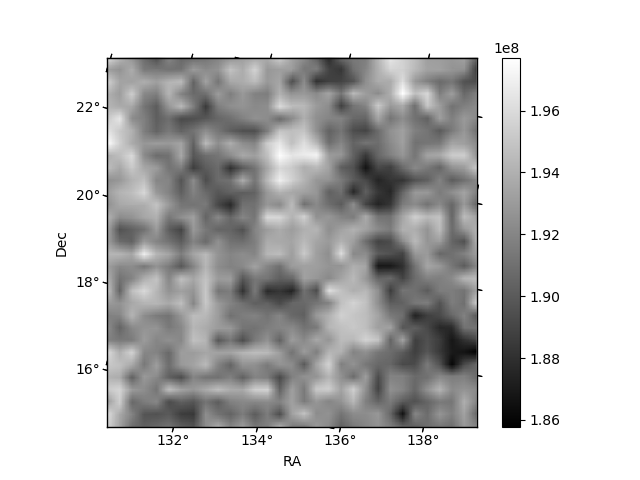 |
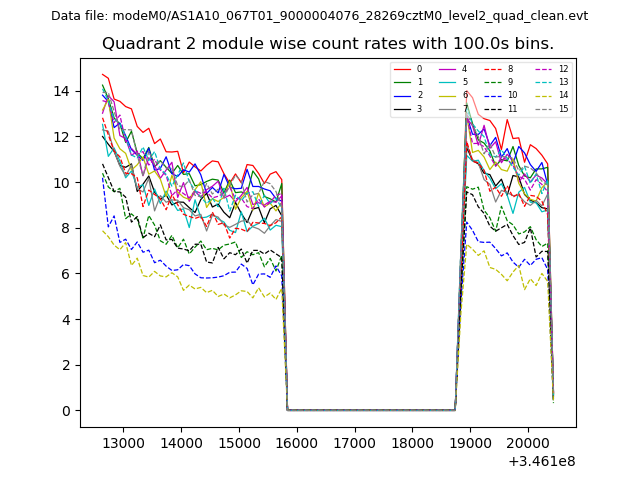
| Module-wise count rates for Quadrant C Data is divided into 100 sec bins |
 |
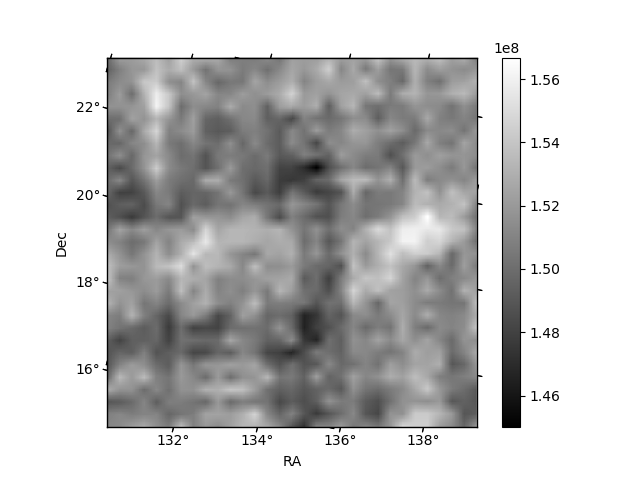 |
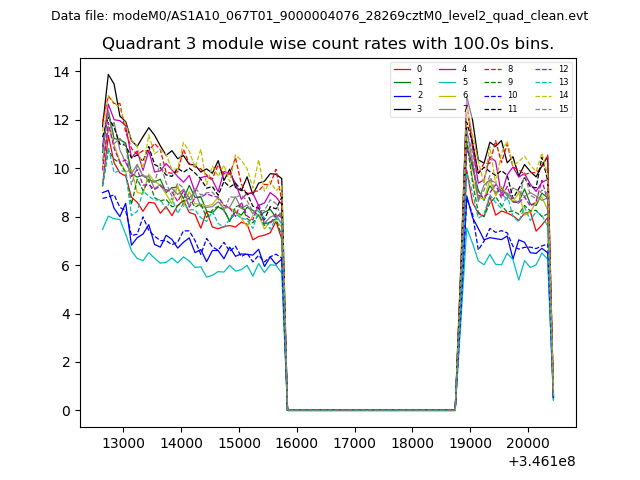
| Module-wise count rates for Quadrant D Data is divided into 100 sec bins |
 |
 |
| Parameter | Plot |
|---|---|
| CZT HV Monitor | 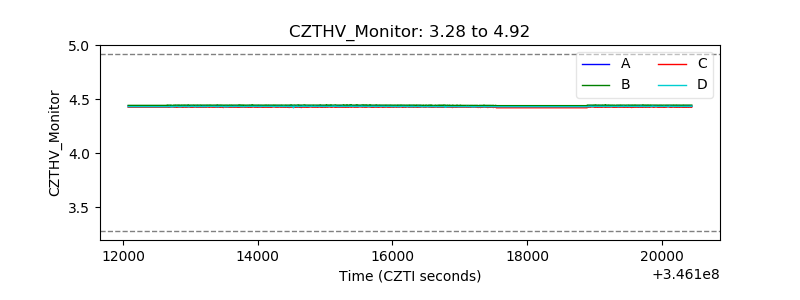 |
| D_VDD | 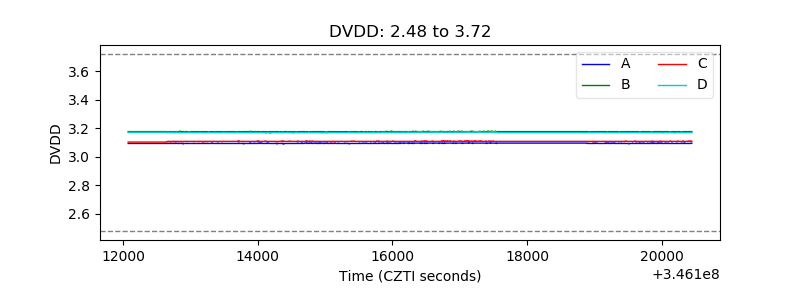 |
| Temperature 1 | 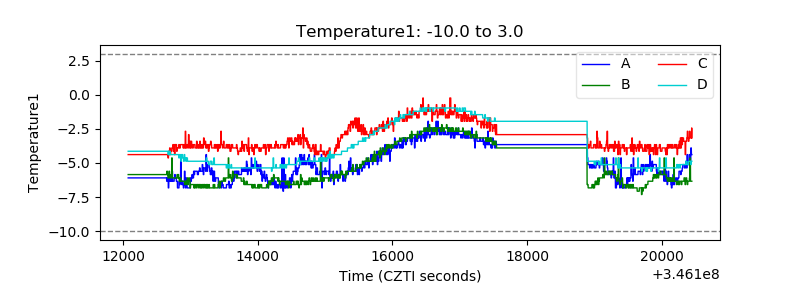 |
| Veto HV Monitor | 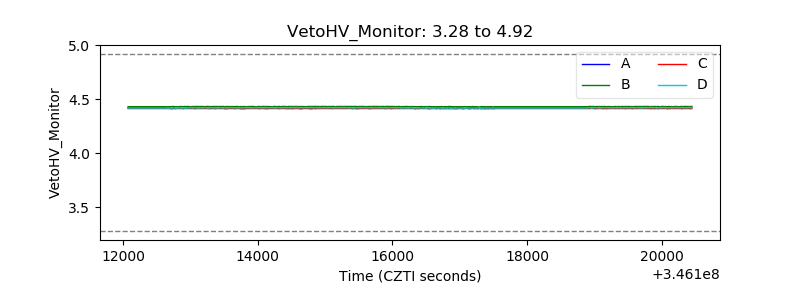 |
| Veto LLD | 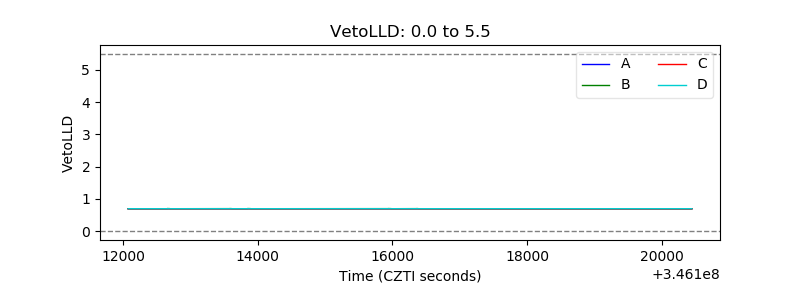 |
| Alpha Counter | 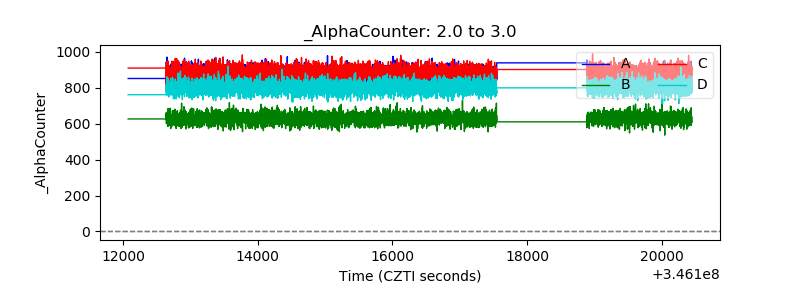 |
| _CPM_Rate | 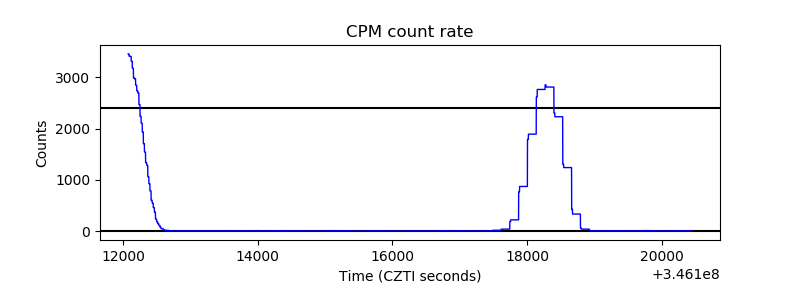 |
| CZT Counter |  |
| +2.5 Volts monitor |  |
| +5 Volts monitor |  |
| _ROLL_ROT |  |
| _Roll_DEC | 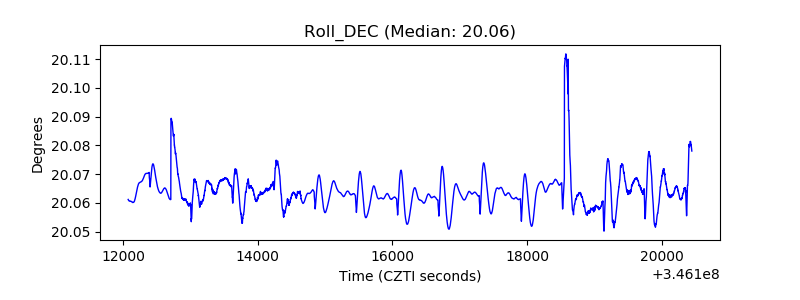 |
| _Roll_RA |  |
| Veto Counter |  |