| Param | Original file | Final file |
|---|---|---|
| Filename | modeM0/AS1A10_067T01_9000004076_28270cztM0_level2.evt | modeM0/AS1A10_067T01_9000004076_28270cztM0_level2_quad_clean.evt |
| Size (bytes) | 602,182,080 | 95,699,520 |
| Size | 574.3 MB | 91.3 MB |
| Events in quadrant A | 3,196,741 | 640,899 |
| Events in quadrant B | 3,490,925 | 651,942 |
| Events in quadrant C | 3,255,000 | 612,145 |
| Events in quadrant D | 7,867,141 | 552,081 |
| Mode M0 | |||
|---|---|---|---|
| Quadrant | BADHDUFLAG | Total packets | Discarded packets |
| A | 0 | 13159 | 0 |
| B | 0 | 14176 | 0 |
| C | 0 | 13364 | 0 |
| D | 0 | 27777 | 0 |
| Mode M9 | |||
|---|---|---|---|
| Quadrant | BADHDUFLAG | Total packets | Discarded packets |
| A | 0 | 13 | 0 |
| B | 0 | 13 | 0 |
| C | 0 | 13 | 0 |
| D | 0 | 13 | 0 |
| Quadrant | Total seconds | Saturated seconds | Saturation percentage |
|---|---|---|---|
| A | 6320 | 42 | 0.664557% |
| B | 6320 | 115 | 1.819620% |
| C | 6320 | 88 | 1.392405% |
| D | 6320 | 763 | 12.072785% |
Noise dominated data is calculated using 1-second bins in cleaned event files. If a bin has >2000 counts, and if more than 50% of those come from <1% of pixels, then it is considered to be noise-dominated and hence unusable.
| Quadrant | # 1 sec bins | Bins with >0 counts | Bins with >2000 counts | High rate bins dominated by noise | Noise dominated (total time) | Noise dominated (detector-on time) | Marked lightcurve |
|---|---|---|---|---|---|---|---|
| A | 7640 | 6321 | 0 | 0 | 0.00% | 0.00% | 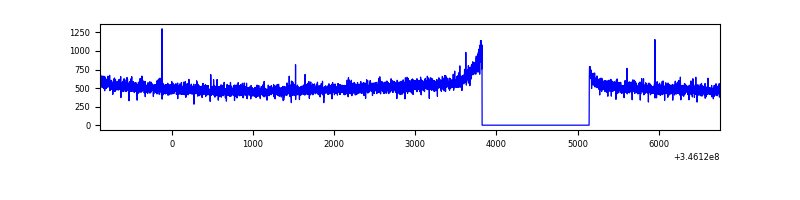 |
| B | 7640 | 6321 | 39 | 39 | 0.51% | 0.62% | 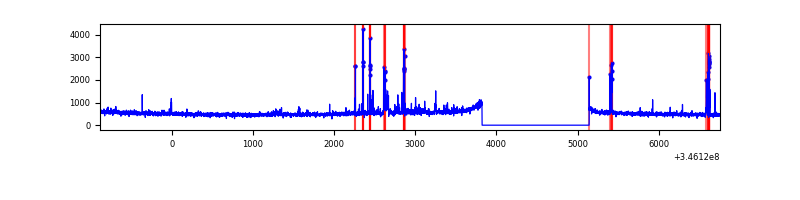 |
| C | 7640 | 6321 | 1 | 1 | 0.01% | 0.02% | 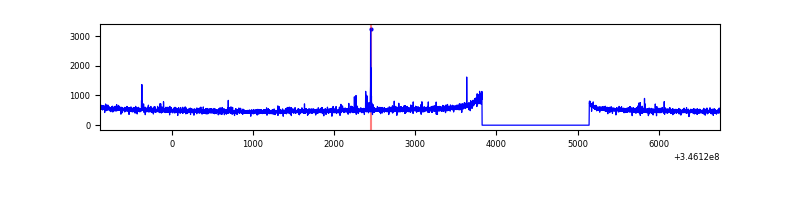 |
| D | 7640 | 6321 | 727 | 727 | 9.52% | 11.50% | 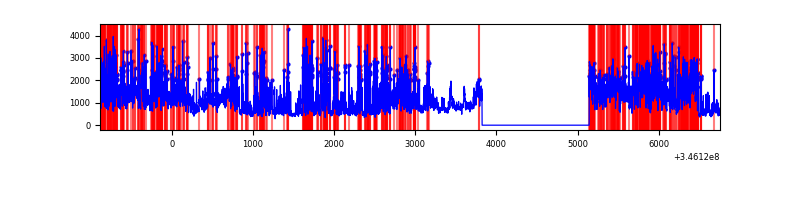 |
Top three noisy pixels from each quadrant. If the there are fewer than three noisy pixels in the level2.evt file, extra rows are filled as -1
| Pixel properties | Quadrant properties | ||||||
|---|---|---|---|---|---|---|---|
| Quadrant | DetID | PixID | Counts | Sigma | Mean | Median | Sigma |
| A | 13 | 254 | 10183 | 56.82 | 829 | 816 | 164.9 |
| A | 3 | 137 | 7654 | 41.48 | 829 | 816 | 164.9 |
| A | 0 | 226 | 7131 | 38.31 | 829 | 816 | 164.9 |
| B | 10 | 245 | 138862 | 890.52 | 822 | 804 | 155.0 |
| B | 10 | 246 | 113700 | 728.21 | 822 | 804 | 155.0 |
| B | 12 | 111 | 18460 | 113.88 | 822 | 804 | 155.0 |
| C | 14 | 238 | 129740 | 701.83 | 790 | 796 | 183.7 |
| C | 3 | 233 | 44586 | 238.34 | 790 | 796 | 183.7 |
| C | 15 | 208 | 6014 | 28.4 | 790 | 796 | 183.7 |
| D | 1 | 52 | 4375633 | 24707.46 | 760 | 744 | 177.1 |
| D | 8 | 195 | 579435 | 3268.19 | 760 | 744 | 177.1 |
| D | 2 | 250 | 24479 | 134.04 | 760 | 744 | 177.1 |
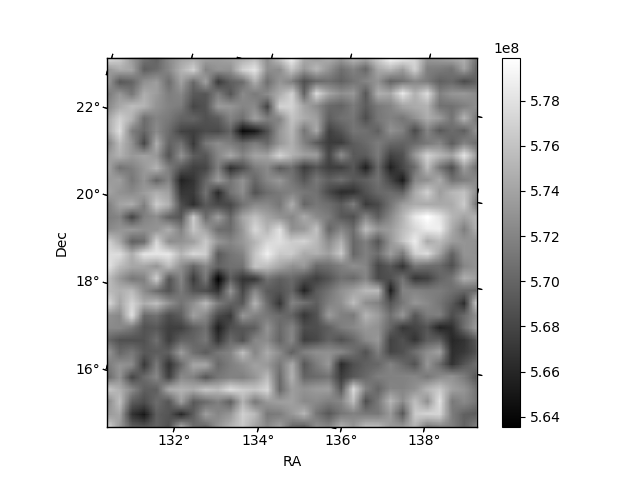
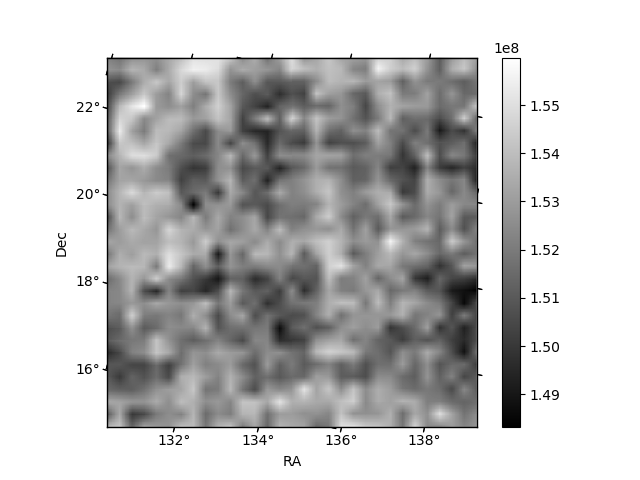
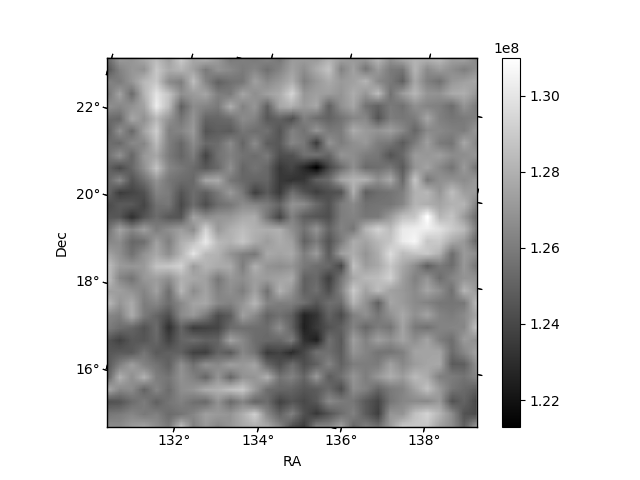
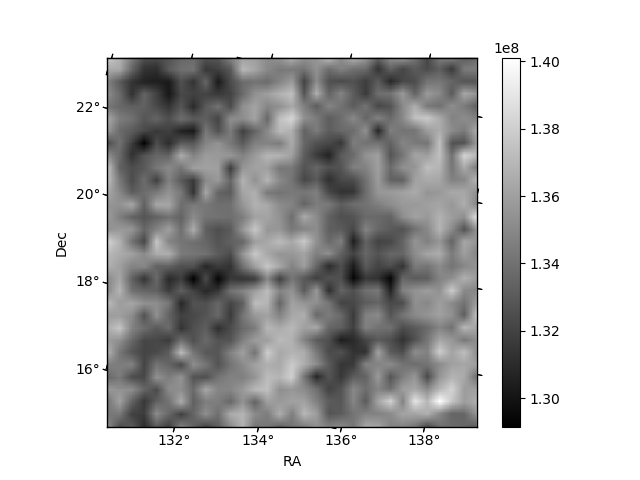
Histogram calculated using DETX and DETY for each event in the final _common_clean file
| Quadrant A |  |
 |
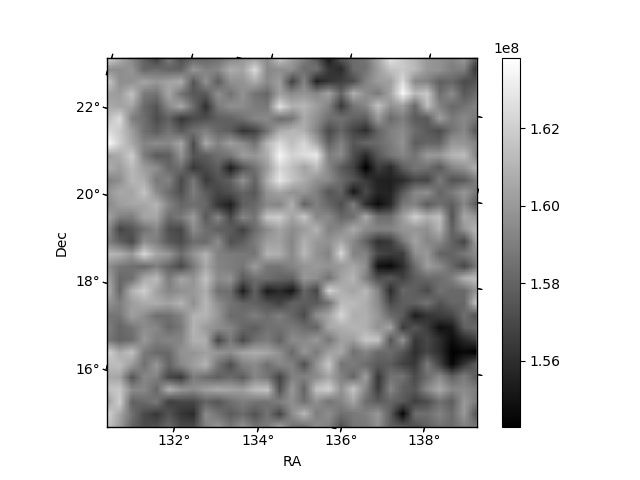
Quadrant B |
|---|---|---|---|
| Quadrant D |  |
 |
Quadrant C |
| Plot type | Count rate plots | Images |
|---|---|---|
| Comparison with Poisson distribution Blue bars denote a histogram of data divided into 1 sec bins. Red curve is a Poisson curve with rate = median count rate of data. |
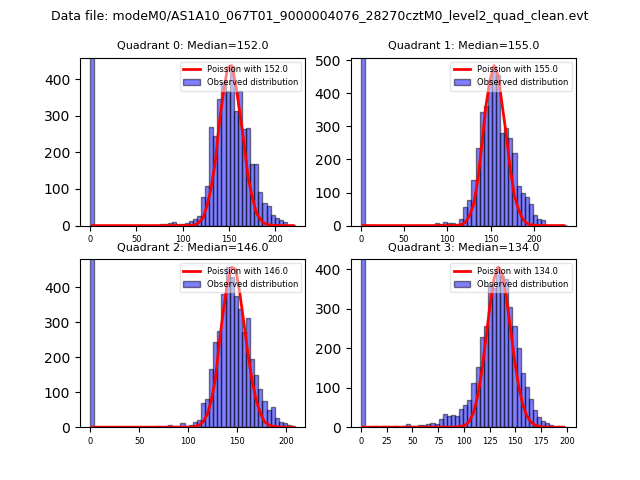 |
 |
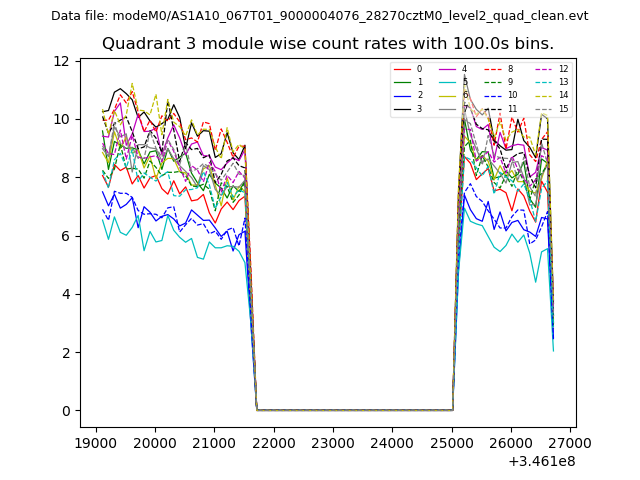
| Quadrant-wise count rates Data is divided into 100 sec bins |
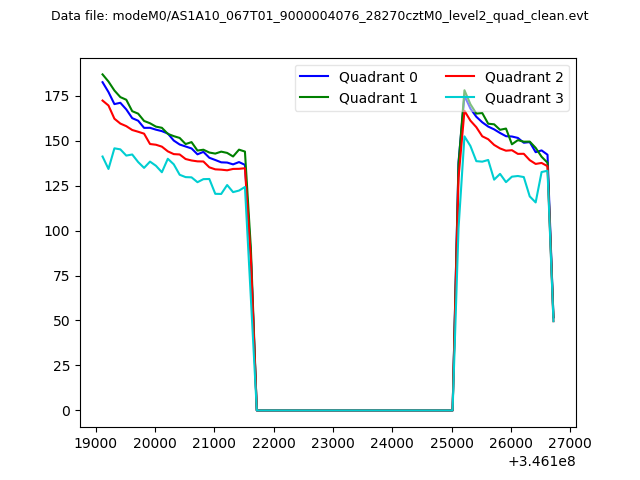 |
|
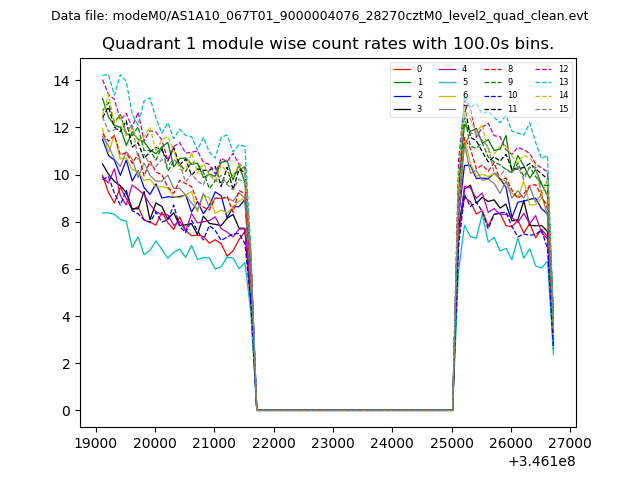
| Module-wise count rates for Quadrant A Data is divided into 100 sec bins |
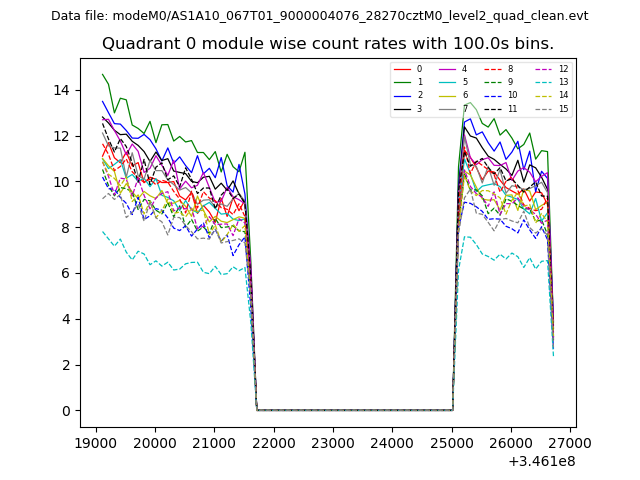 |
 |
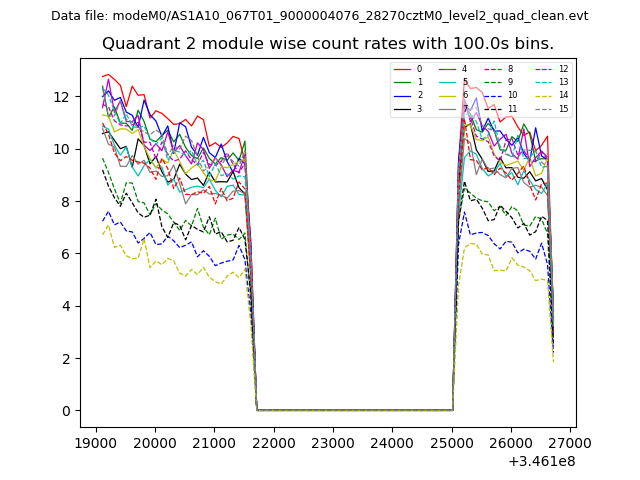
| Module-wise count rates for Quadrant B Data is divided into 100 sec bins |
 |
 |
| Module-wise count rates for Quadrant C Data is divided into 100 sec bins |
 |
 |
| Module-wise count rates for Quadrant D Data is divided into 100 sec bins |
 |
 |
| Parameter | Plot |
|---|---|
| CZT HV Monitor | 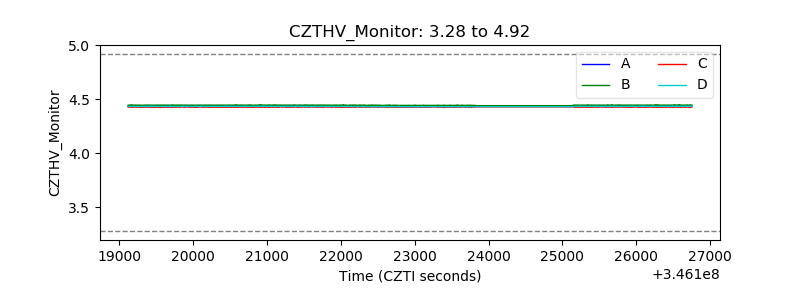 |
| D_VDD | 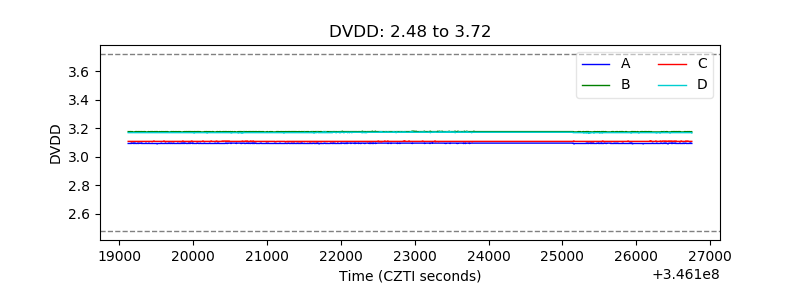 |
| Temperature 1 | 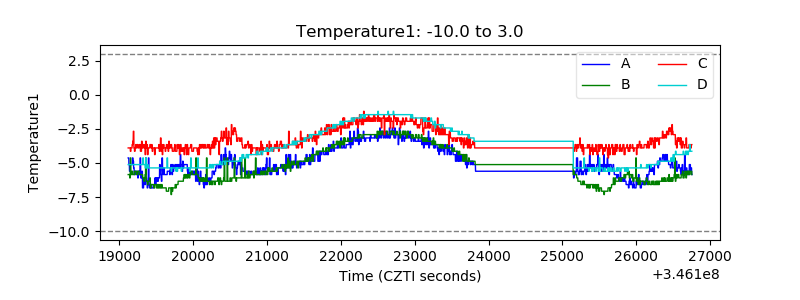 |
| Veto HV Monitor |  |
| Veto LLD | 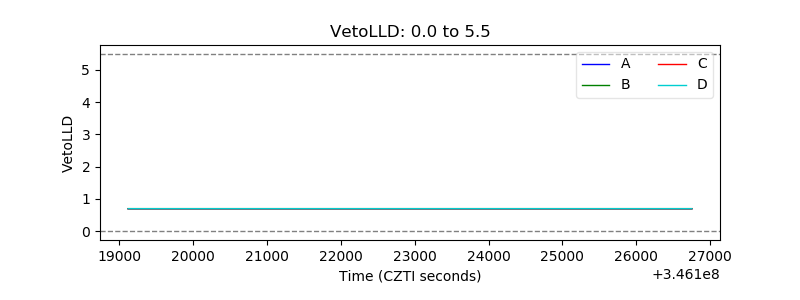 |
| Alpha Counter | 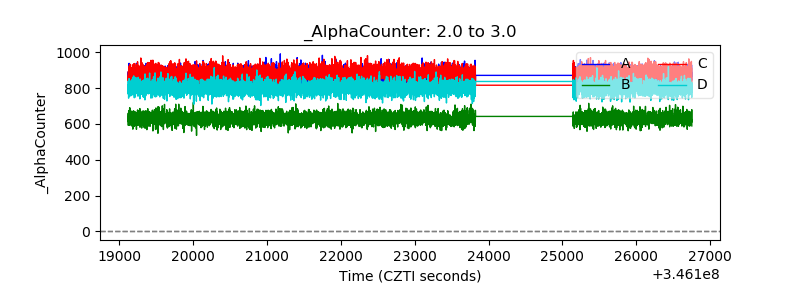 |
| _CPM_Rate | 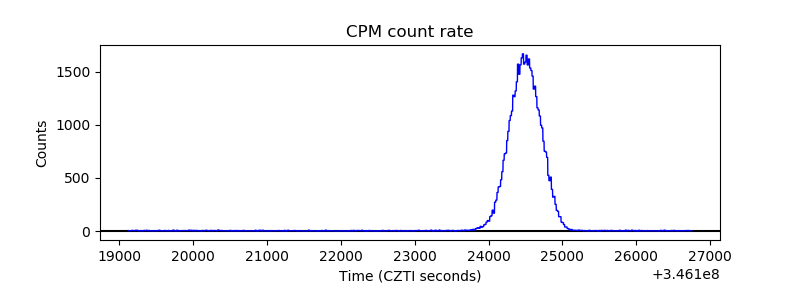 |
| CZT Counter | 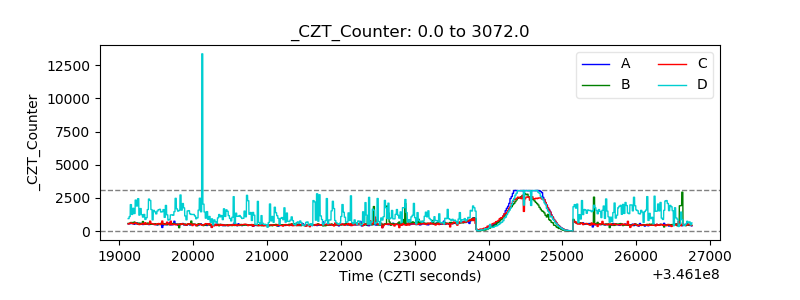 |
| +2.5 Volts monitor |  |
| +5 Volts monitor | 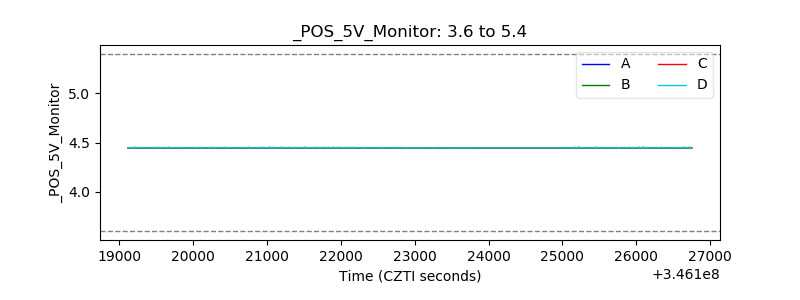 |
| _ROLL_ROT | 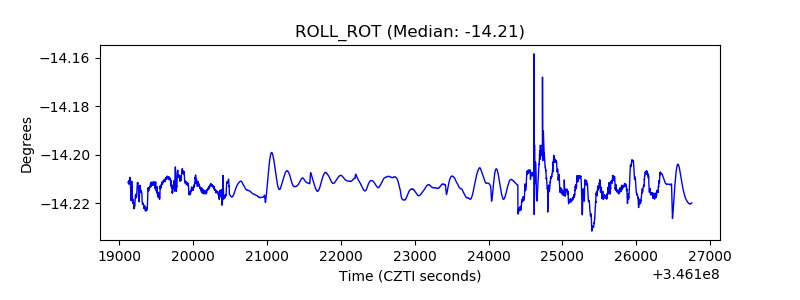 |
| _Roll_DEC |  |
| _Roll_RA | 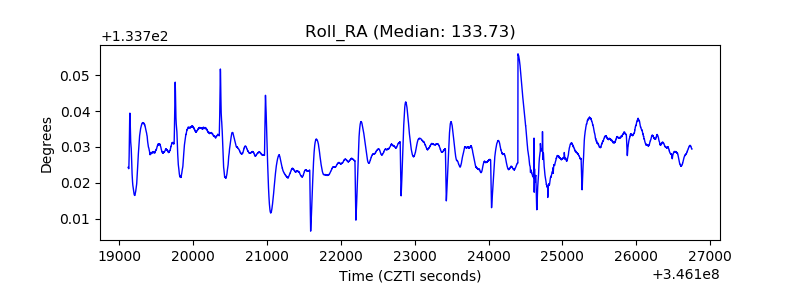 |
| Veto Counter | 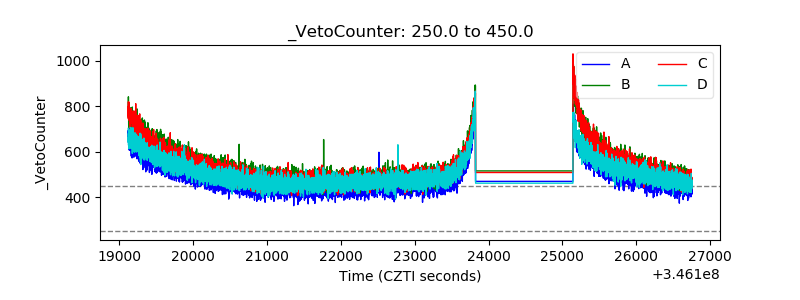 |