| Param | Original file | Final file |
|---|---|---|
| Filename | modeM0/AS1A10_067T01_9000004076_28271cztM0_level2.evt | modeM0/AS1A10_067T01_9000004076_28271cztM0_level2_quad_clean.evt |
| Size (bytes) | 2,453,063,040 | 386,274,240 |
| Size | 2.3 GB | 368.4 MB |
| Events in quadrant A | 13,204,466 | 2,607,607 |
| Events in quadrant B | 14,907,137 | 2,651,068 |
| Events in quadrant C | 13,508,624 | 2,487,984 |
| Events in quadrant D | 30,900,866 | 2,142,975 |
| Mode M0 | |||
|---|---|---|---|
| Quadrant | BADHDUFLAG | Total packets | Discarded packets |
| A | 0 | 55338 | 0 |
| B | 0 | 60746 | 0 |
| C | 0 | 56291 | 0 |
| D | 0 | 109861 | 0 |
| Mode M9 | |||
|---|---|---|---|
| Quadrant | BADHDUFLAG | Total packets | Discarded packets |
| A | 0 | 63 | 0 |
| B | 0 | 63 | 0 |
| C | 0 | 63 | 0 |
| D | 0 | 63 | 0 |
| Quadrant | Total seconds | Saturated seconds | Saturation percentage |
|---|---|---|---|
| A | 26315 | 182 | 0.691621% |
| B | 26316 | 558 | 2.120383% |
| C | 26316 | 380 | 1.443988% |
| D | 26316 | 4888 | 18.574251% |
Noise dominated data is calculated using 1-second bins in cleaned event files. If a bin has >2000 counts, and if more than 50% of those come from <1% of pixels, then it is considered to be noise-dominated and hence unusable.
| Quadrant | # 1 sec bins | Bins with >0 counts | Bins with >2000 counts | High rate bins dominated by noise | Noise dominated (total time) | Noise dominated (detector-on time) | Marked lightcurve |
|---|---|---|---|---|---|---|---|
| A | 32565 | 26320 | 8 | 8 | 0.02% | 0.03% | 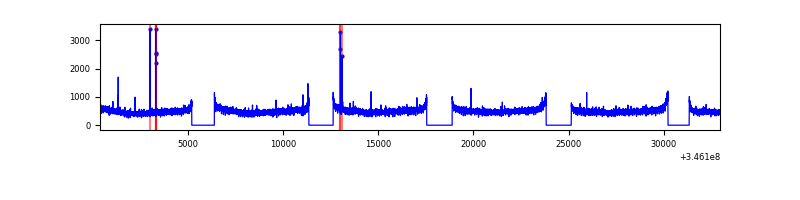 |
| B | 32566 | 26321 | 212 | 212 | 0.65% | 0.81% | 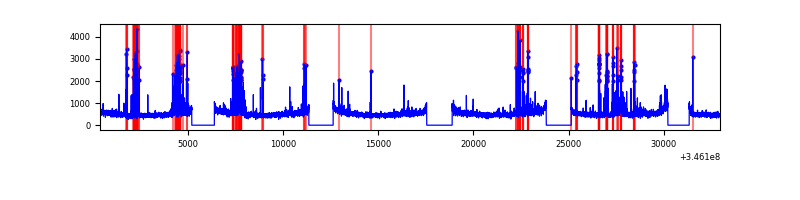 |
| C | 32566 | 26321 | 11 | 11 | 0.03% | 0.04% | 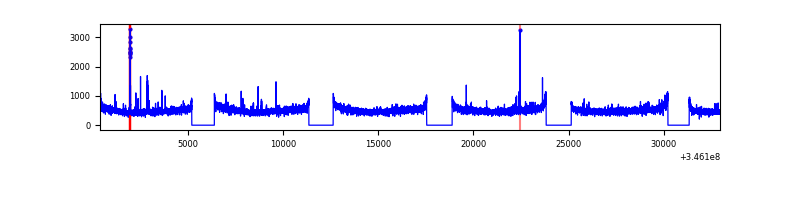 |
| D | 32565 | 26318 | 4513 | 4513 | 13.86% | 17.15% | 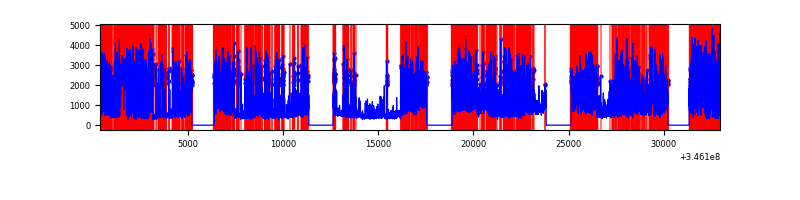 |
Top three noisy pixels from each quadrant. If the there are fewer than three noisy pixels in the level2.evt file, extra rows are filled as -1
| Pixel properties | Quadrant properties | ||||||
|---|---|---|---|---|---|---|---|
| Quadrant | DetID | PixID | Counts | Sigma | Mean | Median | Sigma |
| A | 13 | 254 | 42539 | 58.34 | 3417 | 3363 | 671.5 |
| A | 12 | 96 | 33243 | 44.49 | 3417 | 3363 | 671.5 |
| A | 3 | 137 | 31770 | 42.3 | 3417 | 3363 | 671.5 |
| B | 10 | 245 | 1073333 | 1692.64 | 3389 | 3304 | 632.2 |
| B | 10 | 246 | 502266 | 789.29 | 3389 | 3304 | 632.2 |
| B | 12 | 111 | 77708 | 117.7 | 3389 | 3304 | 632.2 |
| C | 14 | 238 | 531604 | 698.38 | 3262 | 3288 | 756.5 |
| C | 3 | 233 | 173622 | 225.16 | 3262 | 3288 | 756.5 |
| C | 2 | 16 | 60399 | 75.49 | 3262 | 3288 | 756.5 |
| D | 1 | 52 | 16533006 | 23572.92 | 3014 | 2944 | 701.2 |
| D | 8 | 195 | 1898780 | 2703.58 | 3014 | 2944 | 701.2 |
| D | 2 | 250 | 423928 | 600.35 | 3014 | 2944 | 701.2 |
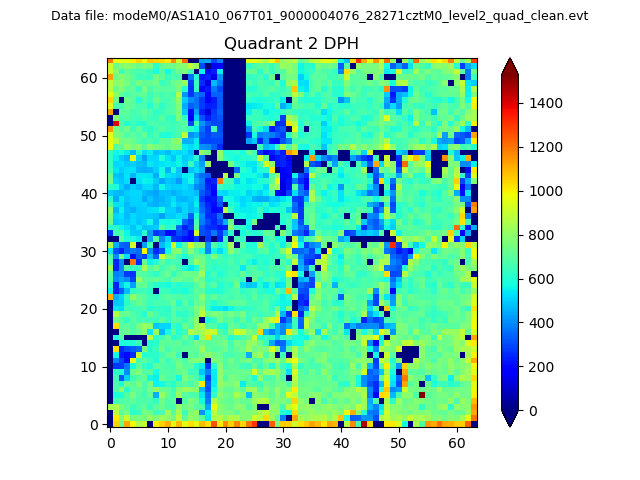
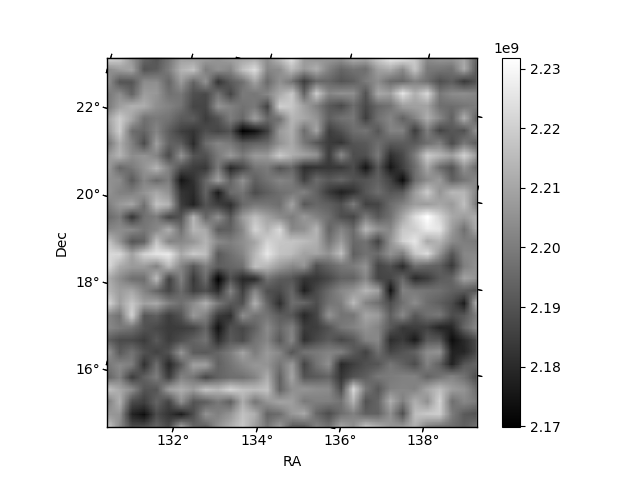
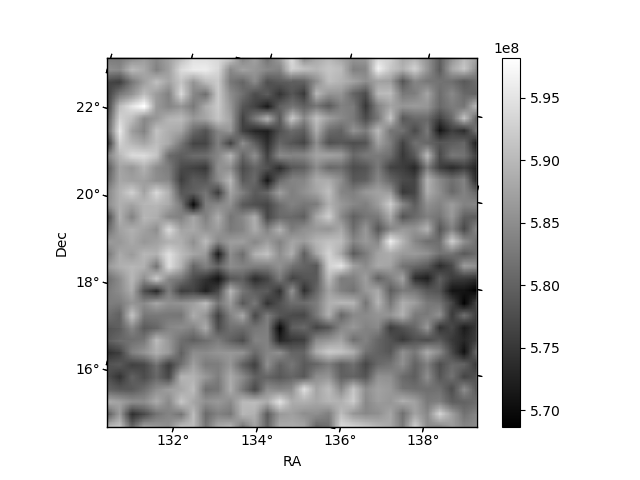
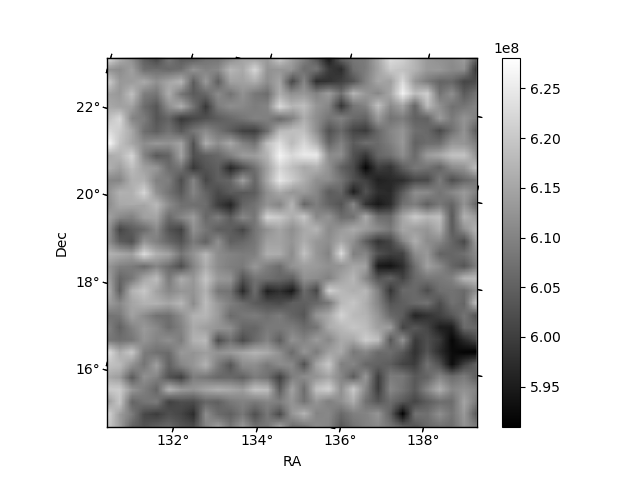
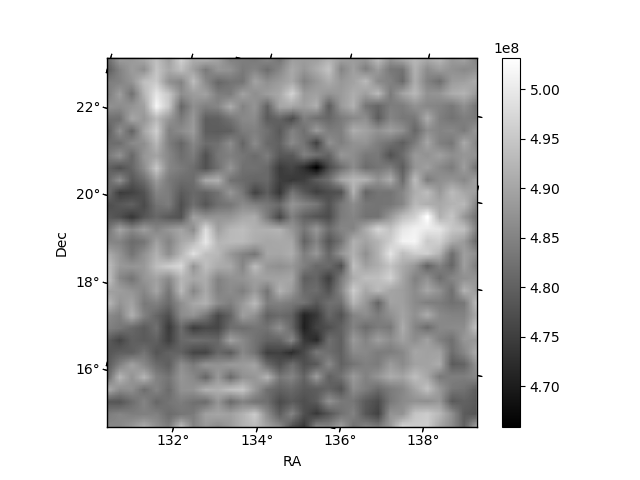
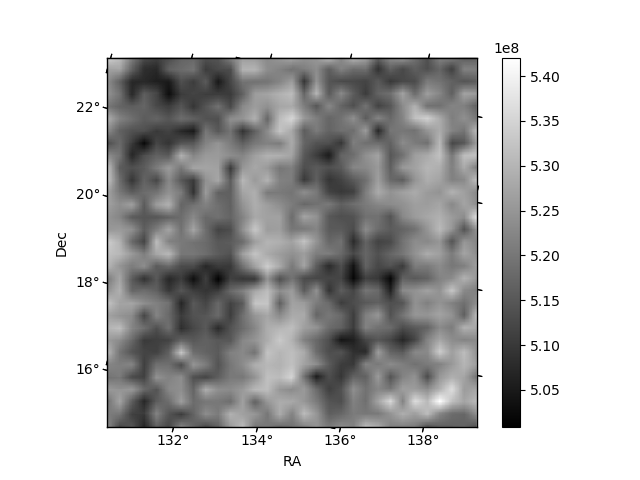
Histogram calculated using DETX and DETY for each event in the final _common_clean file
| Quadrant A | 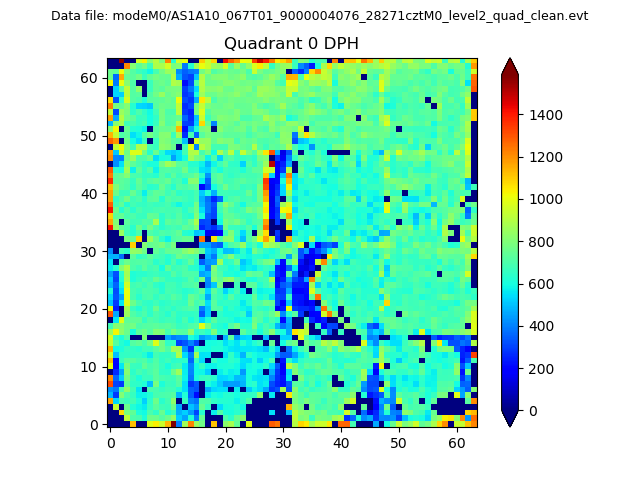 |
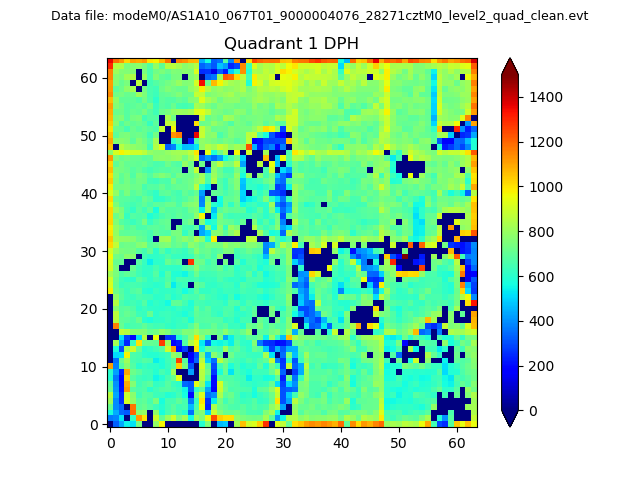 |
Quadrant B |
|---|---|---|---|
| Quadrant D | 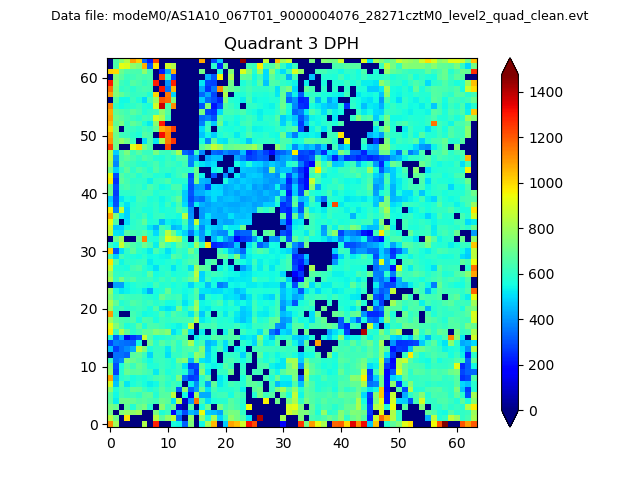 |
 |
Quadrant C |
| Plot type | Count rate plots | Images |
|---|---|---|
| Comparison with Poisson distribution Blue bars denote a histogram of data divided into 1 sec bins. Red curve is a Poisson curve with rate = median count rate of data. |
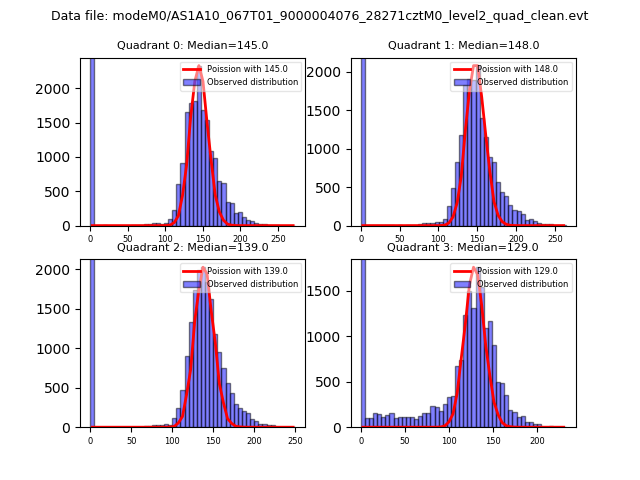 |
 |
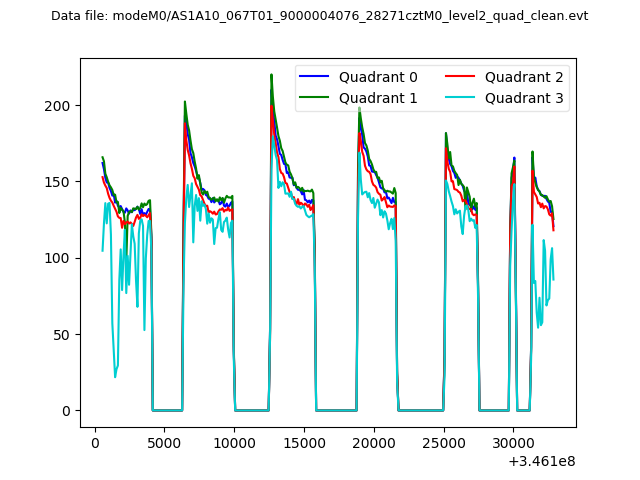
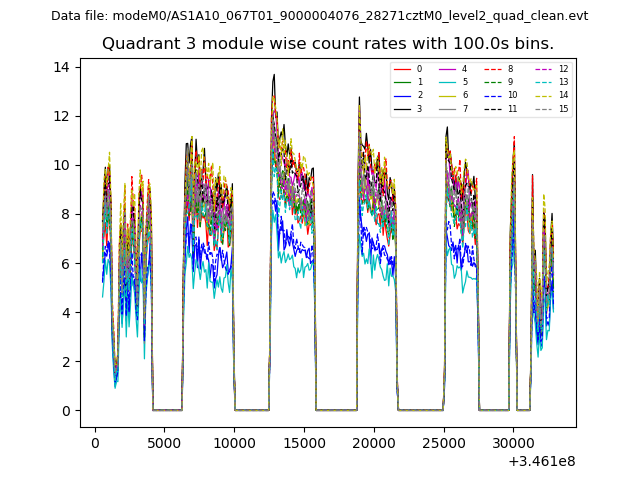
| Quadrant-wise count rates Data is divided into 100 sec bins |
 |
|
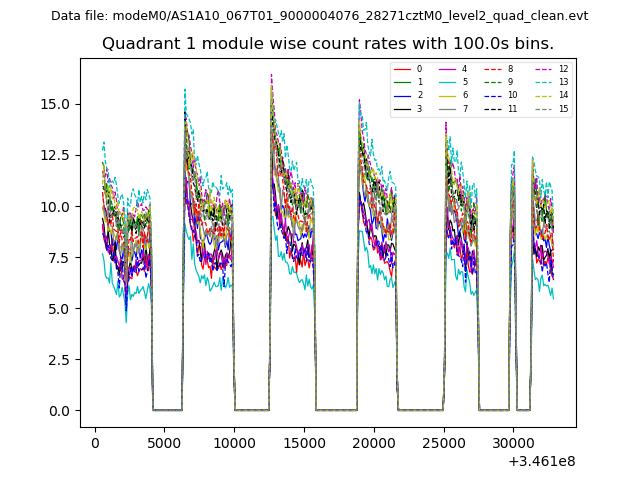
| Module-wise count rates for Quadrant A Data is divided into 100 sec bins |
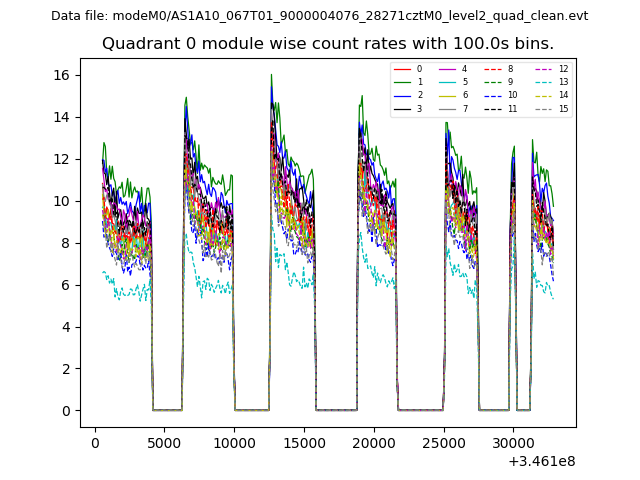 |
 |
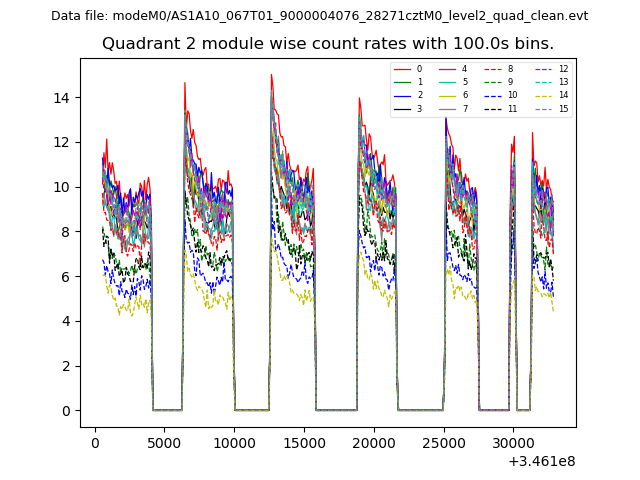
| Module-wise count rates for Quadrant B Data is divided into 100 sec bins |
 |
 |
| Module-wise count rates for Quadrant C Data is divided into 100 sec bins |
 |
 |
| Module-wise count rates for Quadrant D Data is divided into 100 sec bins |
 |
 |
| Parameter | Plot |
|---|---|
| CZT HV Monitor | 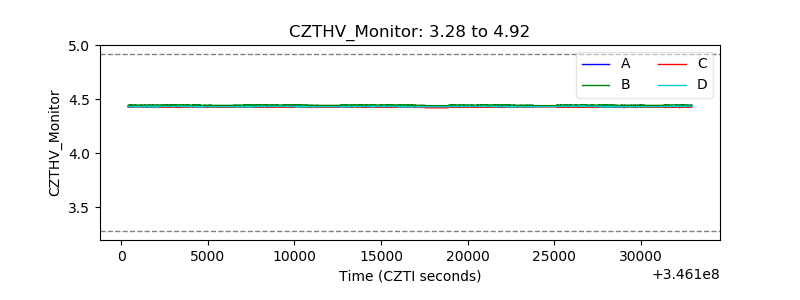 |
| D_VDD | 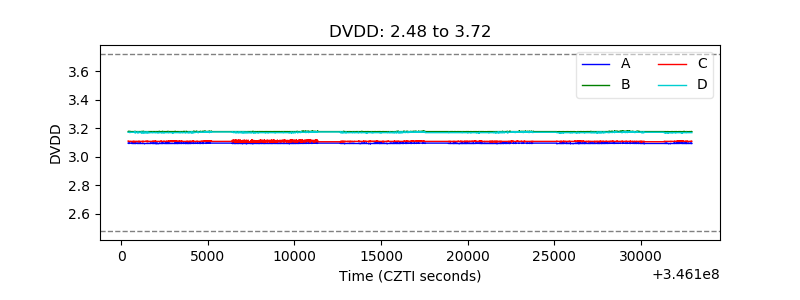 |
| Temperature 1 | 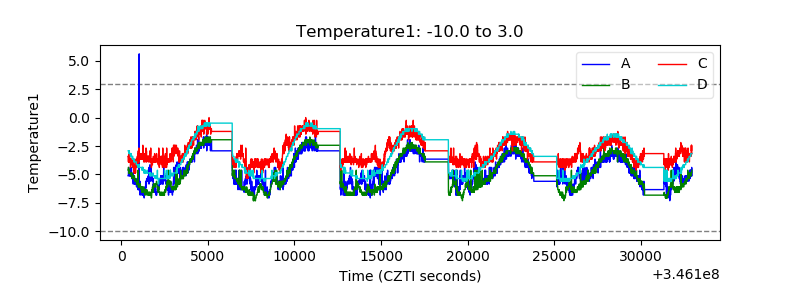 |
| Veto HV Monitor | 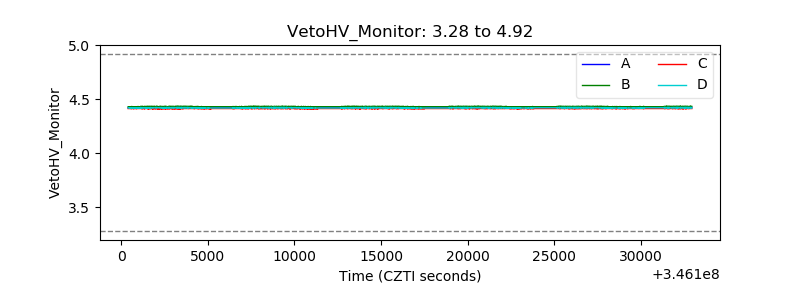 |
| Veto LLD | 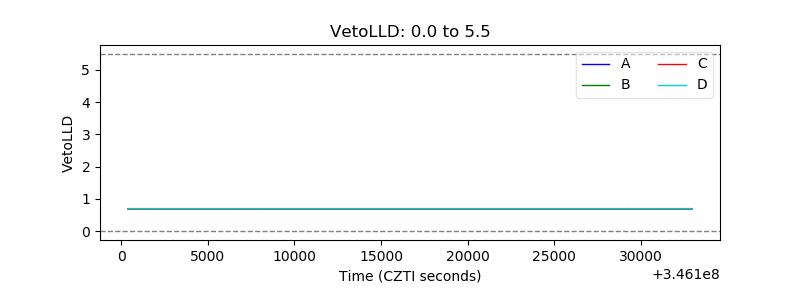 |
| Alpha Counter | 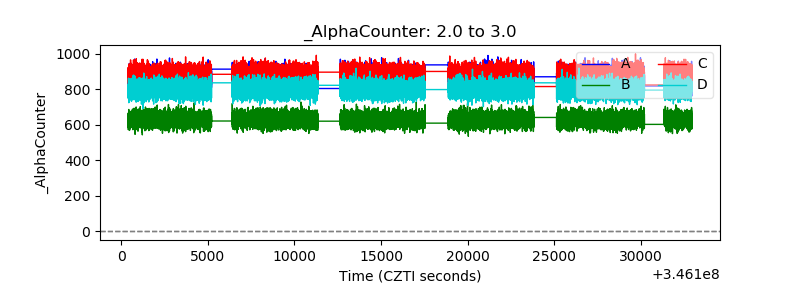 |
| _CPM_Rate | 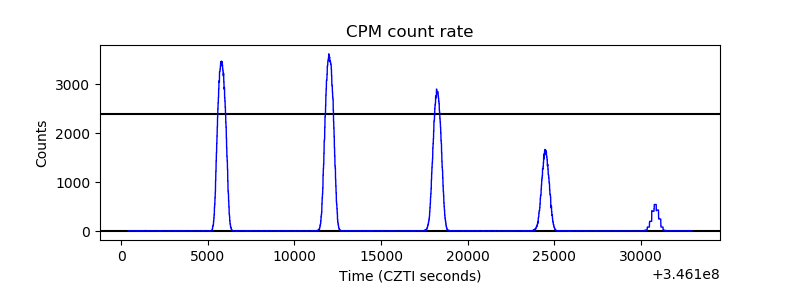 |
| CZT Counter | 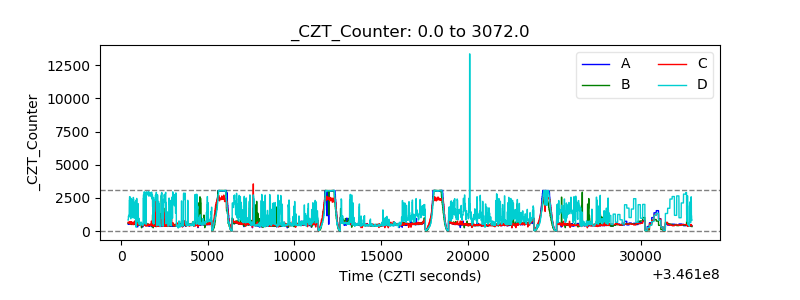 |
| +2.5 Volts monitor |  |
| +5 Volts monitor |  |
| _ROLL_ROT | 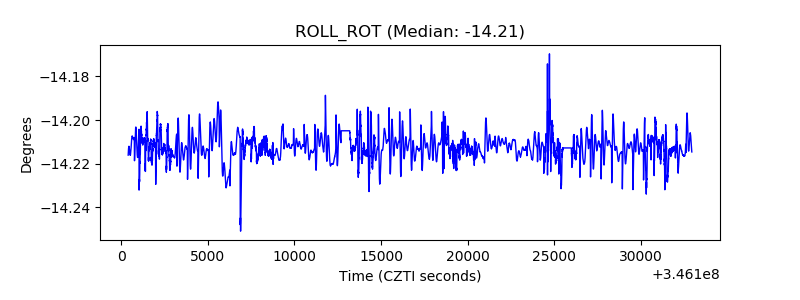 |
| _Roll_DEC | 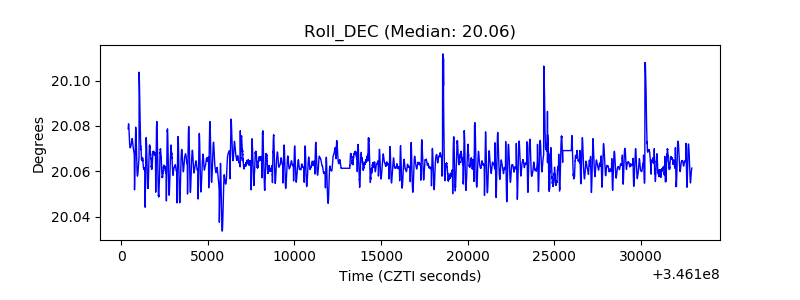 |
| _Roll_RA | 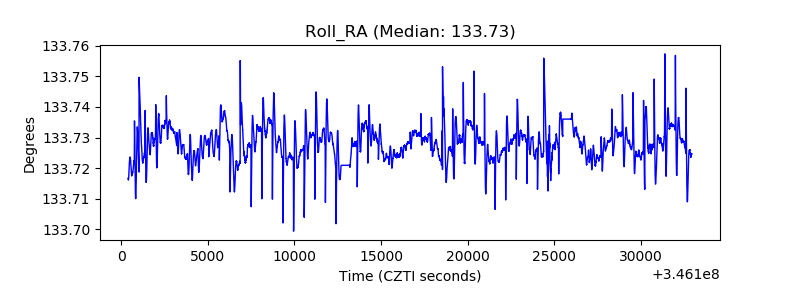 |
| Veto Counter | 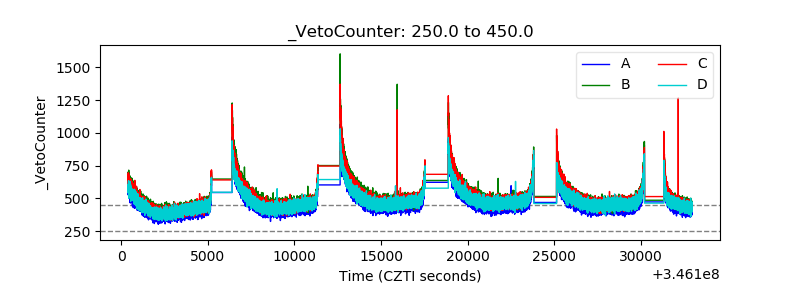 |