| Param | Original file | Final file |
|---|---|---|
| Filename | modeM0/AS1A10_067T01_9000004076_28272cztM0_level2.evt | modeM0/AS1A10_067T01_9000004076_28272cztM0_level2_quad_clean.evt |
| Size (bytes) | 654,960,960 | 92,255,040 |
| Size | 624.6 MB | 88.0 MB |
| Events in quadrant A | 3,274,296 | 619,368 |
| Events in quadrant B | 3,431,981 | 627,157 |
| Events in quadrant C | 3,365,083 | 593,177 |
| Events in quadrant D | 9,306,130 | 481,984 |
| Mode M0 | |||
|---|---|---|---|
| Quadrant | BADHDUFLAG | Total packets | Discarded packets |
| A | 0 | 13848 | 0 |
| B | 0 | 14299 | 0 |
| C | 0 | 14100 | 0 |
| D | 0 | 32379 | 0 |
| Mode M9 | |||
|---|---|---|---|
| Quadrant | BADHDUFLAG | Total packets | Discarded packets |
| A | 0 | 9 | 0 |
| B | 0 | 9 | 0 |
| C | 0 | 9 | 0 |
| D | 0 | 9 | 0 |
| Quadrant | Total seconds | Saturated seconds | Saturation percentage |
|---|---|---|---|
| A | 6770 | 63 | 0.930576% |
| B | 6771 | 75 | 1.107665% |
| C | 6771 | 98 | 1.447349% |
| D | 6770 | 2029 | 29.970458% |
Noise dominated data is calculated using 1-second bins in cleaned event files. If a bin has >2000 counts, and if more than 50% of those come from <1% of pixels, then it is considered to be noise-dominated and hence unusable.
| Quadrant | # 1 sec bins | Bins with >0 counts | Bins with >2000 counts | High rate bins dominated by noise | Noise dominated (total time) | Noise dominated (detector-on time) | Marked lightcurve |
|---|---|---|---|---|---|---|---|
| A | 7590 | 6771 | 0 | 0 | 0.00% | 0.00% | 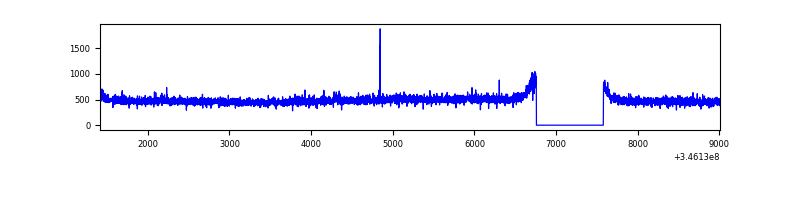 |
| B | 7591 | 6771 | 3 | 3 | 0.04% | 0.04% | 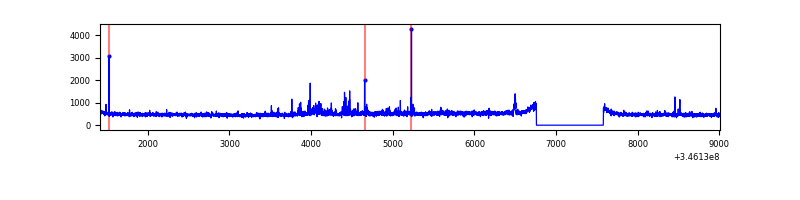 |
| C | 7591 | 6772 | 1 | 1 | 0.01% | 0.01% | 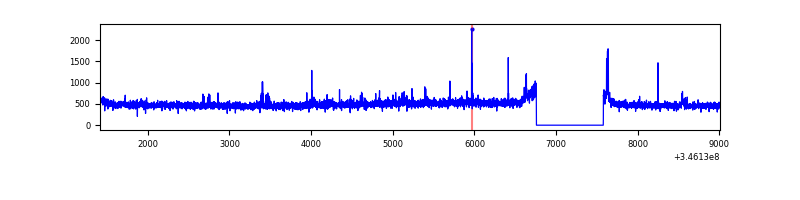 |
| D | 7590 | 6771 | 1827 | 1827 | 24.07% | 26.98% | 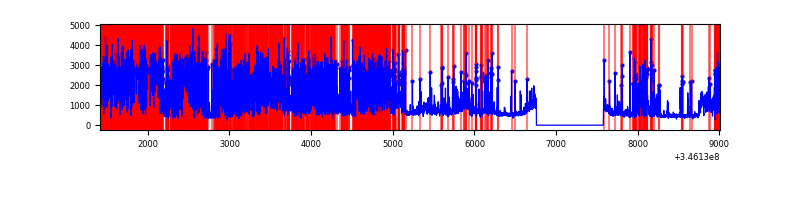 |
Top three noisy pixels from each quadrant. If the there are fewer than three noisy pixels in the level2.evt file, extra rows are filled as -1
| Pixel properties | Quadrant properties | ||||||
|---|---|---|---|---|---|---|---|
| Quadrant | DetID | PixID | Counts | Sigma | Mean | Median | Sigma |
| A | 12 | 96 | 11322 | 61.3 | 844 | 828 | 171.2 |
| A | 13 | 254 | 10706 | 57.7 | 844 | 828 | 171.2 |
| A | 10 | 67 | 8587 | 45.32 | 844 | 828 | 171.2 |
| B | 10 | 245 | 112185 | 695.73 | 833 | 813 | 160.1 |
| B | 10 | 246 | 39934 | 244.38 | 833 | 813 | 160.1 |
| B | 12 | 111 | 19654 | 117.7 | 833 | 813 | 160.1 |
| C | 14 | 238 | 130358 | 689.06 | 803 | 809 | 188.0 |
| C | 3 | 233 | 106683 | 563.13 | 803 | 809 | 188.0 |
| C | 13 | 61 | 5390 | 24.37 | 803 | 809 | 188.0 |
| D | 1 | 52 | 6056730 | 36220.74 | 694 | 673 | 167.2 |
| D | 8 | 195 | 344660 | 2057.36 | 694 | 673 | 167.2 |
| D | 7 | 238 | 200800 | 1196.94 | 694 | 673 | 167.2 |
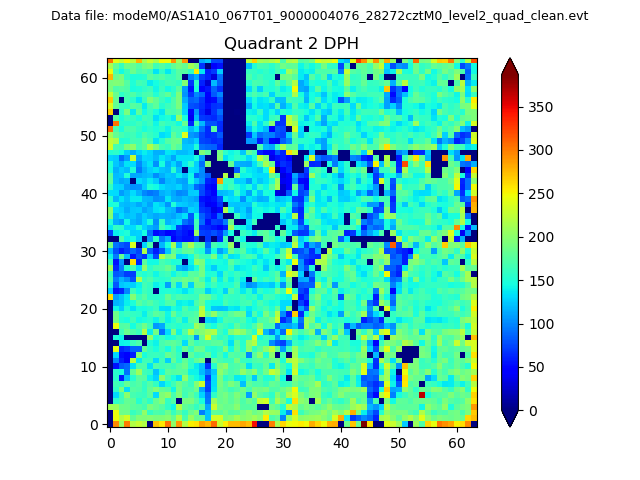
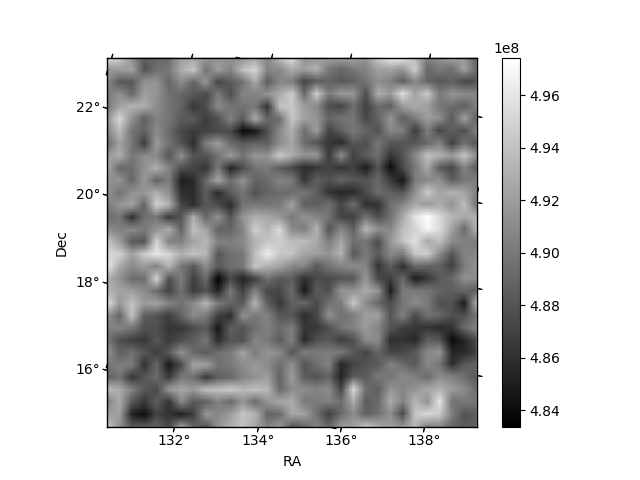
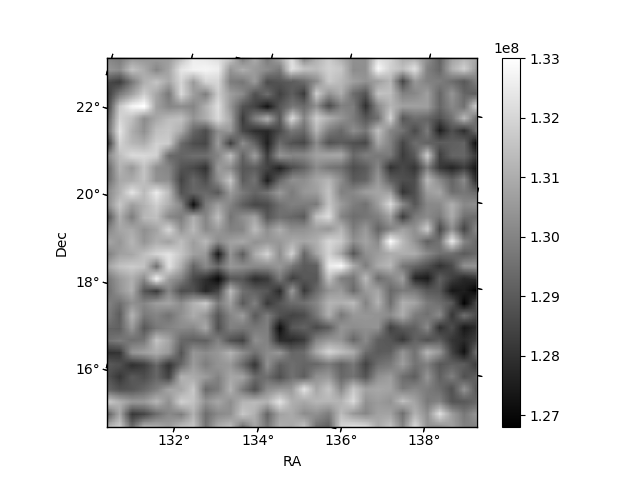
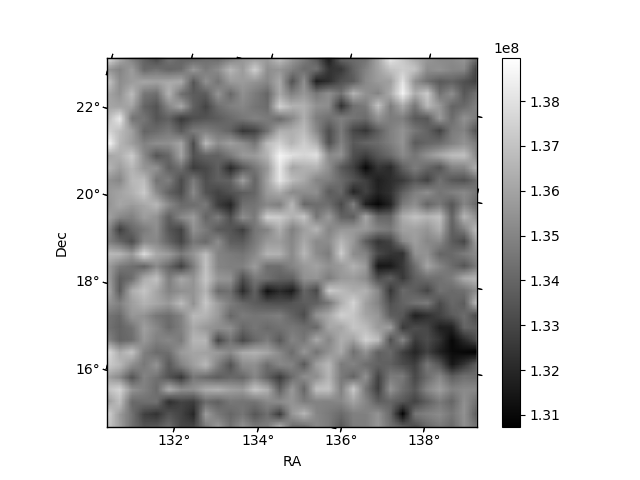
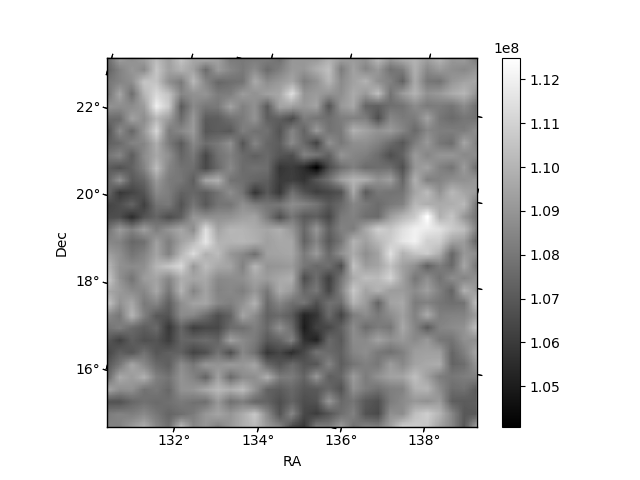
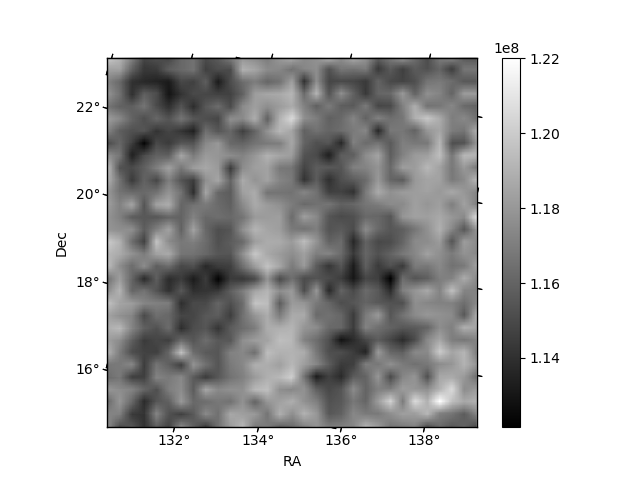
Histogram calculated using DETX and DETY for each event in the final _common_clean file
| Quadrant A | 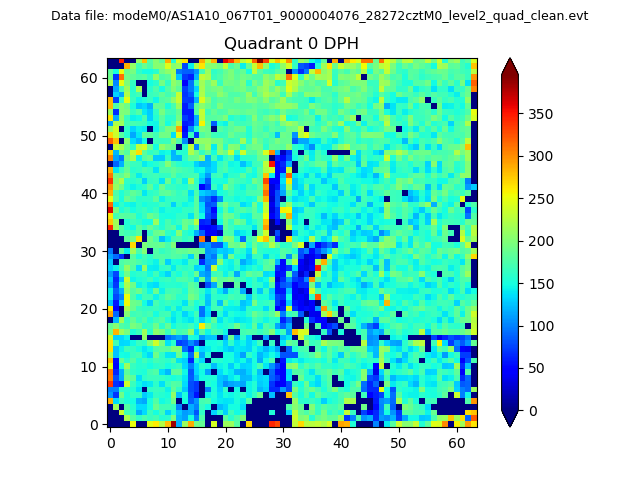 |
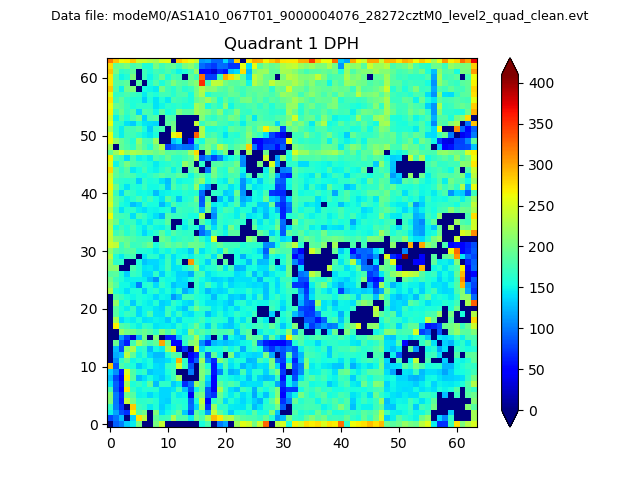 |
Quadrant B |
|---|---|---|---|
| Quadrant D | 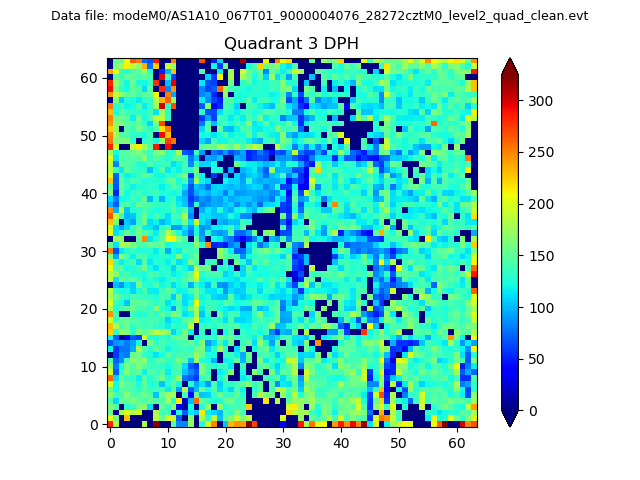 |
 |
Quadrant C |
| Plot type | Count rate plots | Images |
|---|---|---|
| Comparison with Poisson distribution Blue bars denote a histogram of data divided into 1 sec bins. Red curve is a Poisson curve with rate = median count rate of data. |
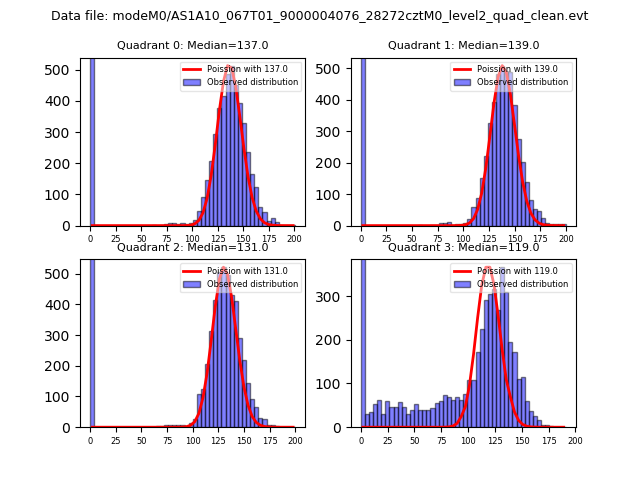 |
 |
| Quadrant-wise count rates Data is divided into 100 sec bins |
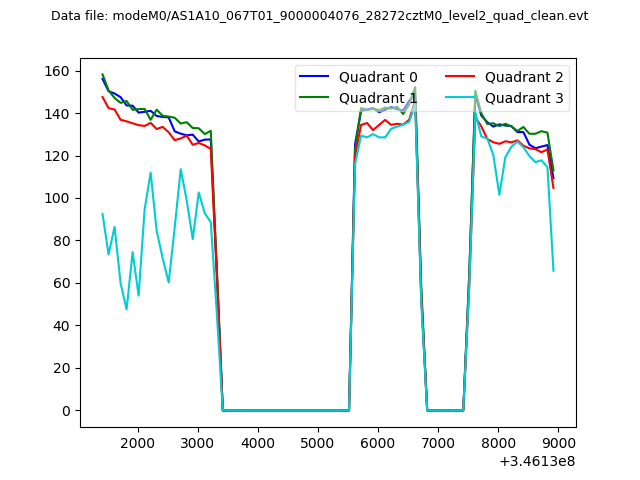 |
|
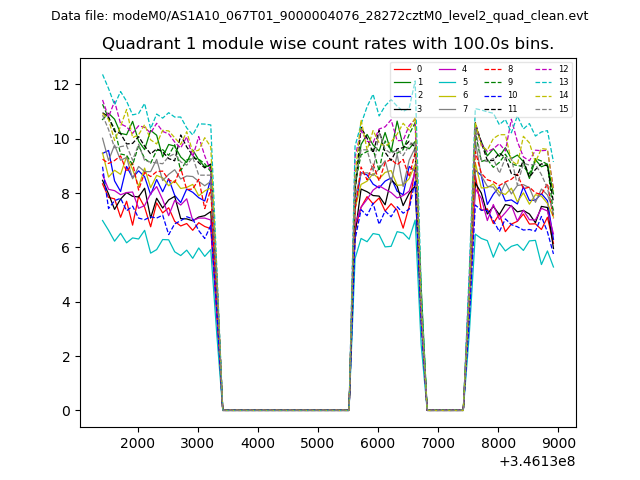
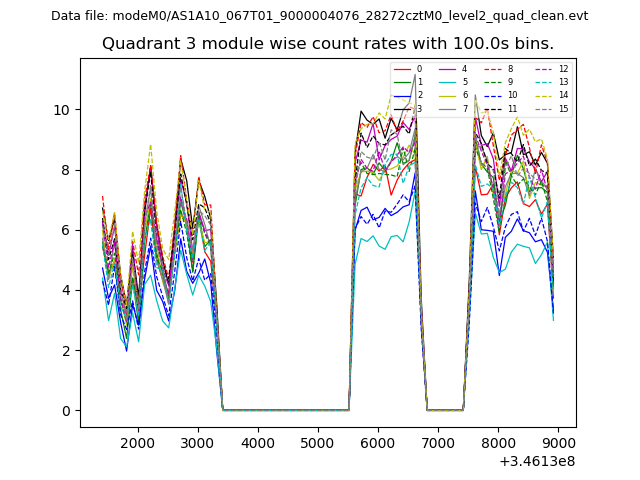
| Module-wise count rates for Quadrant A Data is divided into 100 sec bins |
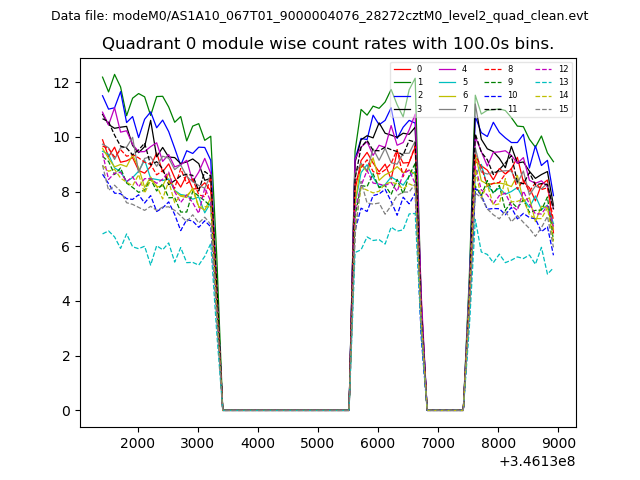 |
 |
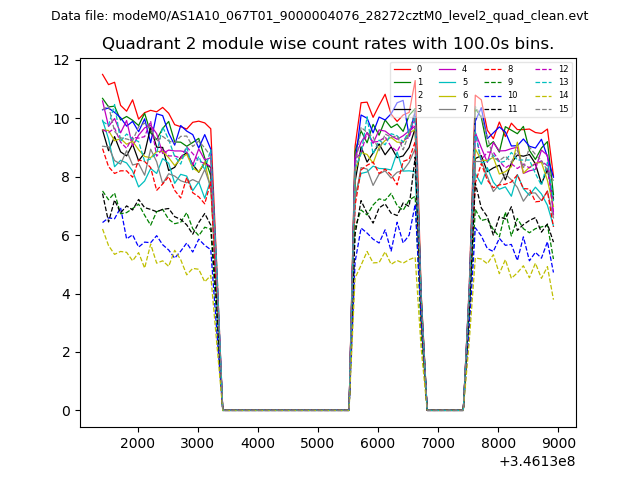
| Module-wise count rates for Quadrant B Data is divided into 100 sec bins |
 |
 |
| Module-wise count rates for Quadrant C Data is divided into 100 sec bins |
 |
 |
| Module-wise count rates for Quadrant D Data is divided into 100 sec bins |
 |
 |
| Parameter | Plot |
|---|---|
| CZT HV Monitor | 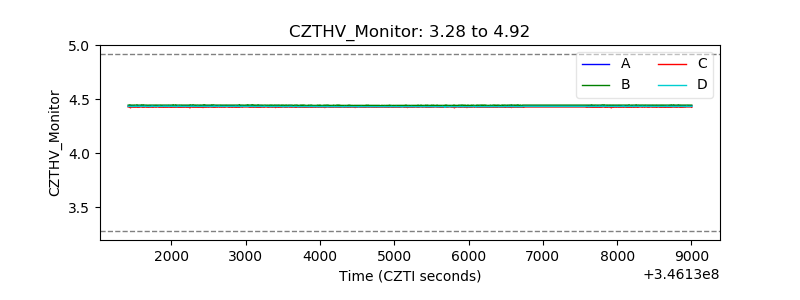 |
| D_VDD | 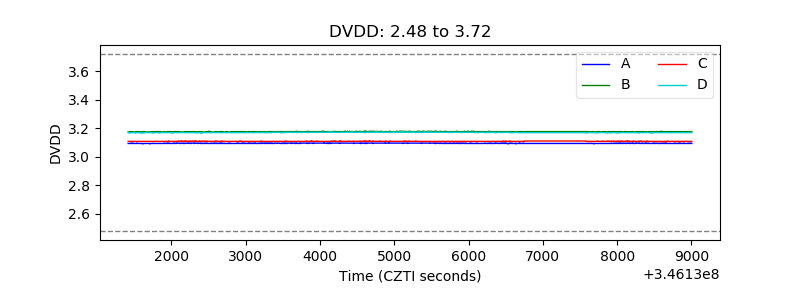 |
| Temperature 1 | 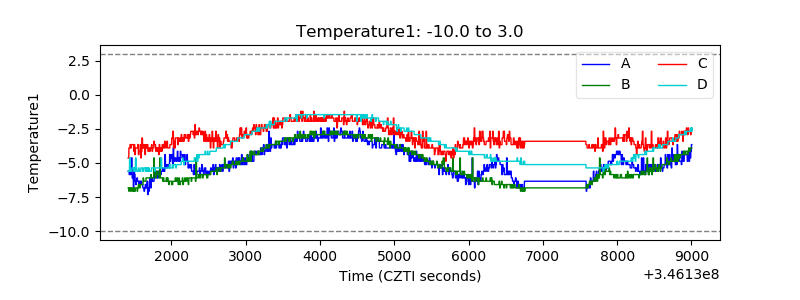 |
| Veto HV Monitor | 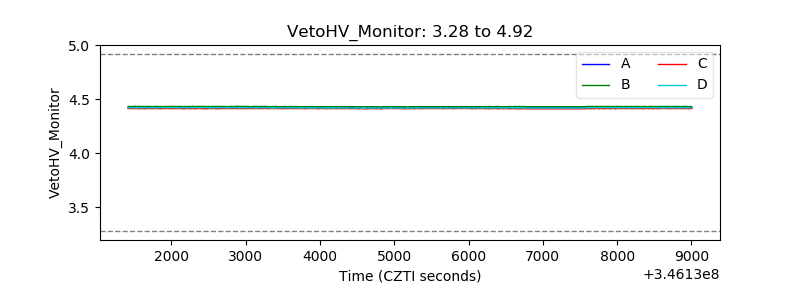 |
| Veto LLD | 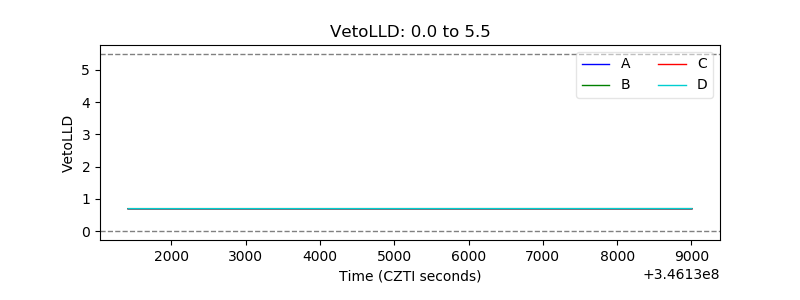 |
| Alpha Counter | 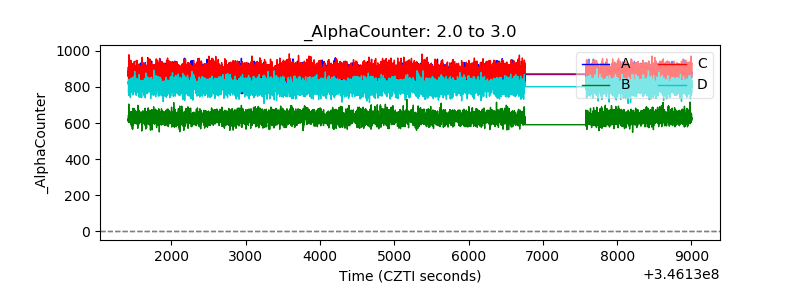 |
| _CPM_Rate | 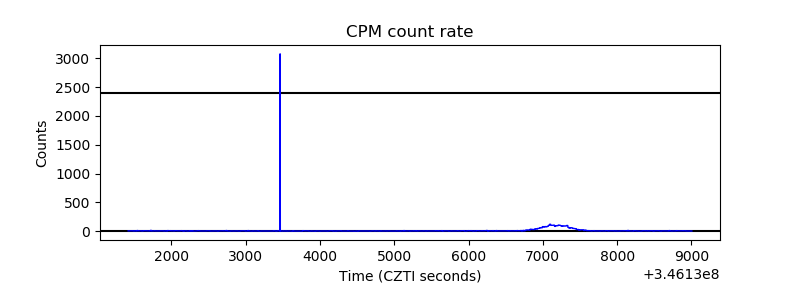 |
| CZT Counter | 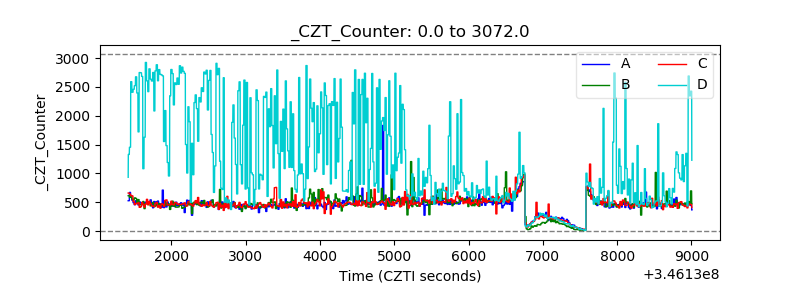 |
| +2.5 Volts monitor | 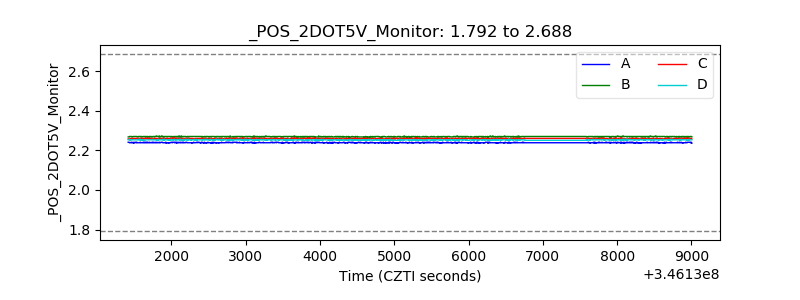 |
| +5 Volts monitor | 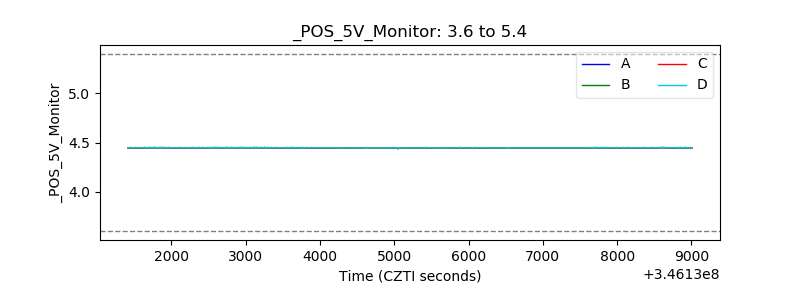 |
| _ROLL_ROT | 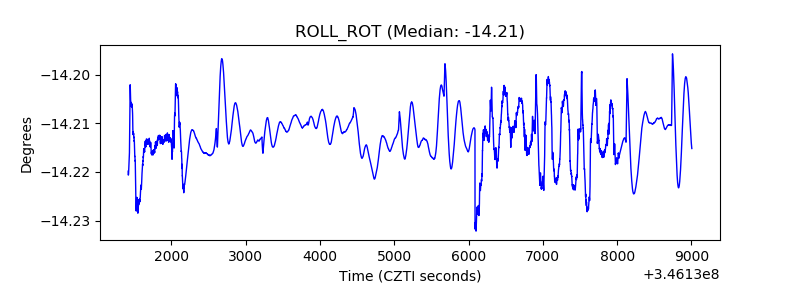 |
| _Roll_DEC | 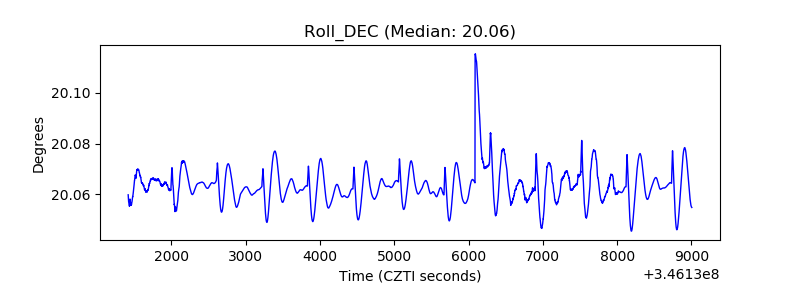 |
| _Roll_RA | 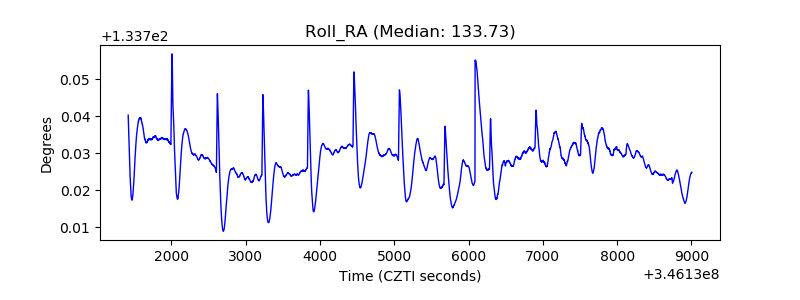 |
| Veto Counter | 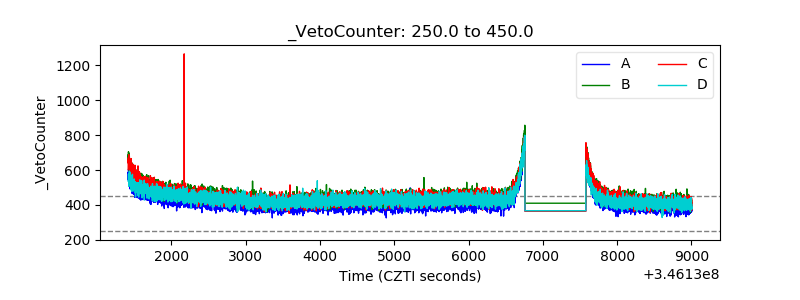 |