| Param | Original file | Final file |
|---|---|---|
| Filename | modeM0/AS1A10_067T01_9000004076_28273cztM0_level2.evt | modeM0/AS1A10_067T01_9000004076_28273cztM0_level2_quad_clean.evt |
| Size (bytes) | 666,034,560 | 100,120,320 |
| Size | 635.2 MB | 95.5 MB |
| Events in quadrant A | 3,540,447 | 651,892 |
| Events in quadrant B | 4,132,642 | 659,122 |
| Events in quadrant C | 3,595,272 | 624,234 |
| Events in quadrant D | 8,402,779 | 583,137 |
| Mode M0 | |||
|---|---|---|---|
| Quadrant | BADHDUFLAG | Total packets | Discarded packets |
| A | 0 | 15232 | 0 |
| B | 0 | 16985 | 0 |
| C | 0 | 15332 | 0 |
| D | 0 | 29892 | 0 |
| Mode M9 | |||
|---|---|---|---|
| Quadrant | BADHDUFLAG | Total packets | Discarded packets |
| A | 0 | 8 | 0 |
| B | 0 | 9 | 0 |
| C | 0 | 9 | 0 |
| D | 0 | 9 | 0 |
| Quadrant | Total seconds | Saturated seconds | Saturation percentage |
|---|---|---|---|
| A | 7380 | 176 | 2.384824% |
| B | 7380 | 276 | 3.739837% |
| C | 7379 | 216 | 2.927226% |
| D | 7377 | 1898 | 25.728616% |
Noise dominated data is calculated using 1-second bins in cleaned event files. If a bin has >2000 counts, and if more than 50% of those come from <1% of pixels, then it is considered to be noise-dominated and hence unusable.
| Quadrant | # 1 sec bins | Bins with >0 counts | Bins with >2000 counts | High rate bins dominated by noise | Noise dominated (total time) | Noise dominated (detector-on time) | Marked lightcurve |
|---|---|---|---|---|---|---|---|
| A | 7675 | 7380 | 1 | 1 | 0.01% | 0.01% | 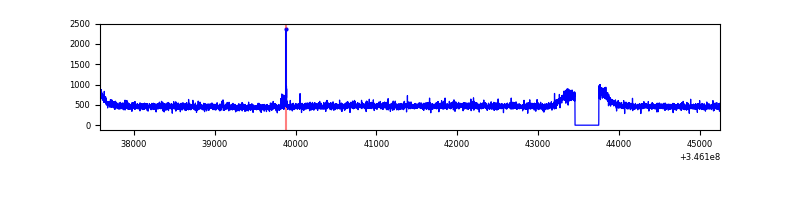 |
| B | 7675 | 7381 | 56 | 56 | 0.73% | 0.76% | 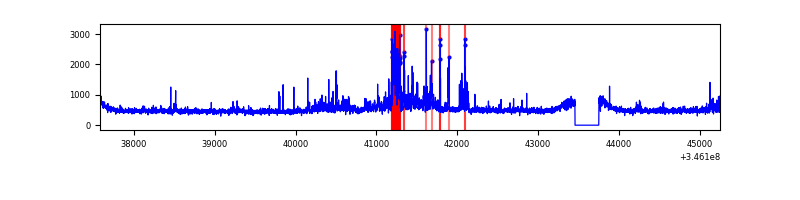 |
| C | 7675 | 7380 | 0 | 0 | 0.00% | 0.00% | 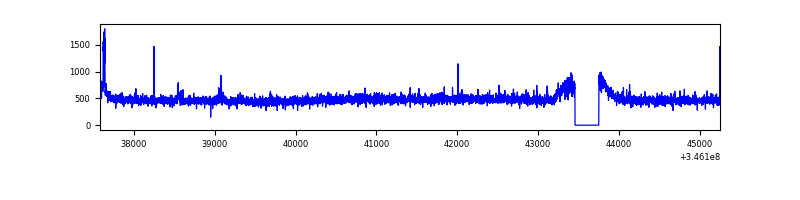 |
| D | 7674 | 7377 | 1583 | 1583 | 20.63% | 21.46% | 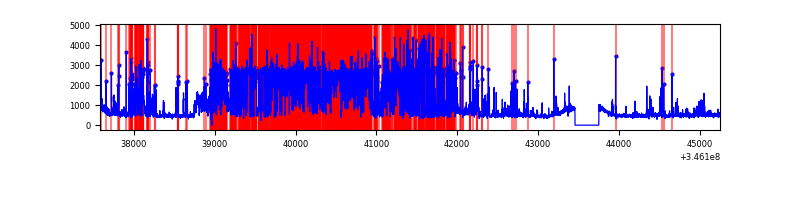 |
Top three noisy pixels from each quadrant. If the there are fewer than three noisy pixels in the level2.evt file, extra rows are filled as -1
| Pixel properties | Quadrant properties | ||||||
|---|---|---|---|---|---|---|---|
| Quadrant | DetID | PixID | Counts | Sigma | Mean | Median | Sigma |
| A | 12 | 96 | 14636 | 74.47 | 914 | 896 | 184.5 |
| A | 13 | 254 | 11919 | 59.74 | 914 | 896 | 184.5 |
| A | 3 | 137 | 8965 | 43.73 | 914 | 896 | 184.5 |
| B | 10 | 245 | 536137 | 3035.34 | 899 | 875 | 176.3 |
| B | 4 | 200 | 35869 | 198.44 | 899 | 875 | 176.3 |
| B | 12 | 111 | 21748 | 118.37 | 899 | 875 | 176.3 |
| C | 14 | 238 | 141649 | 682.92 | 871 | 876 | 206.1 |
| C | 3 | 233 | 55912 | 266.99 | 871 | 876 | 206.1 |
| C | 13 | 61 | 6031 | 25.01 | 871 | 876 | 206.1 |
| D | 1 | 52 | 5113290 | 28415.27 | 750 | 726 | 179.9 |
| D | 2 | 250 | 210951 | 1168.42 | 750 | 726 | 179.9 |
| D | 8 | 195 | 143520 | 793.64 | 750 | 726 | 179.9 |
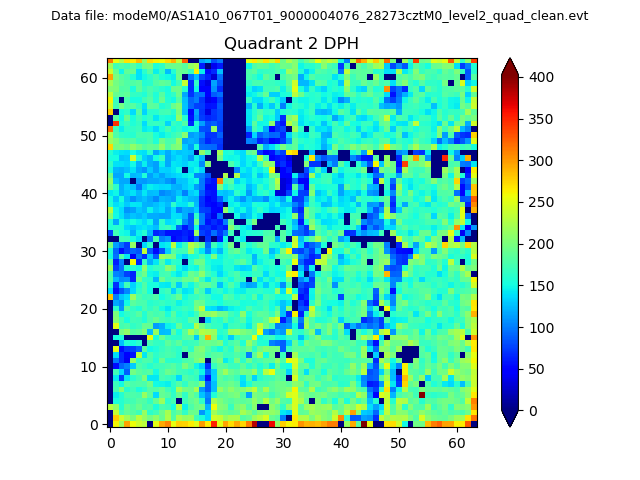
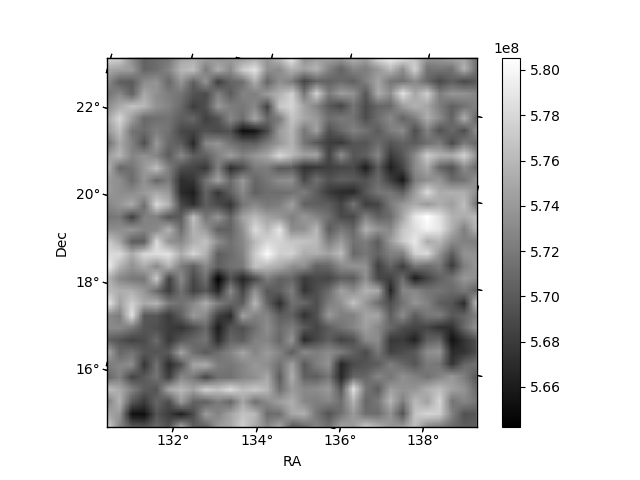
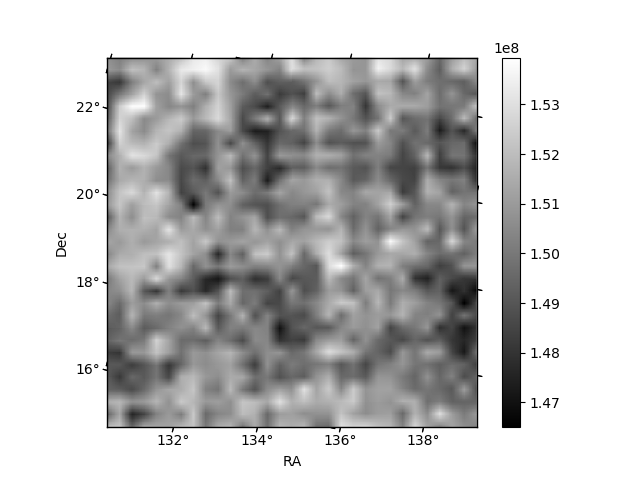
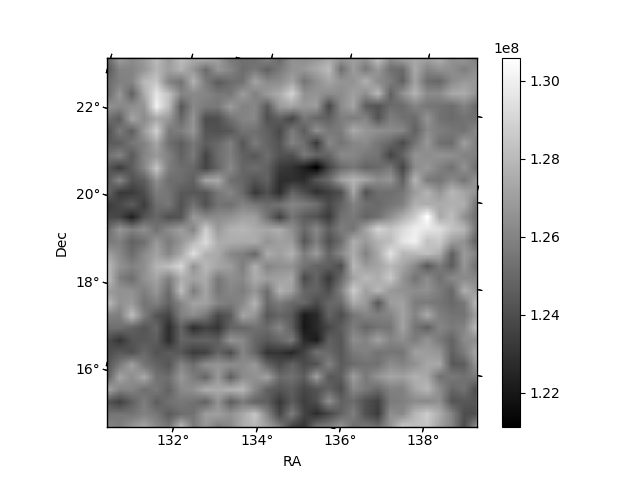
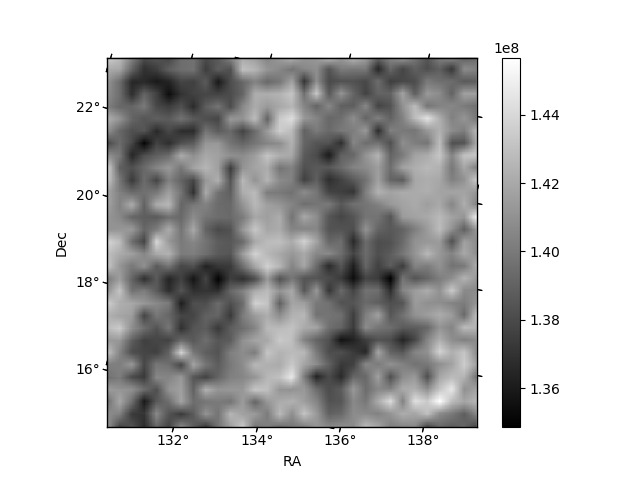
Histogram calculated using DETX and DETY for each event in the final _common_clean file
| Quadrant A | 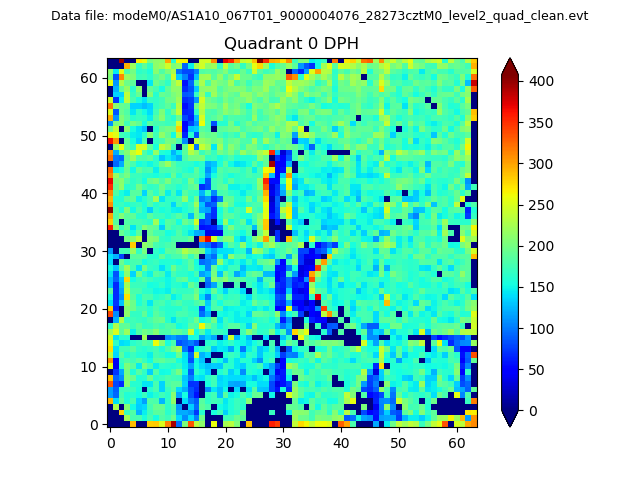 |
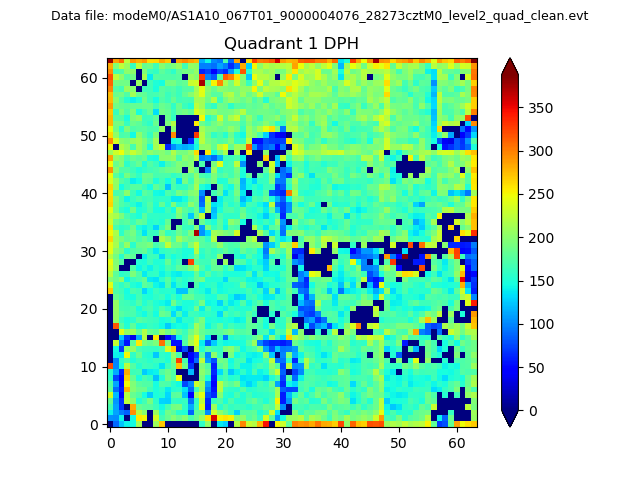 |
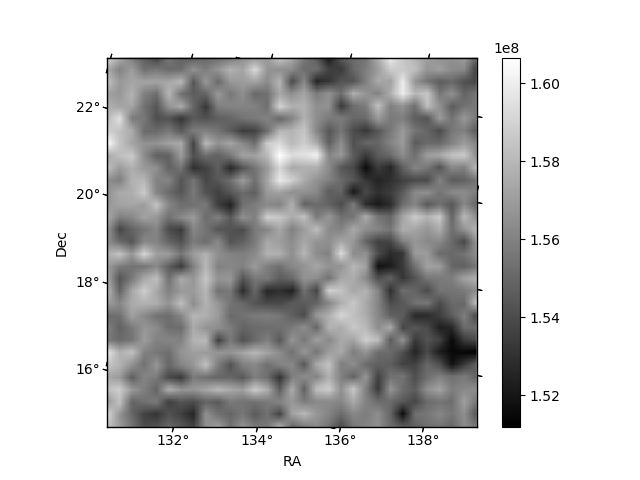
Quadrant B |
|---|---|---|---|
| Quadrant D | 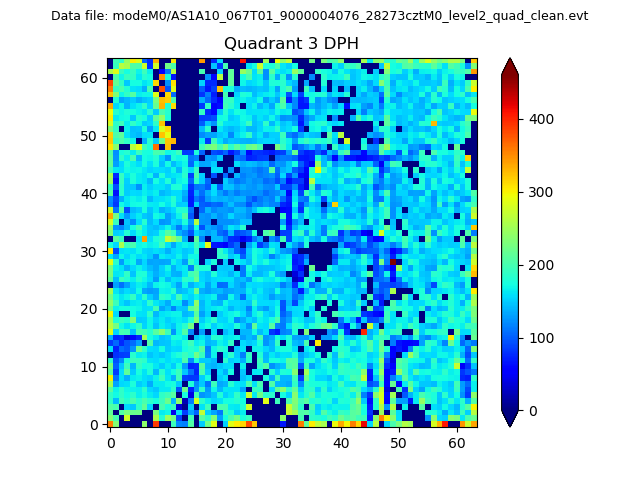 |
 |
Quadrant C |
| Plot type | Count rate plots | Images |
|---|---|---|
| Comparison with Poisson distribution Blue bars denote a histogram of data divided into 1 sec bins. Red curve is a Poisson curve with rate = median count rate of data. |
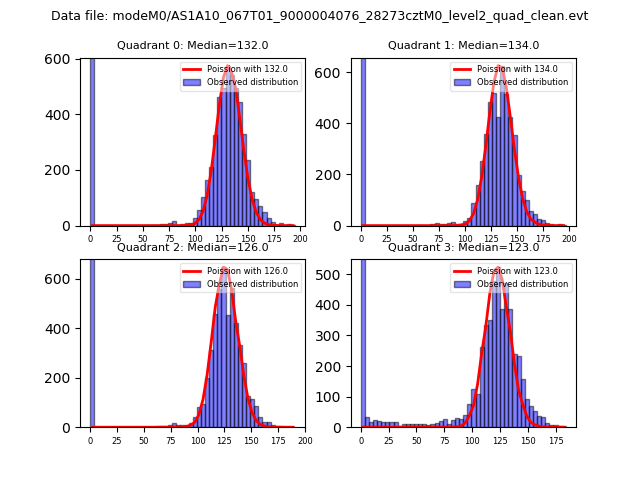 |
 |
| Quadrant-wise count rates Data is divided into 100 sec bins |
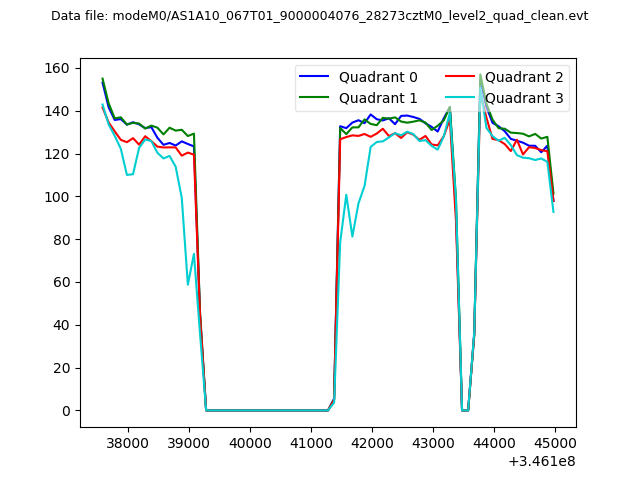 |
|
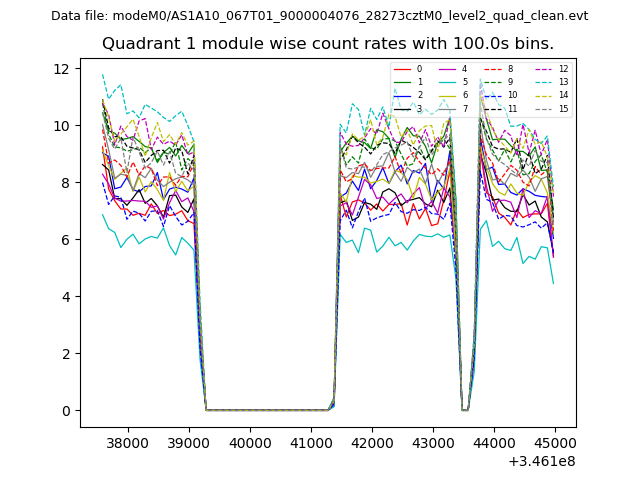
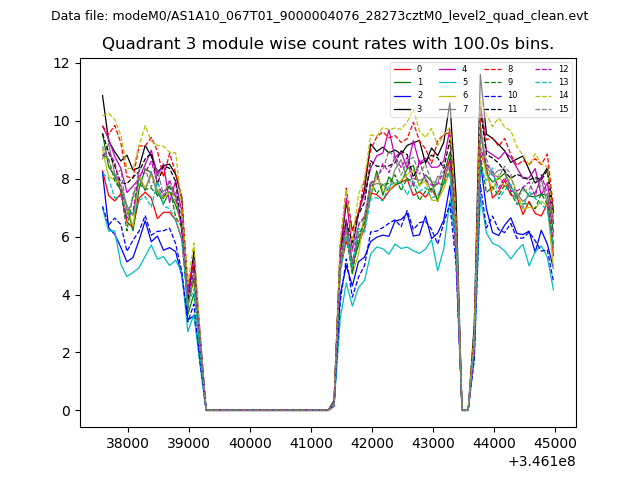
| Module-wise count rates for Quadrant A Data is divided into 100 sec bins |
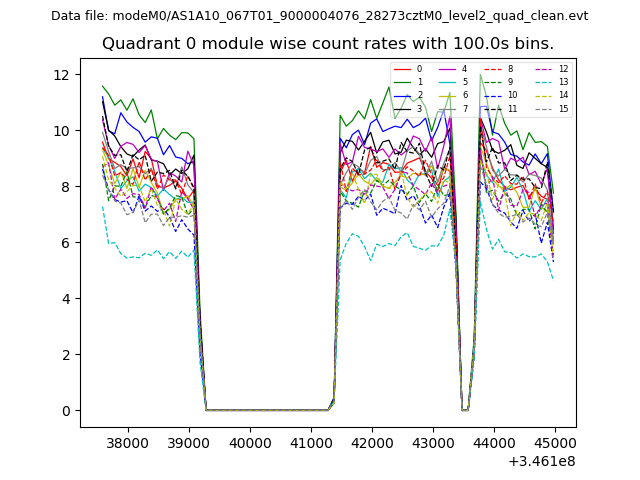 |
 |
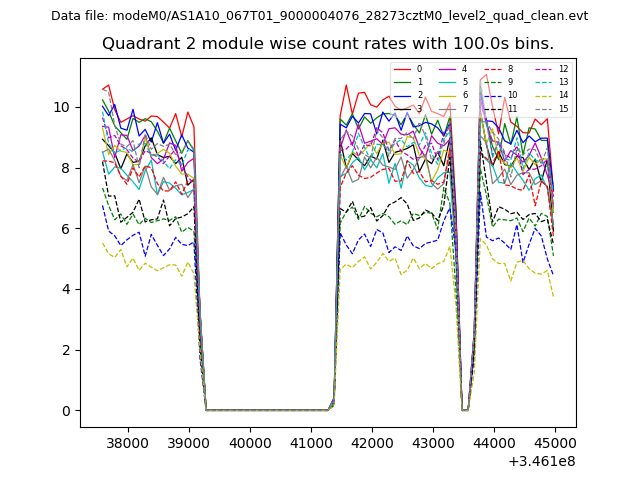
| Module-wise count rates for Quadrant B Data is divided into 100 sec bins |
 |
 |
| Module-wise count rates for Quadrant C Data is divided into 100 sec bins |
 |
 |
| Module-wise count rates for Quadrant D Data is divided into 100 sec bins |
 |
 |
| Parameter | Plot |
|---|---|
| CZT HV Monitor | 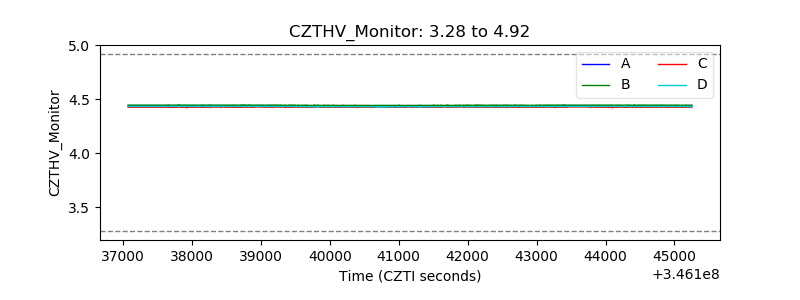 |
| D_VDD | 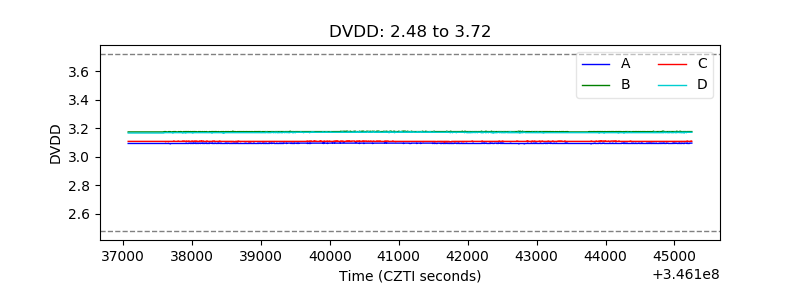 |
| Temperature 1 | 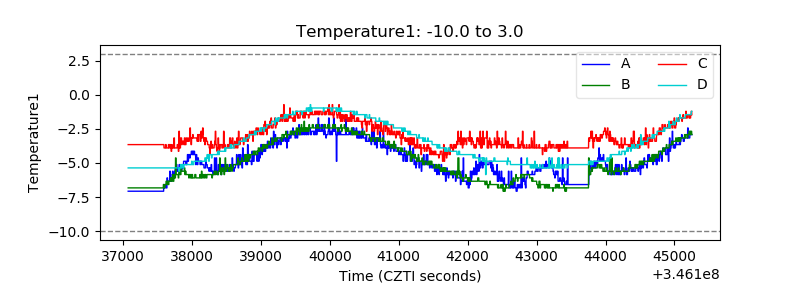 |
| Veto HV Monitor | 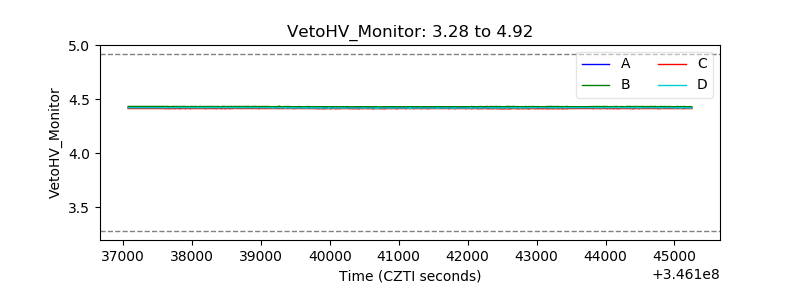 |
| Veto LLD | 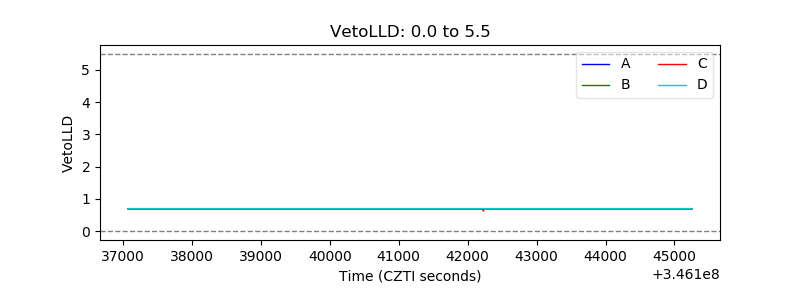 |
| Alpha Counter | 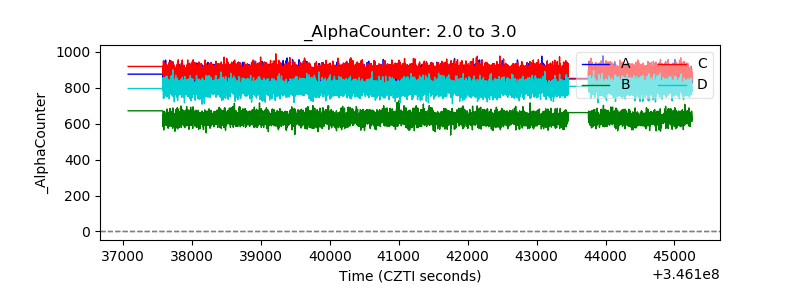 |
| _CPM_Rate | 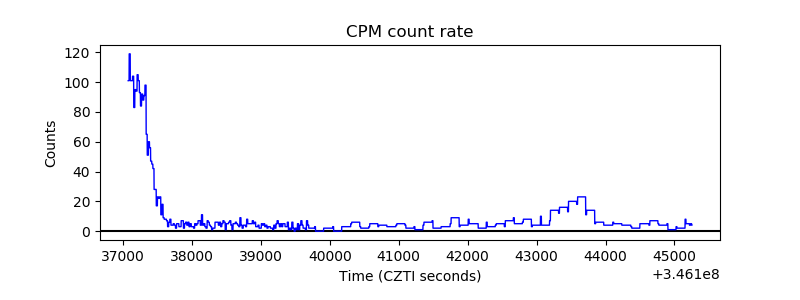 |
| CZT Counter | 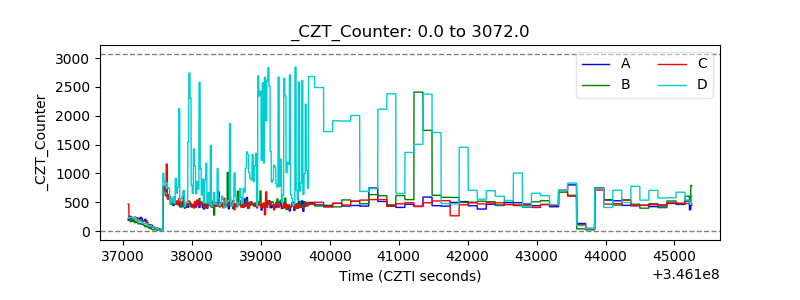 |
| +2.5 Volts monitor |  |
| +5 Volts monitor | 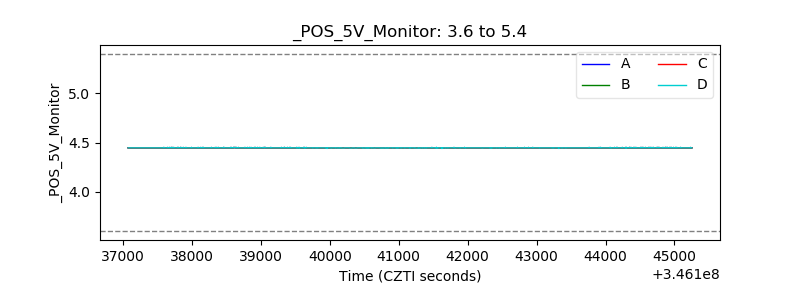 |
| _ROLL_ROT | 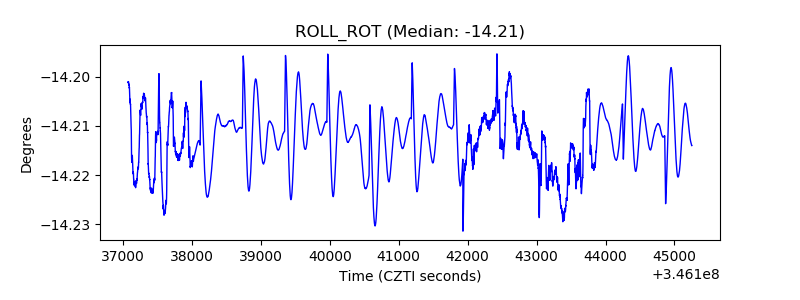 |
| _Roll_DEC | 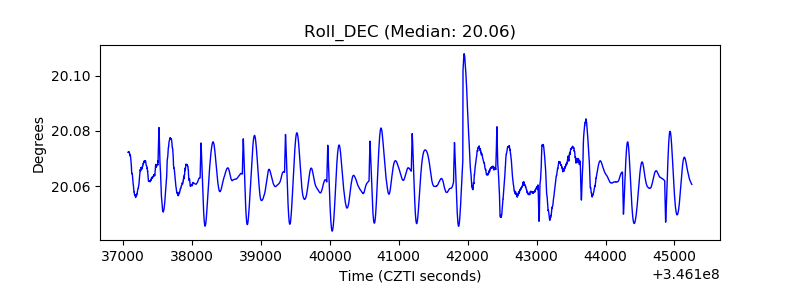 |
| _Roll_RA | 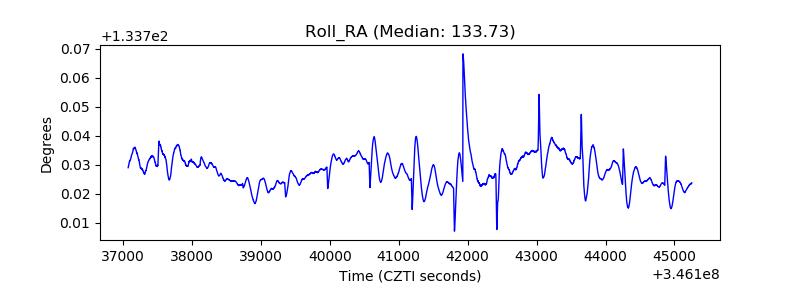 |
| Veto Counter | 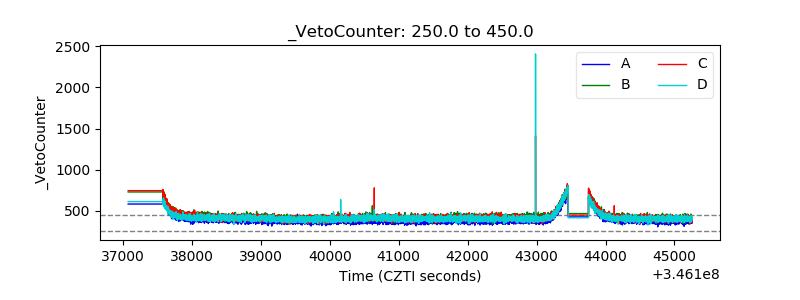 |