| Param | Original file | Final file |
|---|---|---|
| Filename | modeM0/AS1A10_067T01_9000004076_28275cztM0_level2.evt | modeM0/AS1A10_067T01_9000004076_28275cztM0_level2_quad_clean.evt |
| Size (bytes) | 562,896,000 | 79,361,280 |
| Size | 536.8 MB | 75.7 MB |
| Events in quadrant A | 3,526,376 | 491,786 |
| Events in quadrant B | 4,375,405 | 485,506 |
| Events in quadrant C | 3,508,296 | 466,866 |
| Events in quadrant D | 5,145,688 | 454,105 |
| Mode M0 | |||
|---|---|---|---|
| Quadrant | BADHDUFLAG | Total packets | Discarded packets |
| A | 0 | 15099 | 0 |
| B | 0 | 17489 | 0 |
| C | 0 | 14921 | 0 |
| D | 0 | 20132 | 0 |
| Mode M9 | |||
|---|---|---|---|
| Quadrant | BADHDUFLAG | Total packets | Discarded packets |
| A | 0 | 3 | 0 |
| B | 0 | 3 | 0 |
| C | 0 | 3 | 0 |
| D | 0 | 3 | 0 |
| Quadrant | Total seconds | Saturated seconds | Saturation percentage |
|---|---|---|---|
| A | 7249 | 105 | 1.448476% |
| B | 7250 | 276 | 3.806897% |
| C | 7250 | 129 | 1.779310% |
| D | 7250 | 436 | 6.013793% |
Noise dominated data is calculated using 1-second bins in cleaned event files. If a bin has >2000 counts, and if more than 50% of those come from <1% of pixels, then it is considered to be noise-dominated and hence unusable.
| Quadrant | # 1 sec bins | Bins with >0 counts | Bins with >2000 counts | High rate bins dominated by noise | Noise dominated (total time) | Noise dominated (detector-on time) | Marked lightcurve |
|---|---|---|---|---|---|---|---|
| A | 7534 | 7251 | 0 | 0 | 0.00% | 0.00% | 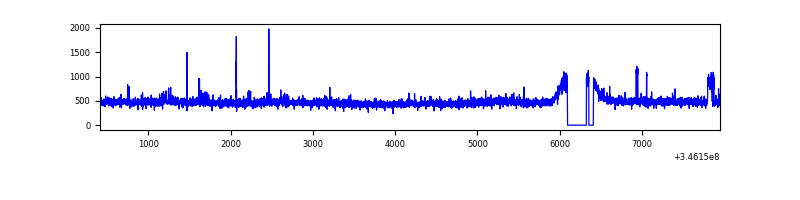 |
| B | 7535 | 7251 | 127 | 127 | 1.69% | 1.75% | 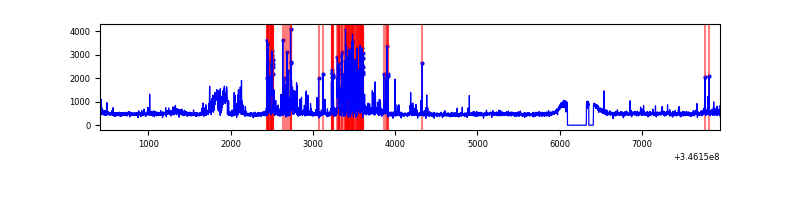 |
| C | 7535 | 7251 | 2 | 2 | 0.03% | 0.03% | 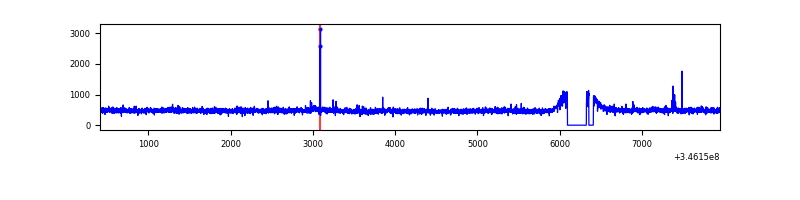 |
| D | 7535 | 7252 | 297 | 297 | 3.94% | 4.10% | 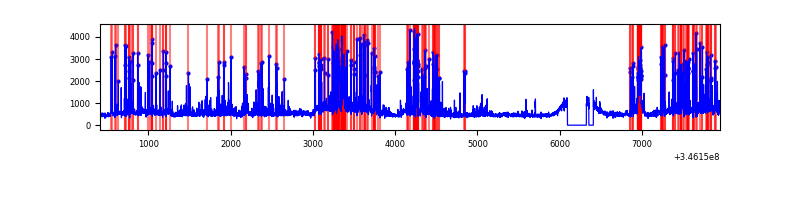 |
Top three noisy pixels from each quadrant. If the there are fewer than three noisy pixels in the level2.evt file, extra rows are filled as -1
| Pixel properties | Quadrant properties | ||||||
|---|---|---|---|---|---|---|---|
| Quadrant | DetID | PixID | Counts | Sigma | Mean | Median | Sigma |
| A | 15 | 169 | 50092 | 272.57 | 889 | 869 | 180.6 |
| A | 5 | 98 | 36901 | 199.52 | 889 | 869 | 180.6 |
| A | 13 | 254 | 12531 | 64.58 | 889 | 869 | 180.6 |
| B | 10 | 245 | 797792 | 4685.94 | 870 | 845 | 170.1 |
| B | 15 | 32 | 119266 | 696.3 | 870 | 845 | 170.1 |
| B | 12 | 111 | 21452 | 121.17 | 870 | 845 | 170.1 |
| C | 14 | 238 | 133185 | 657.32 | 847 | 855 | 201.3 |
| C | 3 | 233 | 57863 | 283.18 | 847 | 855 | 201.3 |
| C | 8 | 128 | 9929 | 45.07 | 847 | 855 | 201.3 |
| D | 8 | 195 | 879981 | 4352.31 | 845 | 820 | 202.0 |
| D | 1 | 52 | 788749 | 3900.66 | 845 | 820 | 202.0 |
| D | 12 | 250 | 116584 | 573.09 | 845 | 820 | 202.0 |
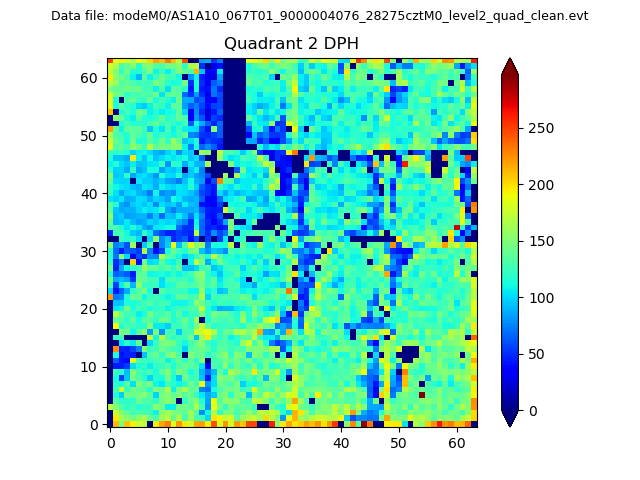
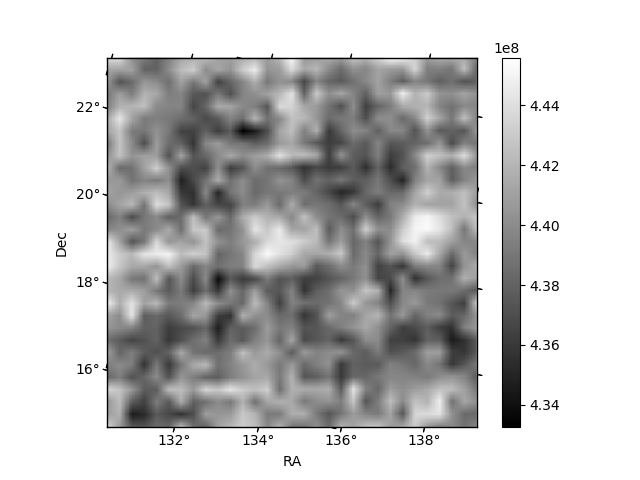
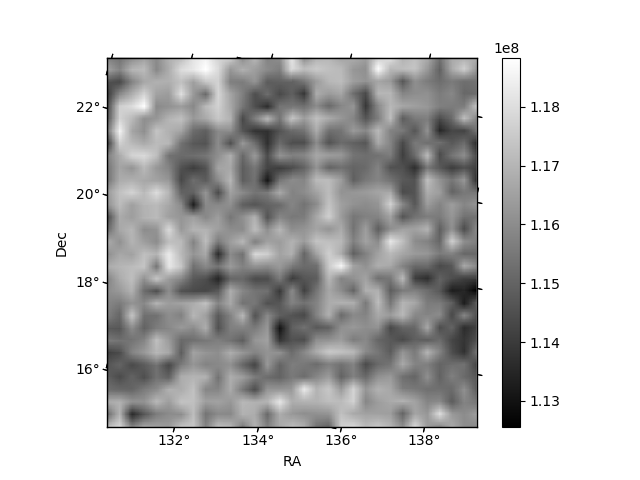
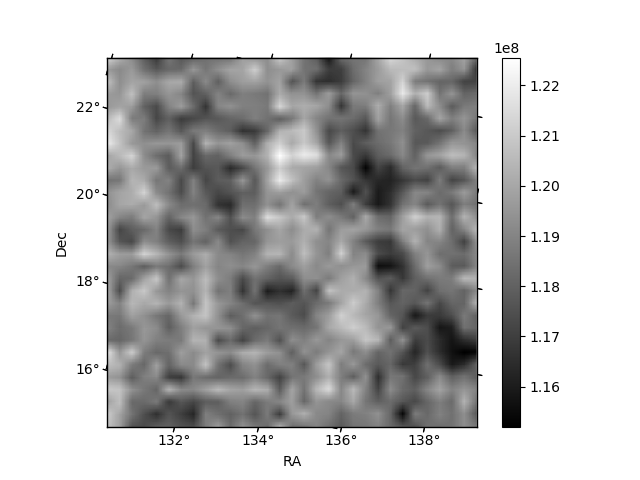
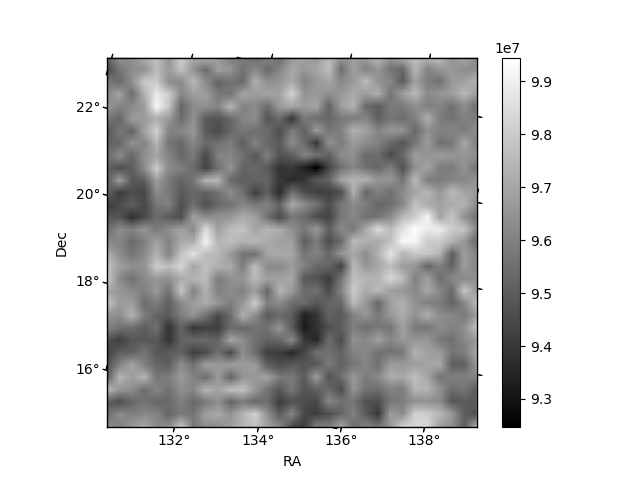
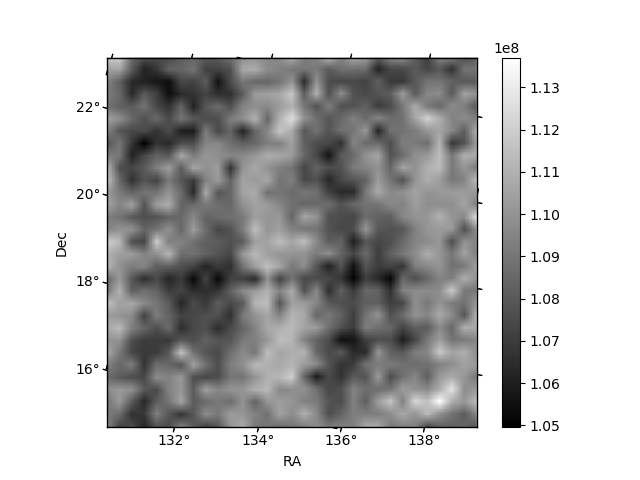
Histogram calculated using DETX and DETY for each event in the final _common_clean file
| Quadrant A | 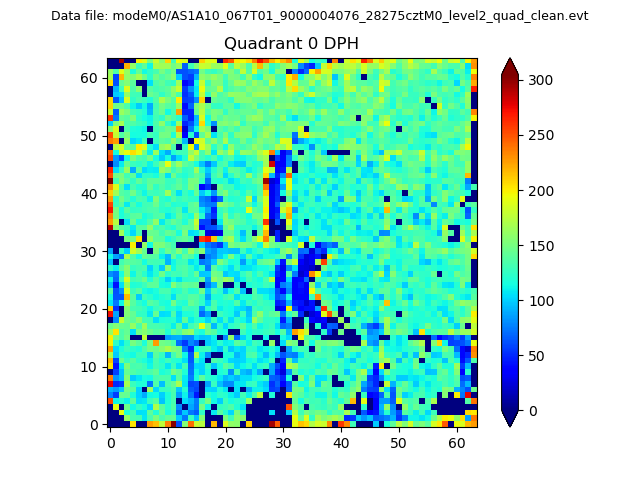 |
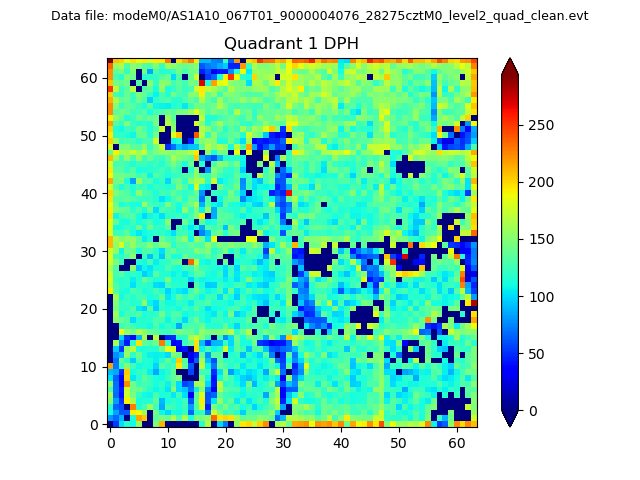 |
Quadrant B |
|---|---|---|---|
| Quadrant D | 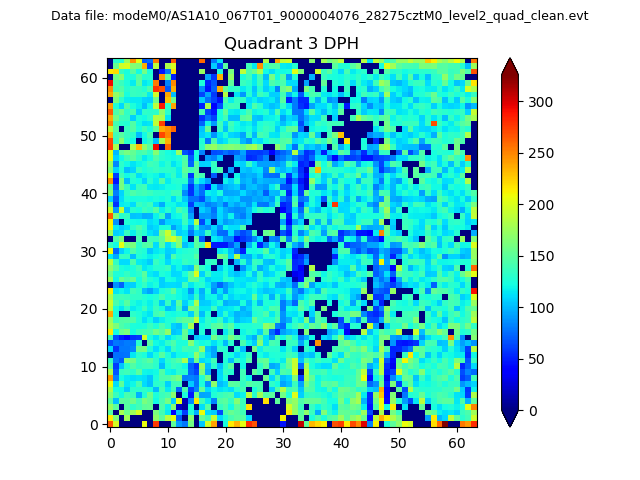 |
 |
Quadrant C |
| Plot type | Count rate plots | Images |
|---|---|---|
| Comparison with Poisson distribution Blue bars denote a histogram of data divided into 1 sec bins. Red curve is a Poisson curve with rate = median count rate of data. |
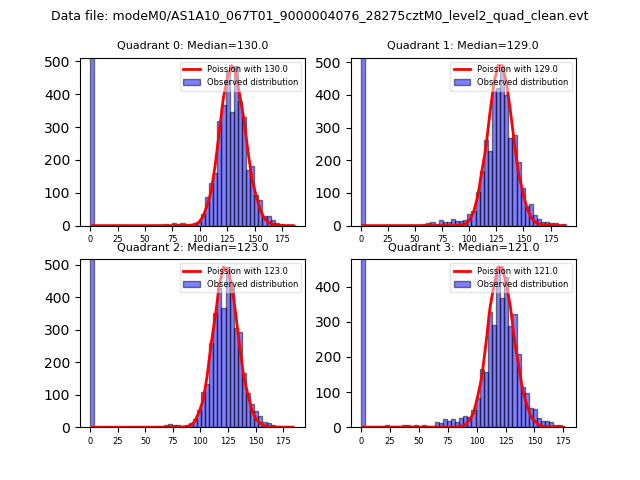 |
 |
| Quadrant-wise count rates Data is divided into 100 sec bins |
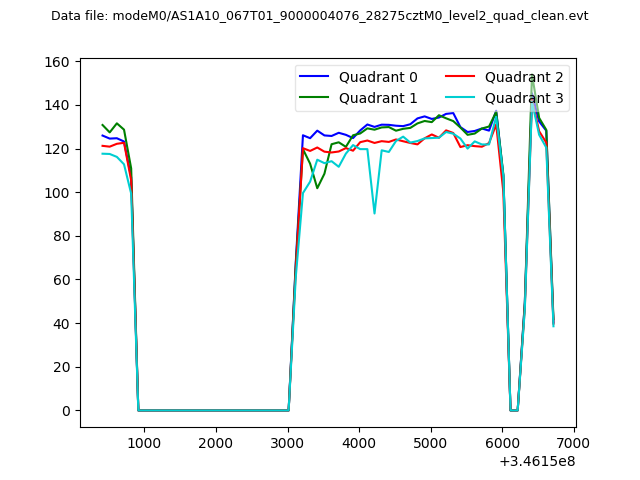 |
|
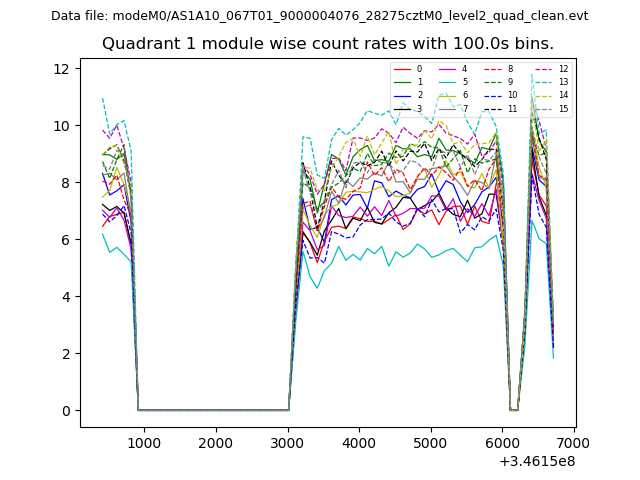
| Module-wise count rates for Quadrant A Data is divided into 100 sec bins |
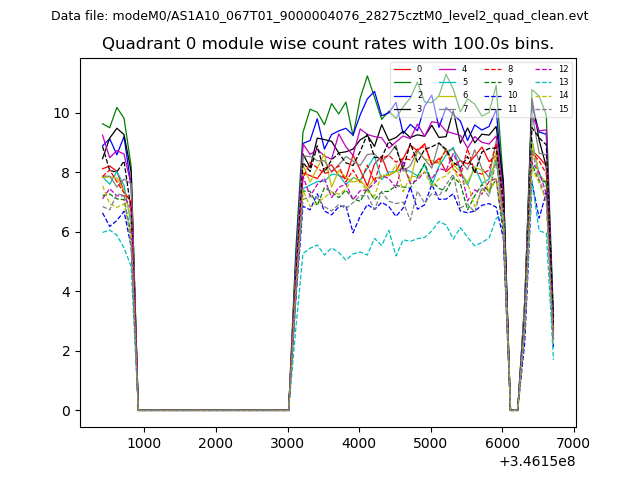 |
 |
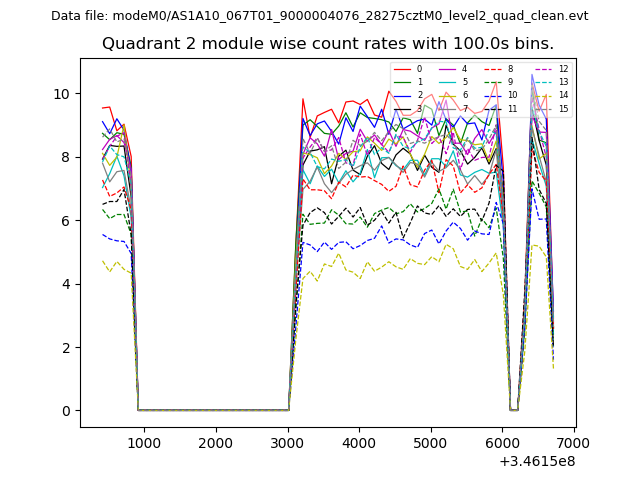
| Module-wise count rates for Quadrant B Data is divided into 100 sec bins |
 |
 |
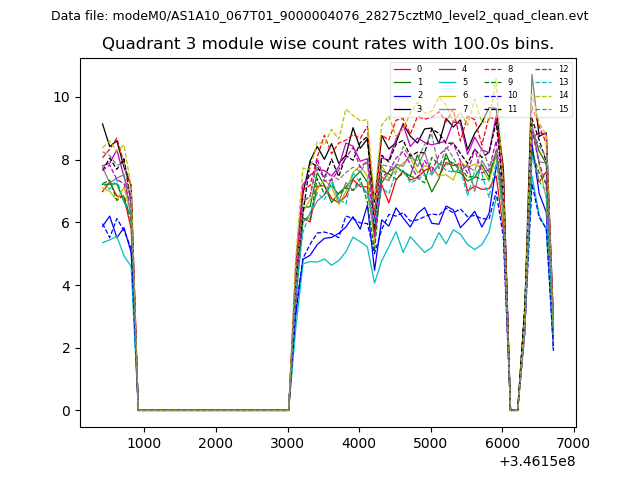
| Module-wise count rates for Quadrant C Data is divided into 100 sec bins |
 |
 |
| Module-wise count rates for Quadrant D Data is divided into 100 sec bins |
 |
 |
| Parameter | Plot |
|---|---|
| CZT HV Monitor | 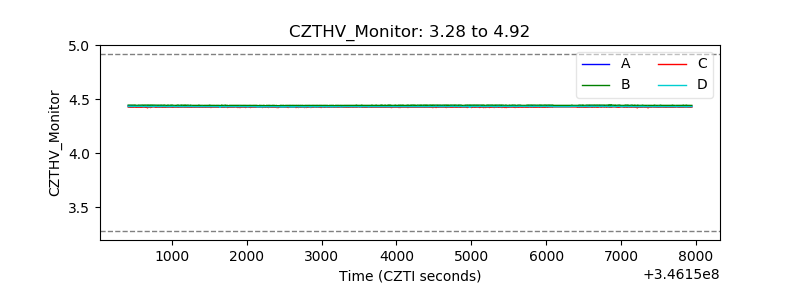 |
| D_VDD | 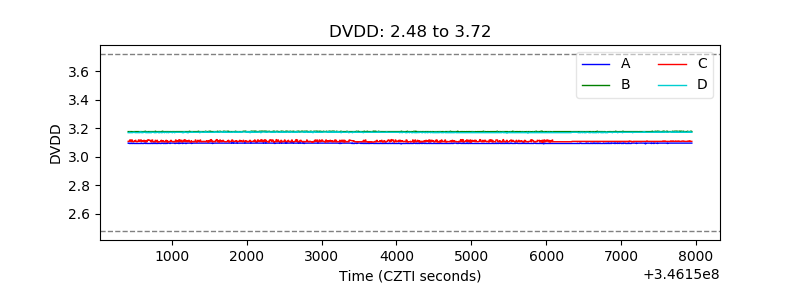 |
| Temperature 1 | 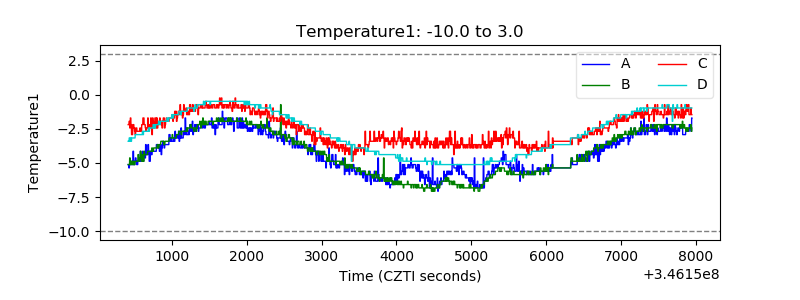 |
| Veto HV Monitor | 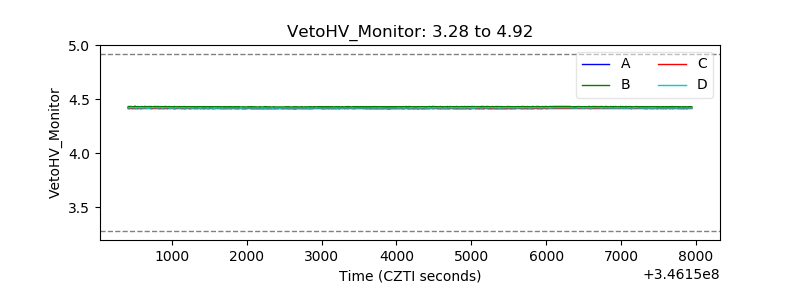 |
| Veto LLD | 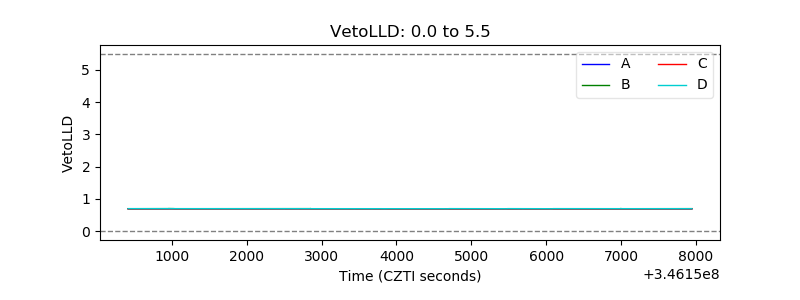 |
| Alpha Counter | 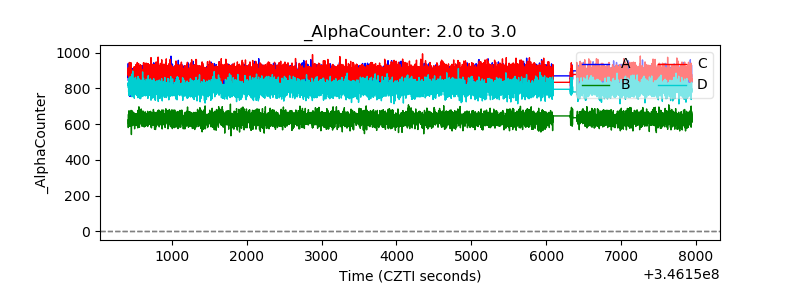 |
| _CPM_Rate | 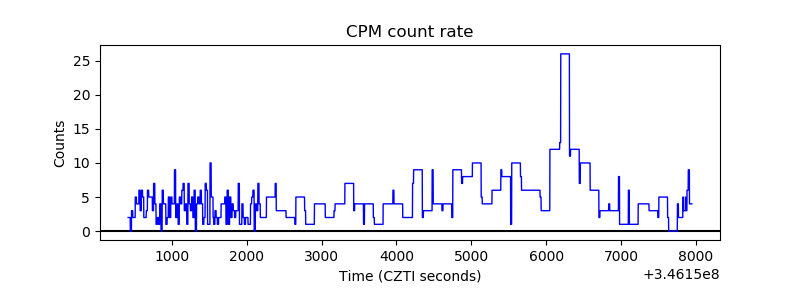 |
| CZT Counter | 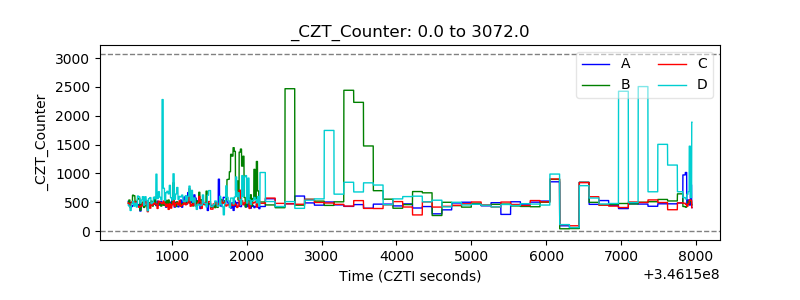 |
| +2.5 Volts monitor |  |
| +5 Volts monitor | 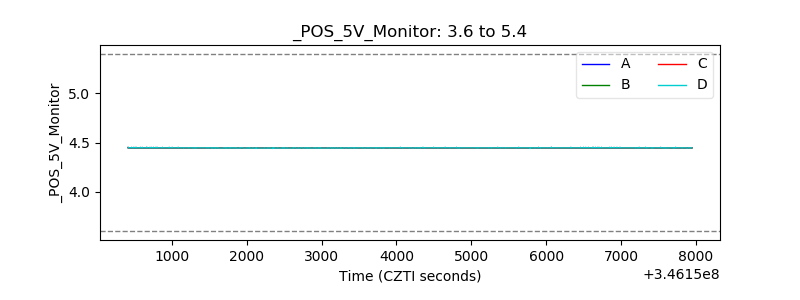 |
| _ROLL_ROT | 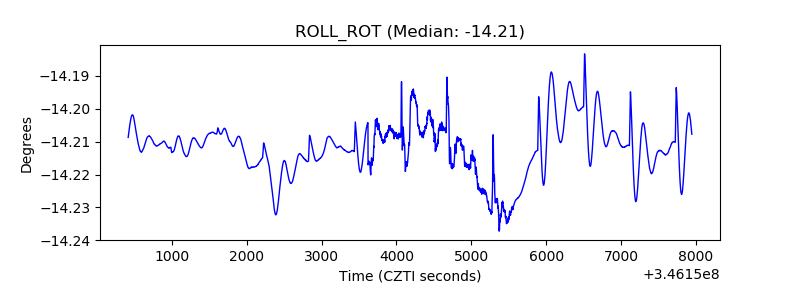 |
| _Roll_DEC | 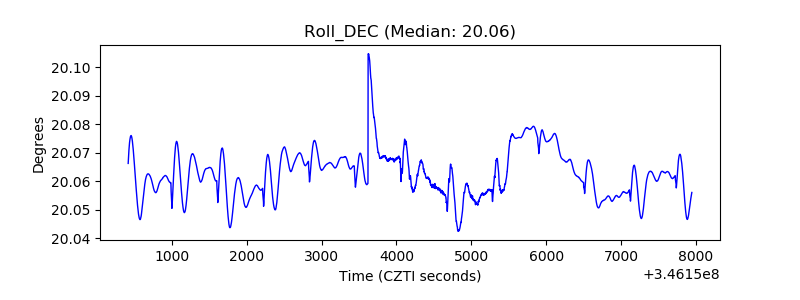 |
| _Roll_RA | 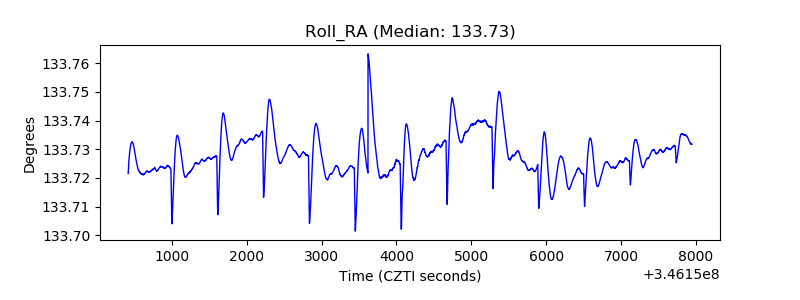 |
| Veto Counter | 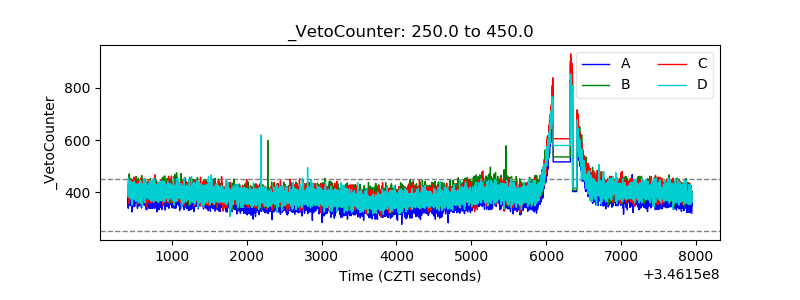 |