| Param | Original file | Final file |
|---|---|---|
| Filename | modeM0/AS1A10_067T01_9000004076_28278cztM0_level2.evt | modeM0/AS1A10_067T01_9000004076_28278cztM0_level2_quad_clean.evt |
| Size (bytes) | 318,885,120 | 45,388,800 |
| Size | 304.1 MB | 43.3 MB |
| Events in quadrant A | 2,057,713 | 272,975 |
| Events in quadrant B | 2,231,234 | 269,254 |
| Events in quadrant C | 2,053,863 | 259,913 |
| Events in quadrant D | 3,013,715 | 261,372 |
| Mode M0 | |||
|---|---|---|---|
| Quadrant | BADHDUFLAG | Total packets | Discarded packets |
| A | 0 | 9054 | 0 |
| B | 0 | 9421 | 0 |
| C | 0 | 8941 | 0 |
| D | 0 | 11937 | 0 |
| Quadrant | Total seconds | Saturated seconds | Saturation percentage |
|---|---|---|---|
| A | 4412 | 7 | 0.158658% |
| B | 4413 | 30 | 0.679810% |
| C | 4413 | 27 | 0.611829% |
| D | 4413 | 196 | 4.441423% |
Noise dominated data is calculated using 1-second bins in cleaned event files. If a bin has >2000 counts, and if more than 50% of those come from <1% of pixels, then it is considered to be noise-dominated and hence unusable.
| Quadrant | # 1 sec bins | Bins with >0 counts | Bins with >2000 counts | High rate bins dominated by noise | Noise dominated (total time) | Noise dominated (detector-on time) | Marked lightcurve |
|---|---|---|---|---|---|---|---|
| A | 4412 | 4412 | 0 | 0 | 0.00% | 0.00% | 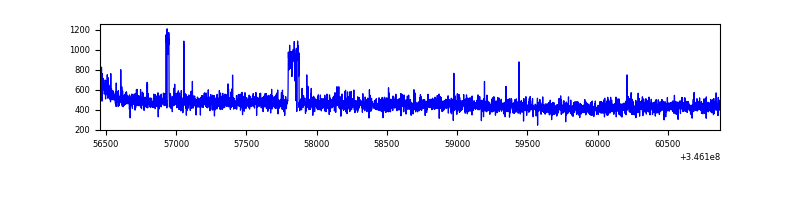 |
| B | 4413 | 4413 | 20 | 20 | 0.45% | 0.45% | 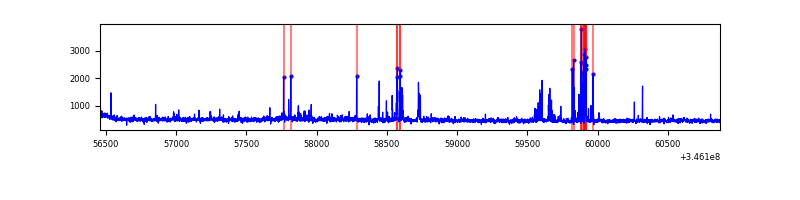 |
| C | 4413 | 4413 | 0 | 0 | 0.00% | 0.00% | 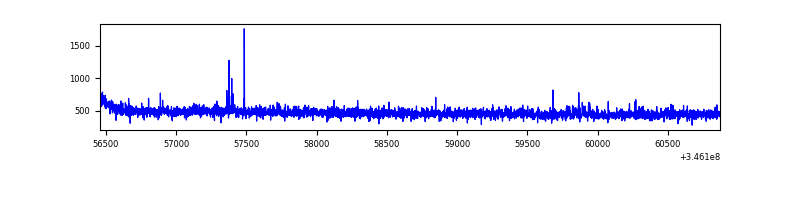 |
| D | 4413 | 4413 | 171 | 171 | 3.87% | 3.87% | 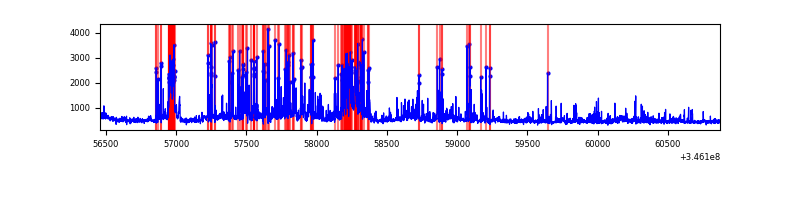 |
Top three noisy pixels from each quadrant. If the there are fewer than three noisy pixels in the level2.evt file, extra rows are filled as -1
| Pixel properties | Quadrant properties | ||||||
|---|---|---|---|---|---|---|---|
| Quadrant | DetID | PixID | Counts | Sigma | Mean | Median | Sigma |
| A | 15 | 169 | 48459 | 446.46 | 520 | 510 | 107.4 |
| A | 13 | 254 | 7255 | 62.8 | 520 | 510 | 107.4 |
| A | 3 | 137 | 5164 | 43.33 | 520 | 510 | 107.4 |
| B | 10 | 245 | 156846 | 1568.02 | 514 | 501 | 99.7 |
| B | 10 | 246 | 34848 | 344.47 | 514 | 501 | 99.7 |
| B | 12 | 111 | 12450 | 119.84 | 514 | 501 | 99.7 |
| C | 14 | 238 | 79688 | 664.47 | 499 | 501 | 119.2 |
| C | 3 | 233 | 27759 | 228.72 | 499 | 501 | 119.2 |
| C | 13 | 61 | 3290 | 23.4 | 499 | 501 | 119.2 |
| D | 1 | 52 | 615262 | 5119.85 | 498 | 486 | 120.1 |
| D | 8 | 195 | 314126 | 2611.99 | 498 | 486 | 120.1 |
| D | 2 | 250 | 123380 | 1023.46 | 498 | 486 | 120.1 |
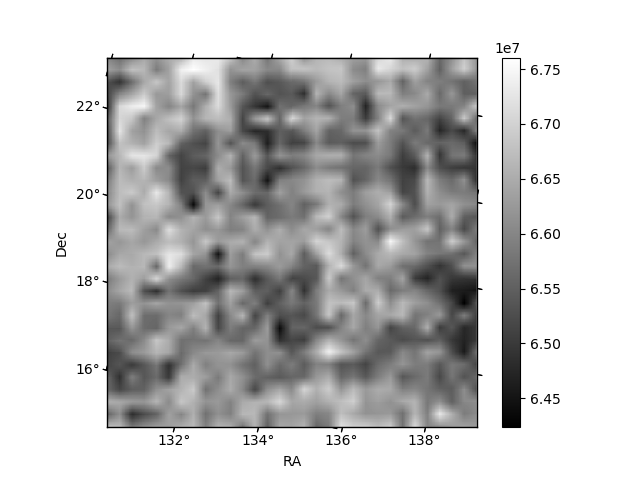
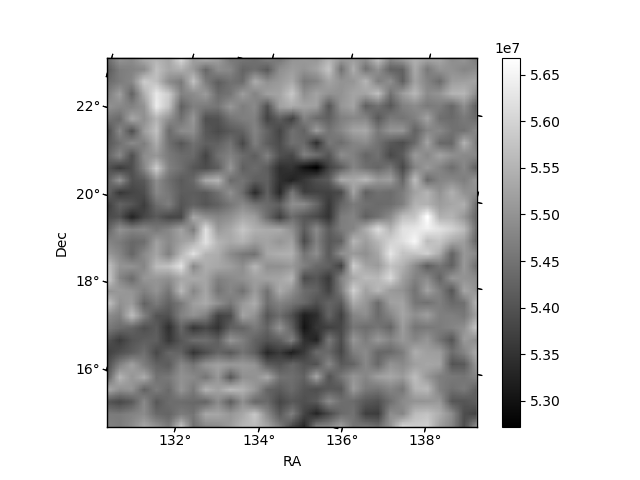
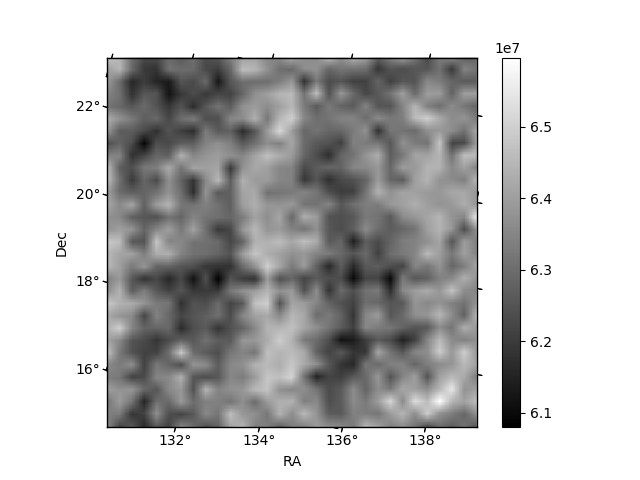
Histogram calculated using DETX and DETY for each event in the final _common_clean file
| Quadrant A |  |
 |
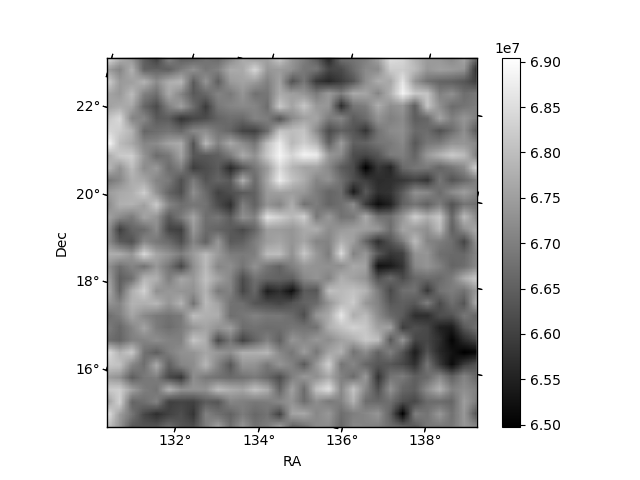
Quadrant B |
|---|---|---|---|
| Quadrant D | 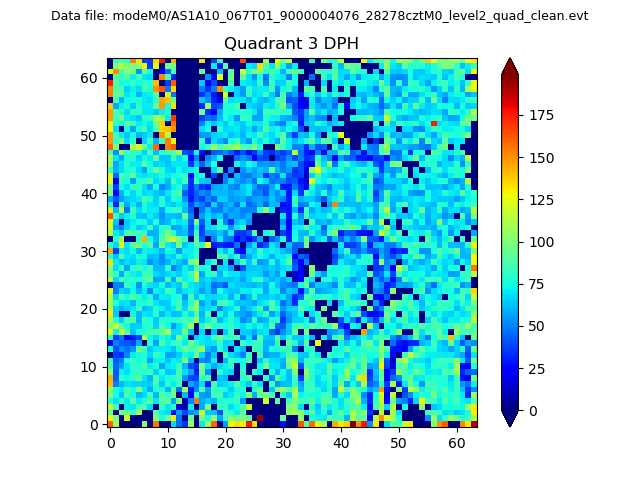 |
 |
Quadrant C |
| Plot type | Count rate plots | Images |
|---|---|---|
| Comparison with Poisson distribution Blue bars denote a histogram of data divided into 1 sec bins. Red curve is a Poisson curve with rate = median count rate of data. |
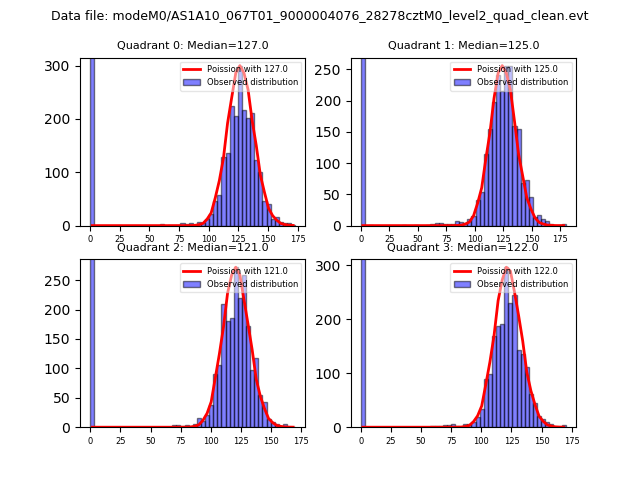 |
 |
| Quadrant-wise count rates Data is divided into 100 sec bins |
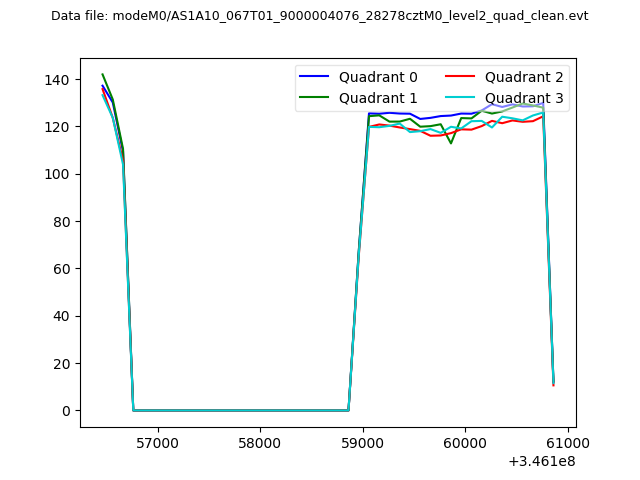 |
|
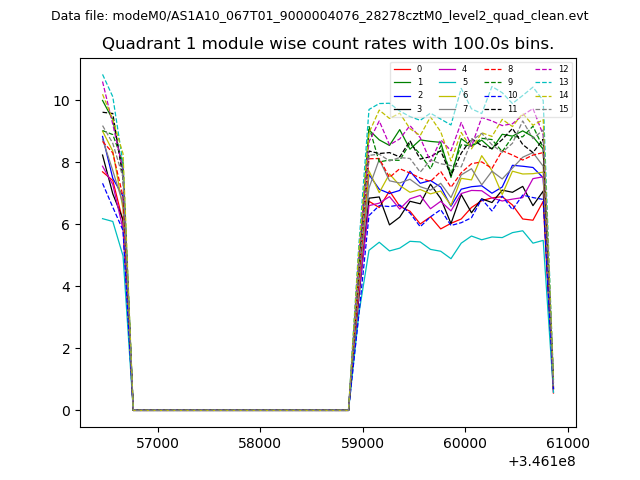
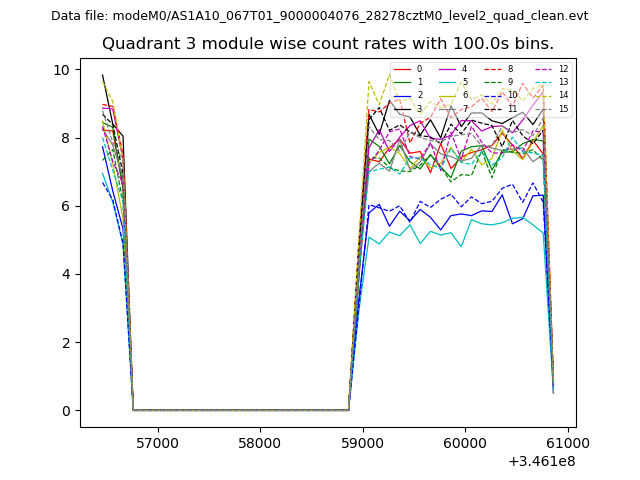
| Module-wise count rates for Quadrant A Data is divided into 100 sec bins |
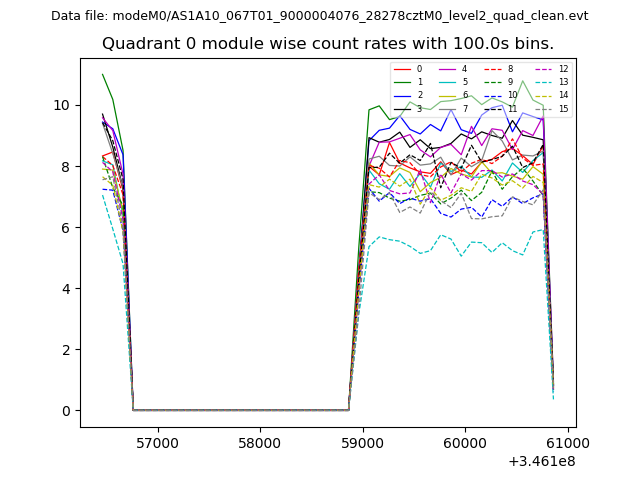 |
 |
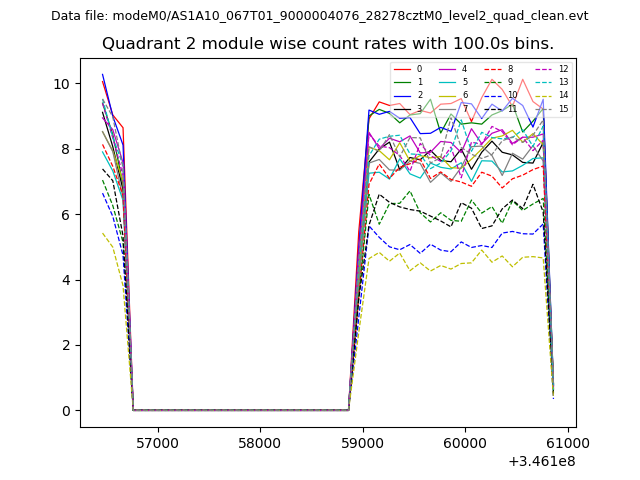
| Module-wise count rates for Quadrant B Data is divided into 100 sec bins |
 |
 |
| Module-wise count rates for Quadrant C Data is divided into 100 sec bins |
 |
 |
| Module-wise count rates for Quadrant D Data is divided into 100 sec bins |
 |
 |
| Parameter | Plot |
|---|---|
| CZT HV Monitor | 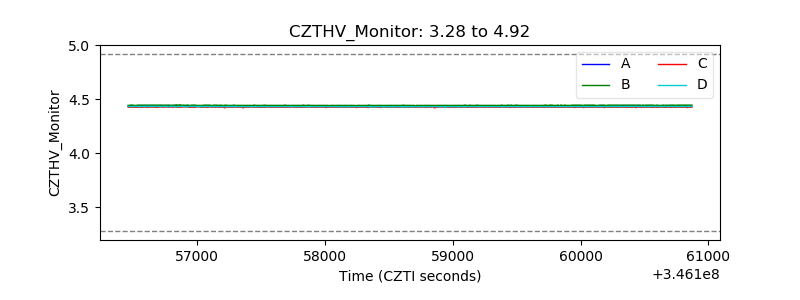 |
| D_VDD | 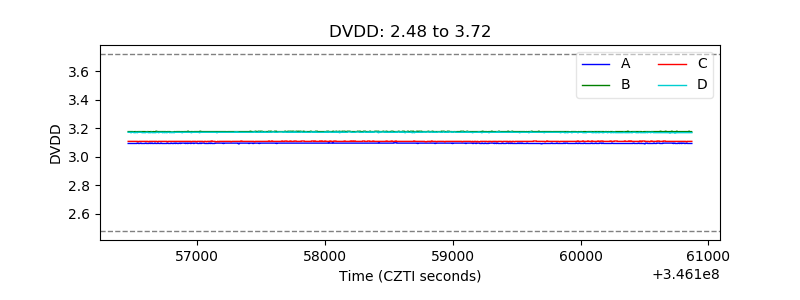 |
| Temperature 1 | 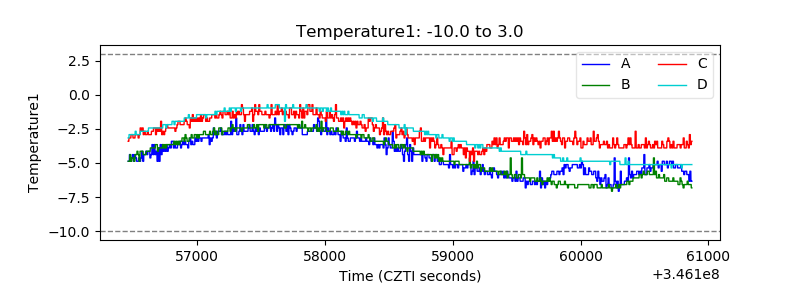 |
| Veto HV Monitor | 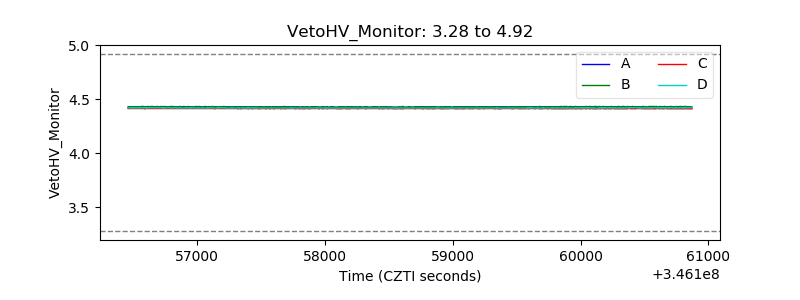 |
| Veto LLD | 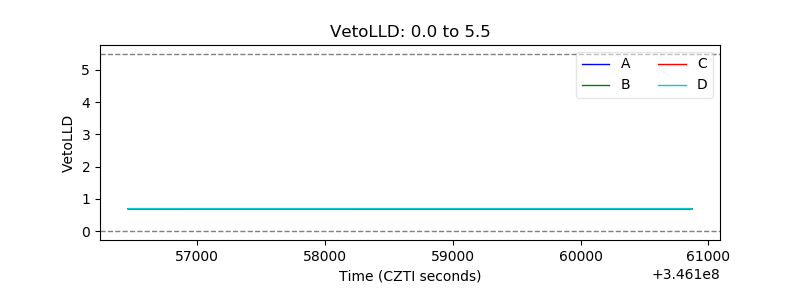 |
| Alpha Counter | 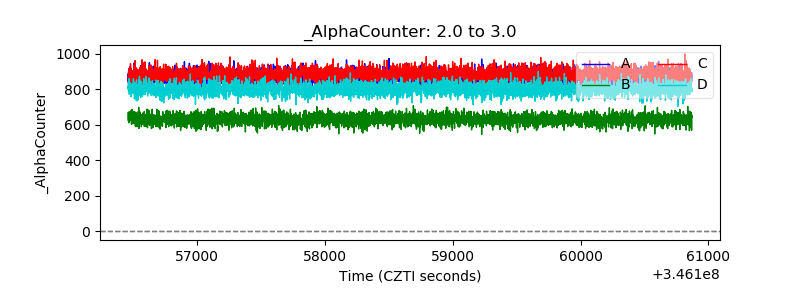 |
| _CPM_Rate | 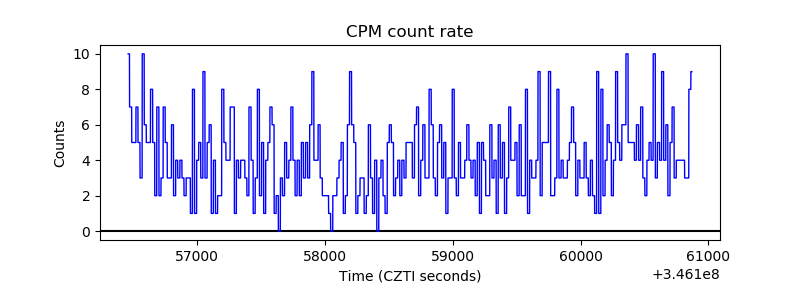 |
| CZT Counter |  |
| +2.5 Volts monitor |  |
| +5 Volts monitor | 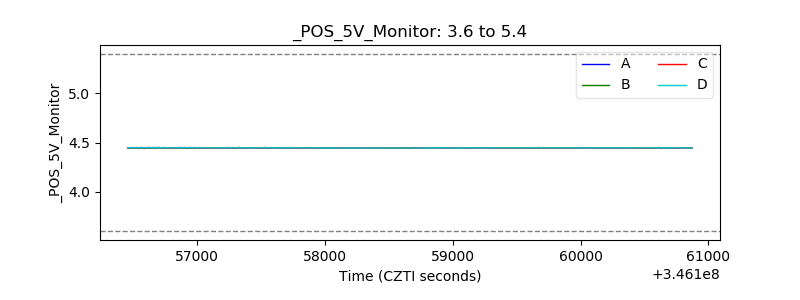 |
| _ROLL_ROT |  |
| _Roll_DEC | 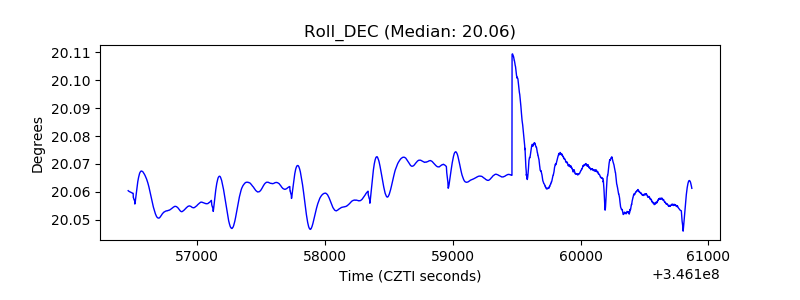 |
| _Roll_RA |  |
| Veto Counter | 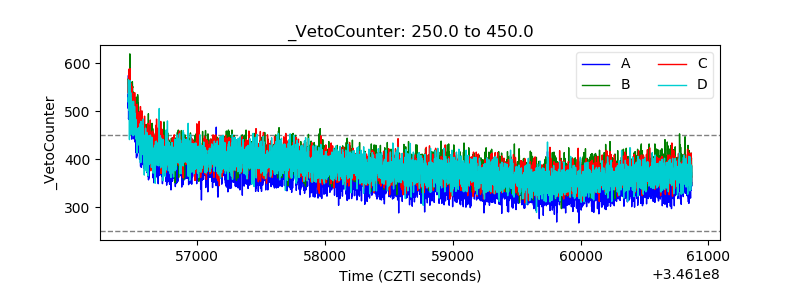 |