| Param | Original file | Final file |
|---|---|---|
| Filename | modeM0/AS1A10_067T01_9000004076_28423cztM0_level2.evt | modeM0/AS1A10_067T01_9000004076_28423cztM0_level2_quad_clean.evt |
| Size (bytes) | 189,408,960 | 37,555,200 |
| Size | 180.6 MB | 35.8 MB |
| Events in quadrant A | 1,042,536 | 257,317 |
| Events in quadrant B | 1,039,414 | 262,603 |
| Events in quadrant C | 1,041,691 | 248,530 |
| Events in quadrant D | 2,467,640 | 216,077 |
| Mode M0 | |||
|---|---|---|---|
| Quadrant | BADHDUFLAG | Total packets | Discarded packets |
| A | 0 | 4321 | 0 |
| B | 0 | 4312 | 0 |
| C | 0 | 4346 | 0 |
| D | 0 | 8736 | 0 |
| Mode M9 | |||
|---|---|---|---|
| Quadrant | BADHDUFLAG | Total packets | Discarded packets |
| A | 0 | 8 | 1 |
| B | 0 | 8 | 4 |
| C | 0 | 8 | 1 |
| D | 0 | 8 | 2 |
| Quadrant | Total seconds | Saturated seconds | Saturation percentage |
|---|---|---|---|
| A | 2099 | 40 | 1.905669% |
| B | 2099 | 32 | 1.524535% |
| C | 2094 | 41 | 1.957975% |
| D | 2082 | 490 | 23.535062% |
Noise dominated data is calculated using 1-second bins in cleaned event files. If a bin has >2000 counts, and if more than 50% of those come from <1% of pixels, then it is considered to be noise-dominated and hence unusable.
| Quadrant | # 1 sec bins | Bins with >0 counts | Bins with >2000 counts | High rate bins dominated by noise | Noise dominated (total time) | Noise dominated (detector-on time) | Marked lightcurve |
|---|---|---|---|---|---|---|---|
| A | 2977 | 2110 | 0 | 0 | 0.00% | 0.00% | 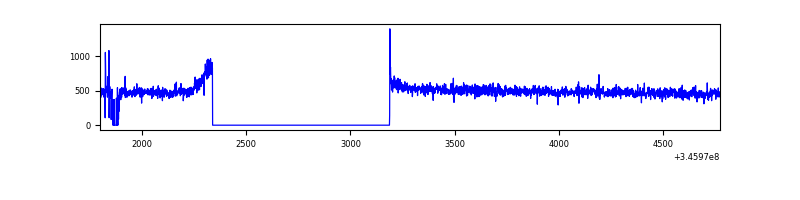 |
| B | 2977 | 2108 | 0 | 0 | 0.00% | 0.00% | 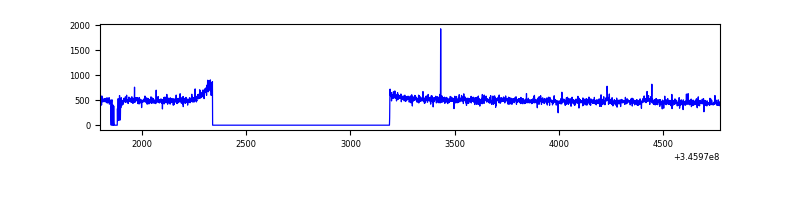 |
| C | 2977 | 2100 | 1 | 1 | 0.03% | 0.05% | 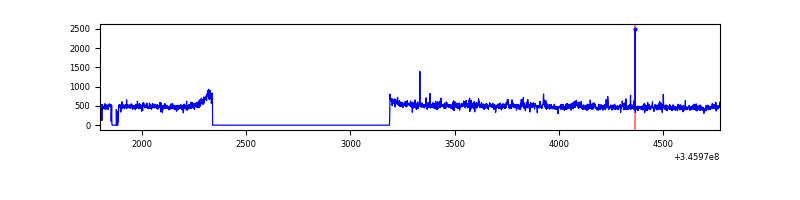 |
| D | 2976 | 2091 | 423 | 423 | 14.21% | 20.23% | 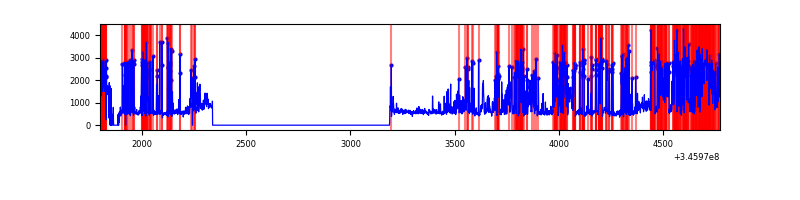 |
Top three noisy pixels from each quadrant. If the there are fewer than three noisy pixels in the level2.evt file, extra rows are filled as -1
| Pixel properties | Quadrant properties | ||||||
|---|---|---|---|---|---|---|---|
| Quadrant | DetID | PixID | Counts | Sigma | Mean | Median | Sigma |
| A | 15 | 174 | 3485 | 57.05 | 268 | 262 | 56.5 |
| A | 13 | 254 | 2731 | 43.7 | 268 | 262 | 56.5 |
| A | 3 | 137 | 2720 | 43.51 | 268 | 262 | 56.5 |
| B | 12 | 111 | 6478 | 118.22 | 262 | 256 | 52.6 |
| B | 11 | 111 | 5857 | 106.42 | 262 | 256 | 52.6 |
| B | 14 | 111 | 5608 | 101.69 | 262 | 256 | 52.6 |
| C | 14 | 238 | 39923 | 659.93 | 250 | 250 | 60.1 |
| C | 7 | 220 | 26448 | 435.78 | 250 | 250 | 60.1 |
| C | 13 | 61 | 1693 | 24.0 | 250 | 250 | 60.1 |
| D | 1 | 52 | 1388358 | 24664.28 | 230 | 224 | 56.3 |
| D | 8 | 195 | 110697 | 1962.88 | 230 | 224 | 56.3 |
| D | 7 | 238 | 52591 | 930.45 | 230 | 224 | 56.3 |
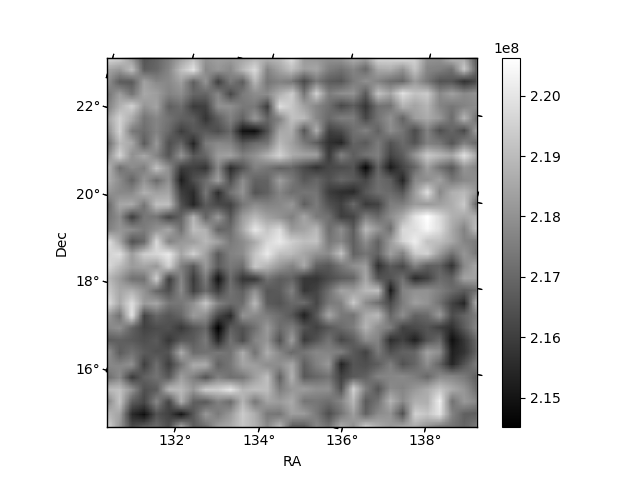
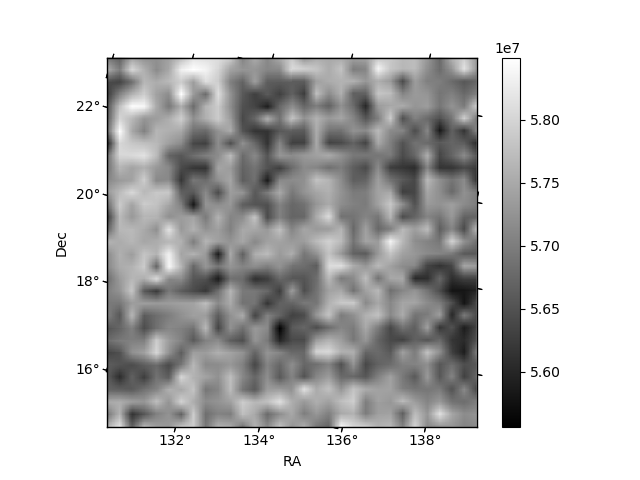
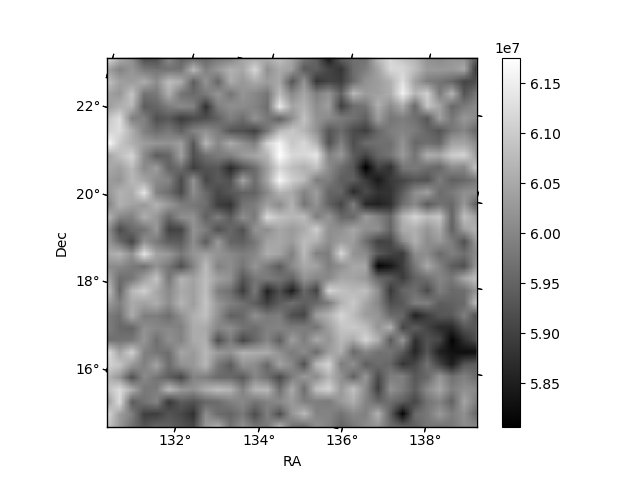
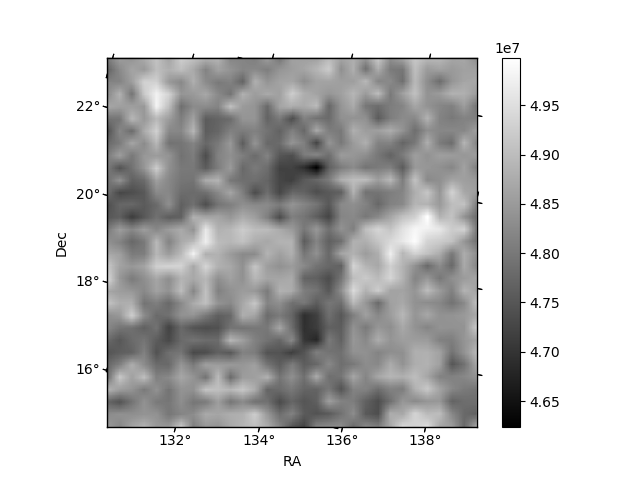
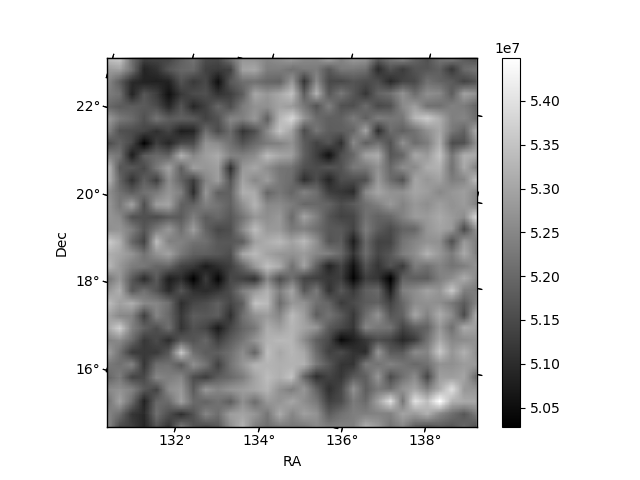
Histogram calculated using DETX and DETY for each event in the final _common_clean file
| Quadrant A | 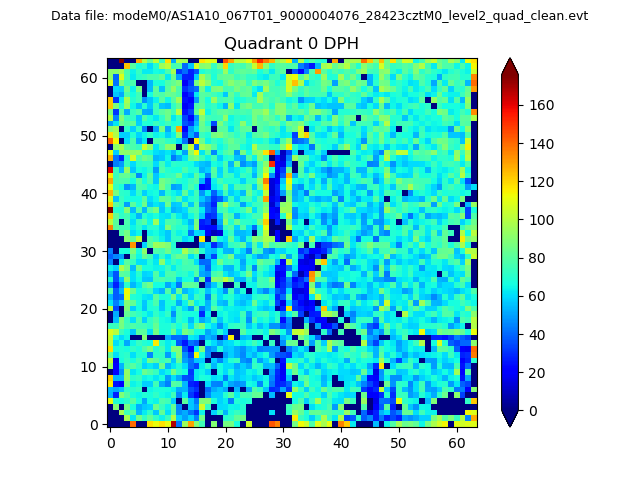 |
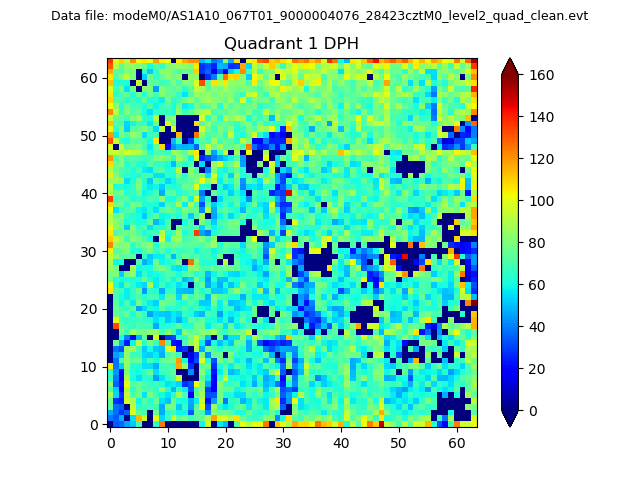 |
Quadrant B |
|---|---|---|---|
| Quadrant D | 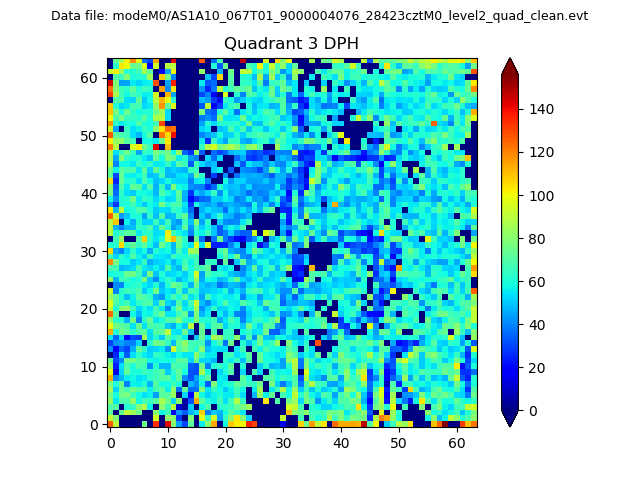 |
 |
Quadrant C |
| Plot type | Count rate plots | Images |
|---|---|---|
| Comparison with Poisson distribution Blue bars denote a histogram of data divided into 1 sec bins. Red curve is a Poisson curve with rate = median count rate of data. |
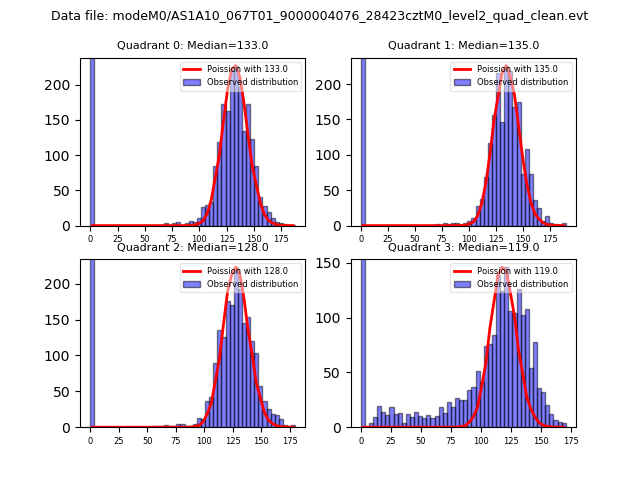 |
 |
| Quadrant-wise count rates Data is divided into 100 sec bins |
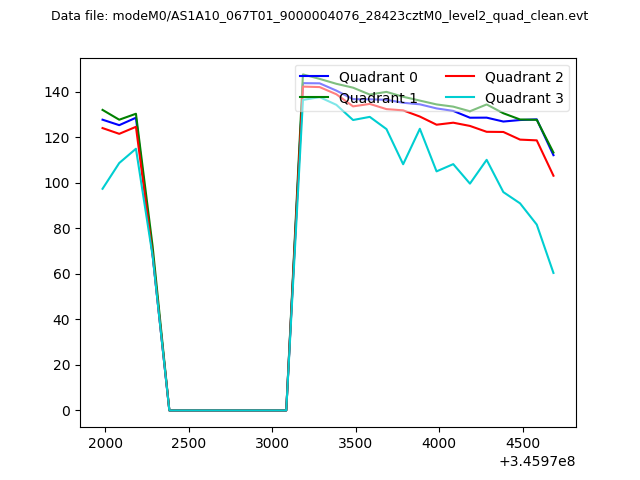 |
|
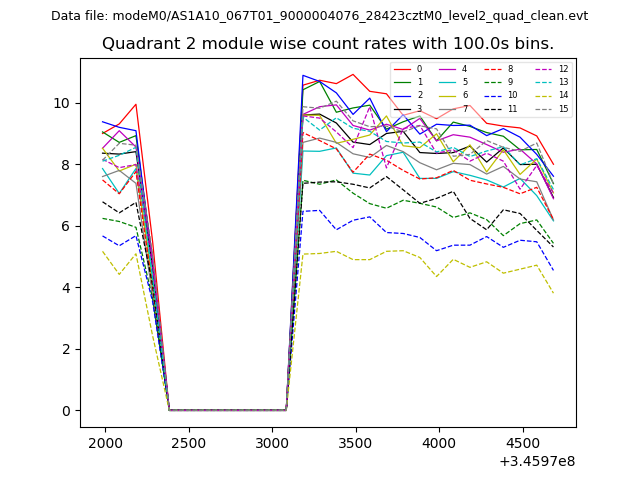
| Module-wise count rates for Quadrant A Data is divided into 100 sec bins |
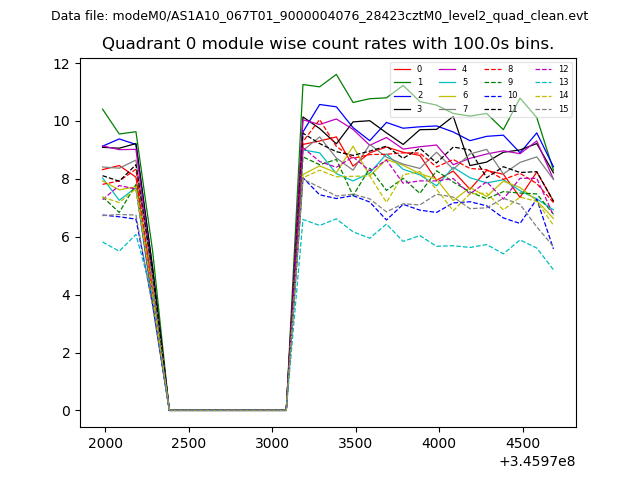 |
 |
| Module-wise count rates for Quadrant B Data is divided into 100 sec bins |
 |
 |
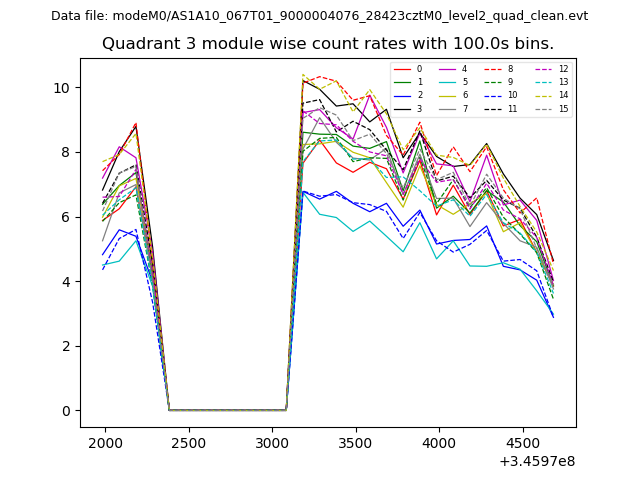
| Module-wise count rates for Quadrant C Data is divided into 100 sec bins |
 |
 |
| Module-wise count rates for Quadrant D Data is divided into 100 sec bins |
 |
 |
| Parameter | Plot |
|---|---|
| CZT HV Monitor | 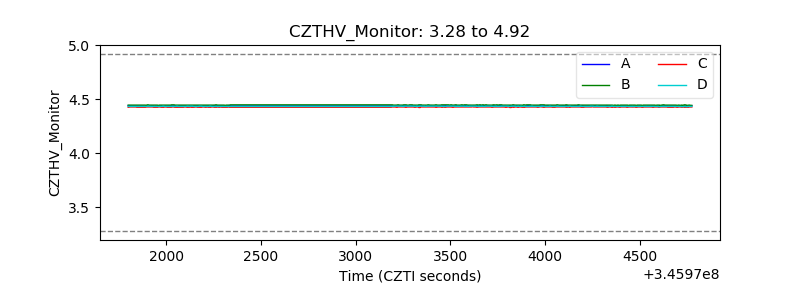 |
| D_VDD | 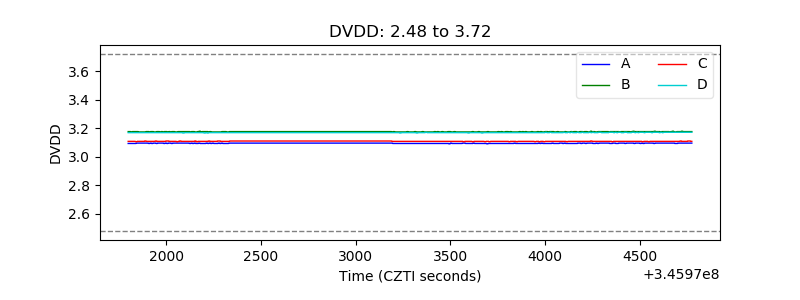 |
| Temperature 1 |  |
| Veto HV Monitor | 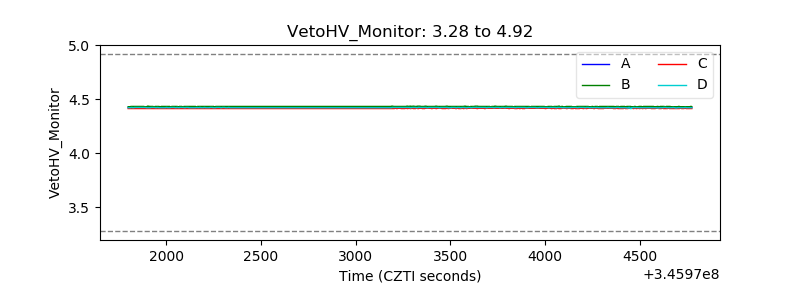 |
| Veto LLD |  |
| Alpha Counter | 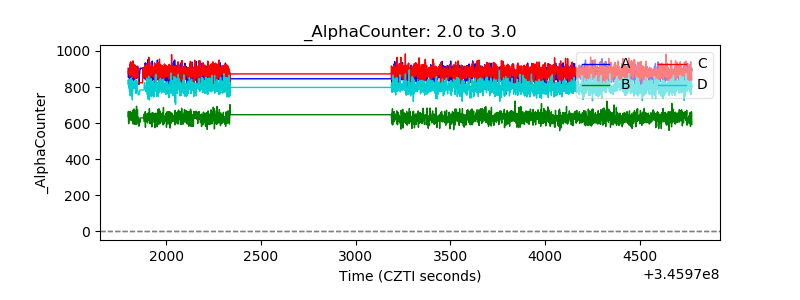 |
| _CPM_Rate | 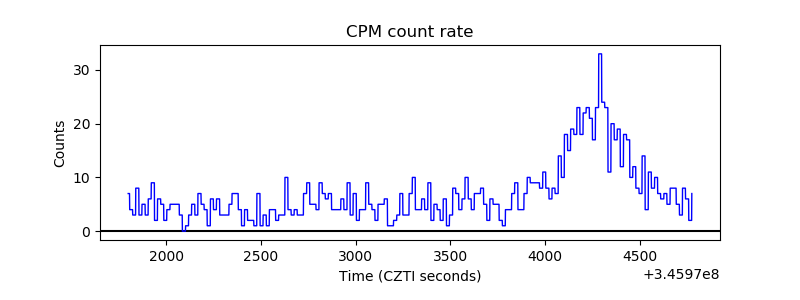 |
| CZT Counter |  |
| +2.5 Volts monitor | 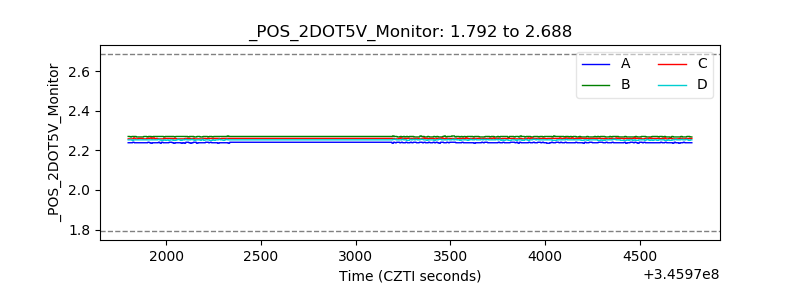 |
| +5 Volts monitor | 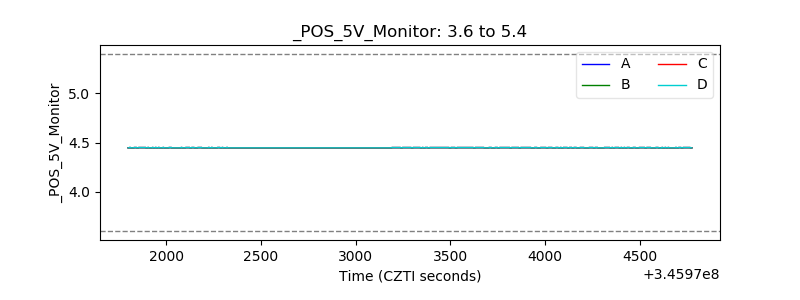 |
| _ROLL_ROT | 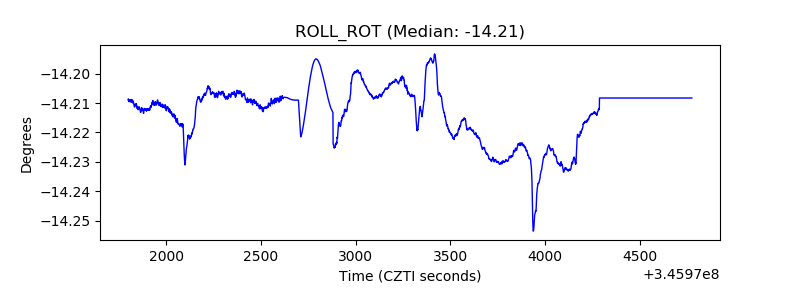 |
| _Roll_DEC | 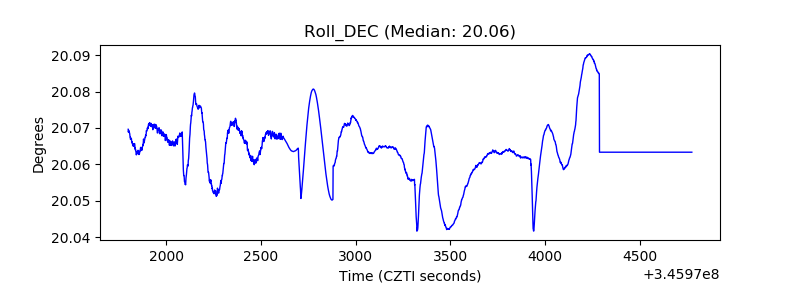 |
| _Roll_RA | 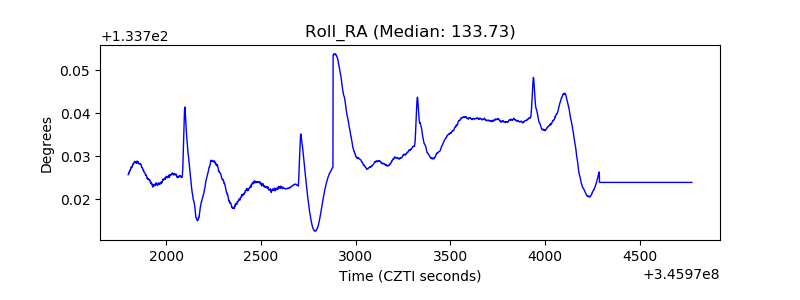 |
| Veto Counter | 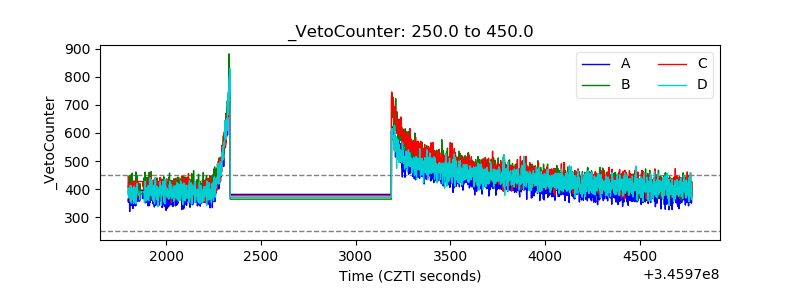 |