| Param | Original file | Final file |
|---|---|---|
| Filename | modeM0/AS1A10_102T06_9000004078_28278cztM0_level2.evt | modeM0/AS1A10_102T06_9000004078_28278cztM0_level2_quad_clean.evt |
| Size (bytes) | 965,577,600 | 171,599,040 |
| Size | 920.8 MB | 163.6 MB |
| Events in quadrant A | 6,135,561 | 1,096,569 |
| Events in quadrant B | 6,355,288 | 1,106,580 |
| Events in quadrant C | 6,209,817 | 1,061,329 |
| Events in quadrant D | 9,652,894 | 1,024,613 |
| Mode M9 | |||
|---|---|---|---|
| Quadrant | BADHDUFLAG | Total packets | Discarded packets |
| A | 0 | 20 | 0 |
| B | 0 | 20 | 0 |
| C | 0 | 20 | 0 |
| D | 0 | 20 | 0 |
| Mode M0 | |||
|---|---|---|---|
| Quadrant | BADHDUFLAG | Total packets | Discarded packets |
| A | 0 | 26854 | 0 |
| B | 0 | 27430 | 0 |
| C | 0 | 27000 | 0 |
| D | 0 | 37585 | 0 |
| Quadrant | Total seconds | Saturated seconds | Saturation percentage |
|---|---|---|---|
| A | 13136 | 141 | 1.073386% |
| B | 13136 | 197 | 1.499695% |
| C | 13135 | 219 | 1.667301% |
| D | 13135 | 828 | 6.303769% |
Noise dominated data is calculated using 1-second bins in cleaned event files. If a bin has >2000 counts, and if more than 50% of those come from <1% of pixels, then it is considered to be noise-dominated and hence unusable.
| Quadrant | # 1 sec bins | Bins with >0 counts | Bins with >2000 counts | High rate bins dominated by noise | Noise dominated (total time) | Noise dominated (detector-on time) | Marked lightcurve |
|---|---|---|---|---|---|---|---|
| A | 15191 | 13136 | 0 | 0 | 0.00% | 0.00% | 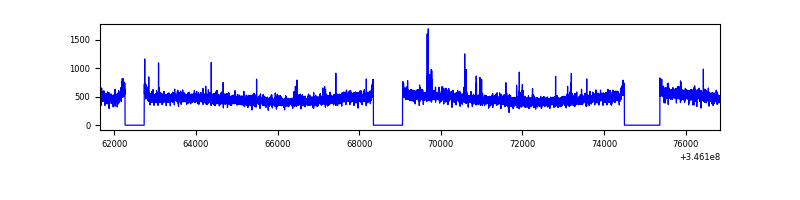 |
| B | 15191 | 13137 | 28 | 28 | 0.18% | 0.21% | 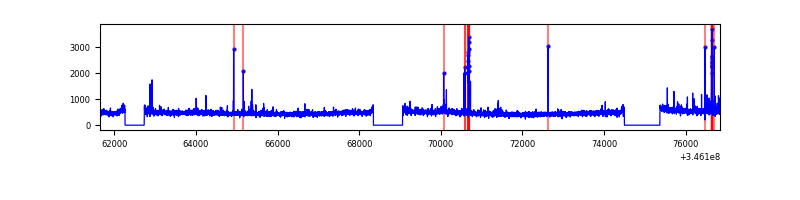 |
| C | 15190 | 13136 | 9 | 9 | 0.06% | 0.07% | 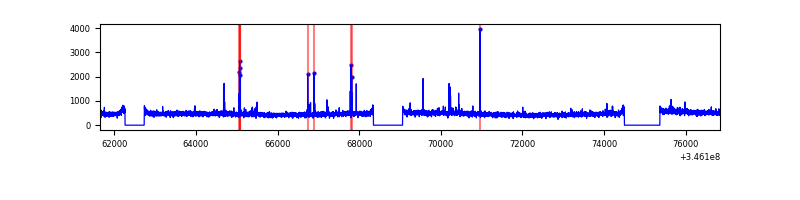 |
| D | 15190 | 13136 | 545 | 545 | 3.59% | 4.15% | 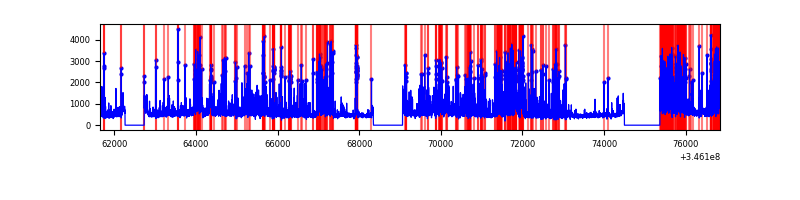 |
Top three noisy pixels from each quadrant. If the there are fewer than three noisy pixels in the level2.evt file, extra rows are filled as -1
| Pixel properties | Quadrant properties | ||||||
|---|---|---|---|---|---|---|---|
| Quadrant | DetID | PixID | Counts | Sigma | Mean | Median | Sigma |
| A | 15 | 169 | 53830 | 164.65 | 1575 | 1539 | 317.6 |
| A | 13 | 254 | 22762 | 66.82 | 1575 | 1539 | 317.6 |
| A | 3 | 137 | 15392 | 43.62 | 1575 | 1539 | 317.6 |
| B | 4 | 200 | 83482 | 278.06 | 1556 | 1517 | 294.8 |
| B | 15 | 32 | 50338 | 165.62 | 1556 | 1517 | 294.8 |
| B | 0 | 230 | 37951 | 123.6 | 1556 | 1517 | 294.8 |
| C | 14 | 238 | 240517 | 682.77 | 1500 | 1504 | 350.1 |
| C | 15 | 208 | 81017 | 227.14 | 1500 | 1504 | 350.1 |
| C | 3 | 233 | 49438 | 136.93 | 1500 | 1504 | 350.1 |
| D | 1 | 52 | 2642127 | 7457.8 | 1486 | 1443 | 354.1 |
| D | 12 | 250 | 553419 | 1558.89 | 1486 | 1443 | 354.1 |
| D | 8 | 195 | 383579 | 1079.23 | 1486 | 1443 | 354.1 |
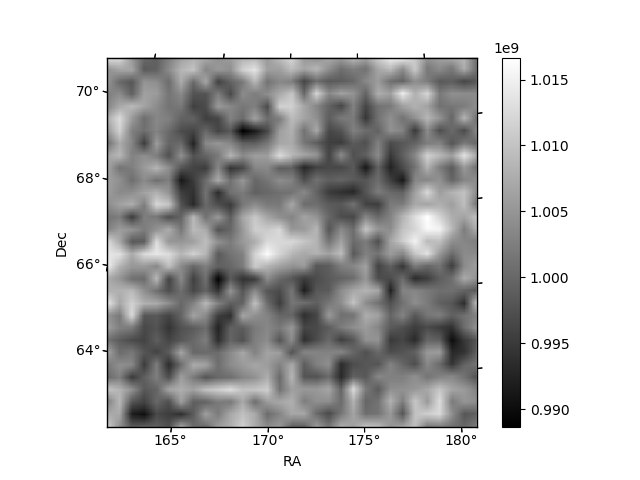
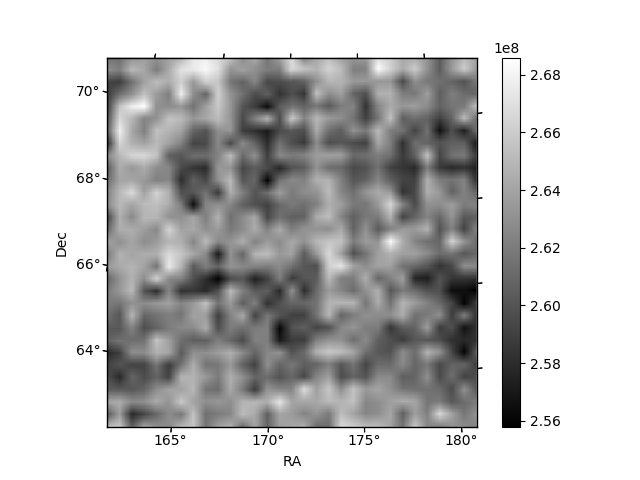
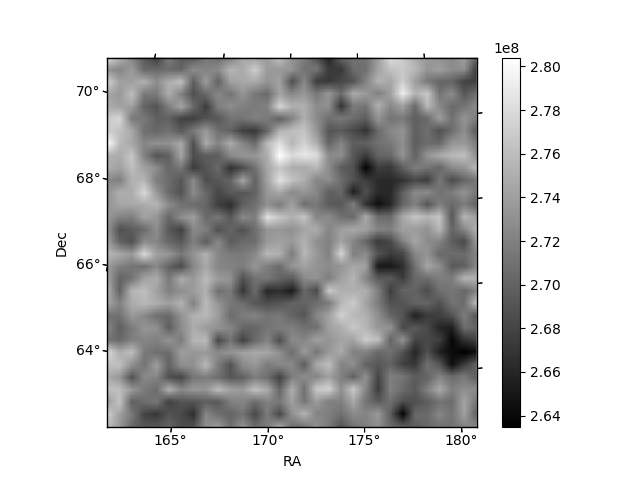
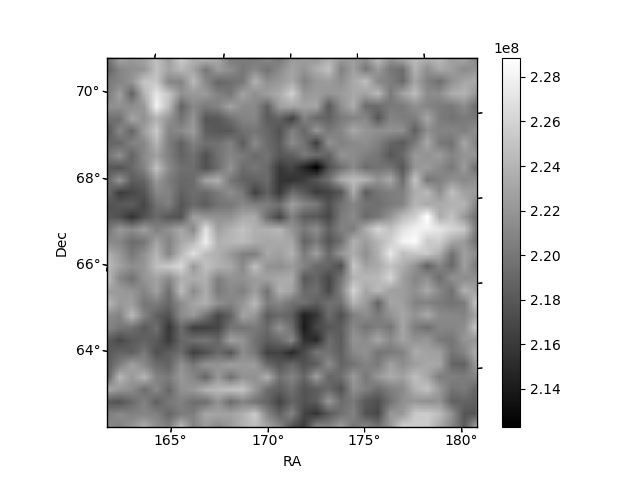
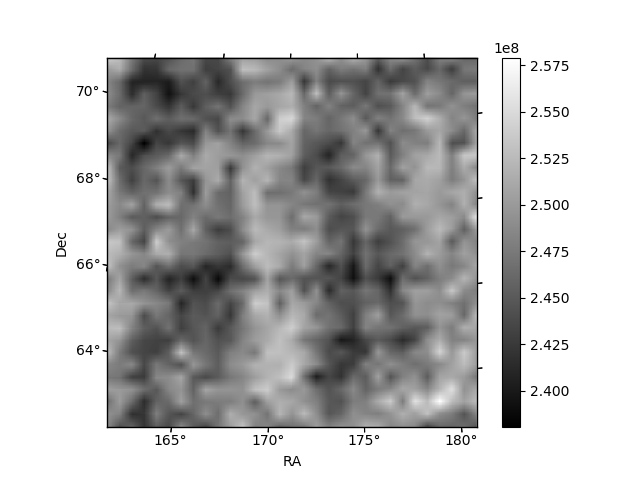
Histogram calculated using DETX and DETY for each event in the final _common_clean file
| Quadrant A | 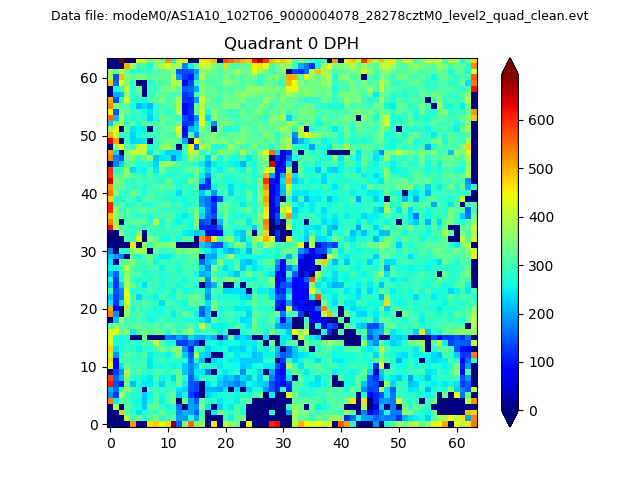 |
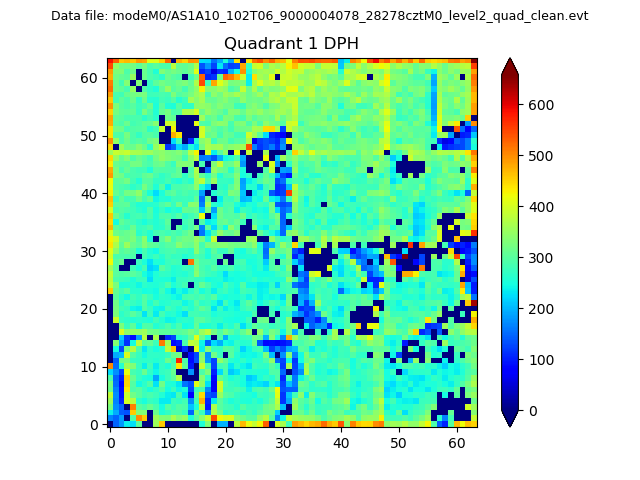 |
Quadrant B |
|---|---|---|---|
| Quadrant D | 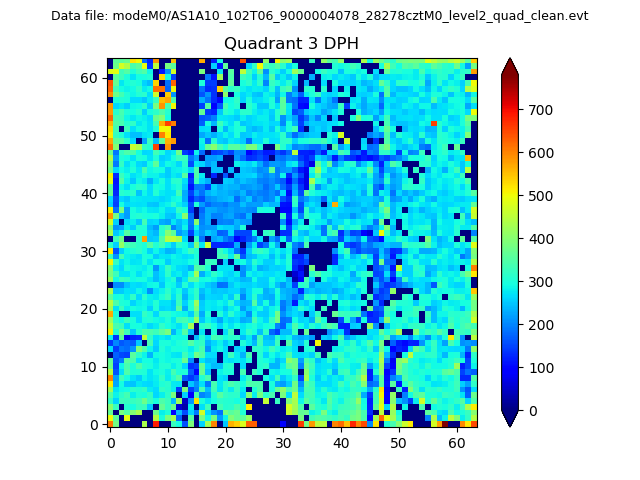 |
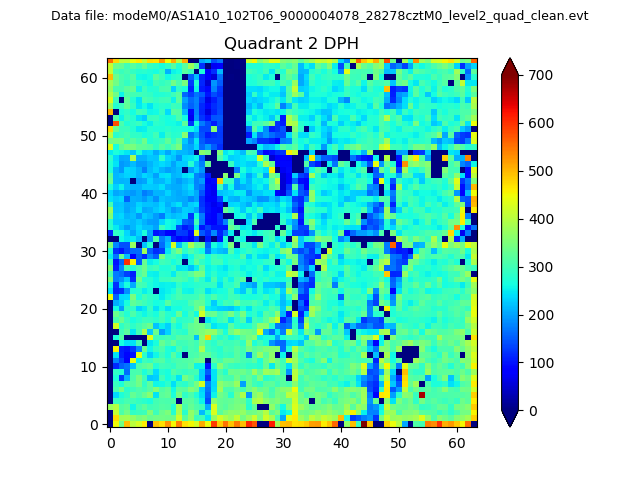 |
Quadrant C |
| Plot type | Count rate plots | Images |
|---|---|---|
| Comparison with Poisson distribution Blue bars denote a histogram of data divided into 1 sec bins. Red curve is a Poisson curve with rate = median count rate of data. |
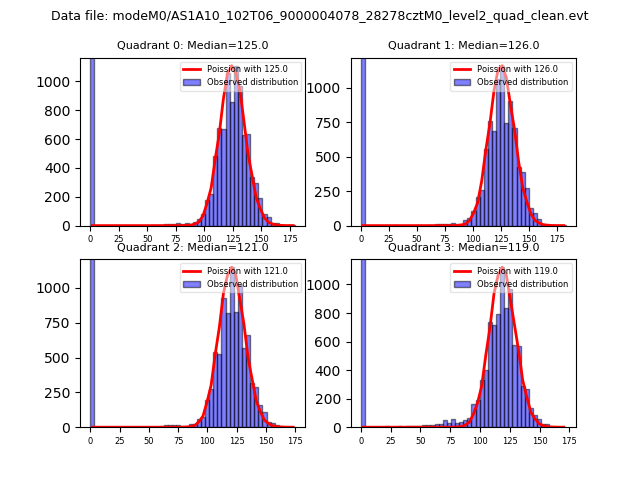 |
 |
| Quadrant-wise count rates Data is divided into 100 sec bins |
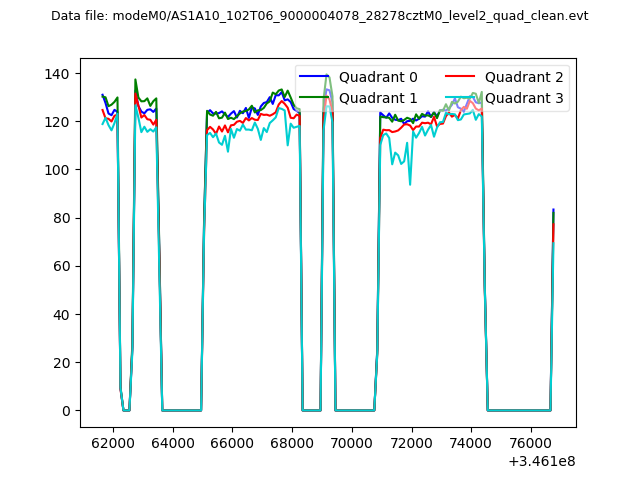 |
|
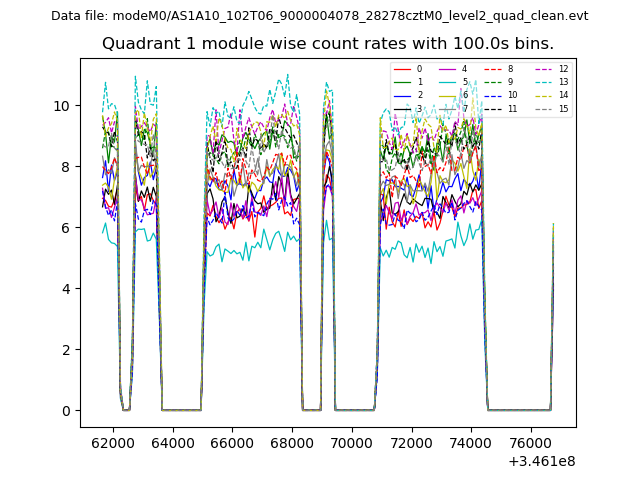
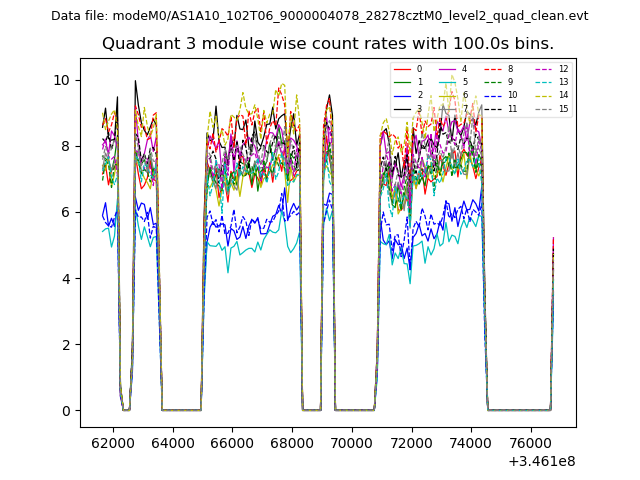
| Module-wise count rates for Quadrant A Data is divided into 100 sec bins |
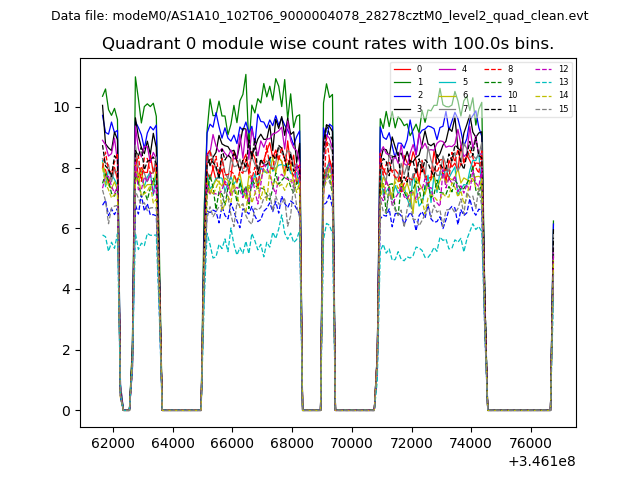 |
 |
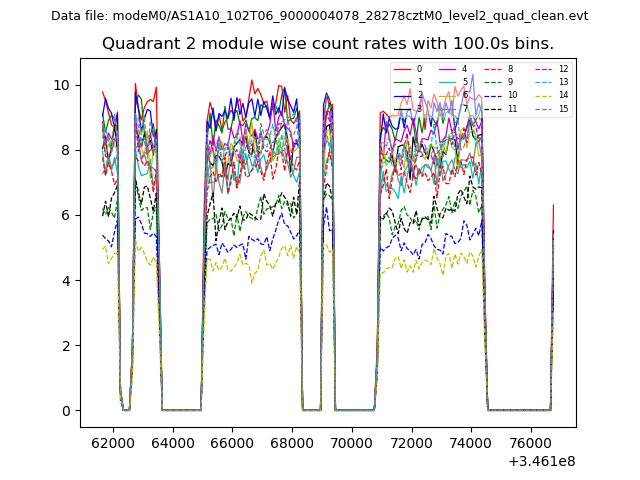
| Module-wise count rates for Quadrant B Data is divided into 100 sec bins |
 |
 |
| Module-wise count rates for Quadrant C Data is divided into 100 sec bins |
 |
 |
| Module-wise count rates for Quadrant D Data is divided into 100 sec bins |
 |
 |
| Parameter | Plot |
|---|---|
| CZT HV Monitor | 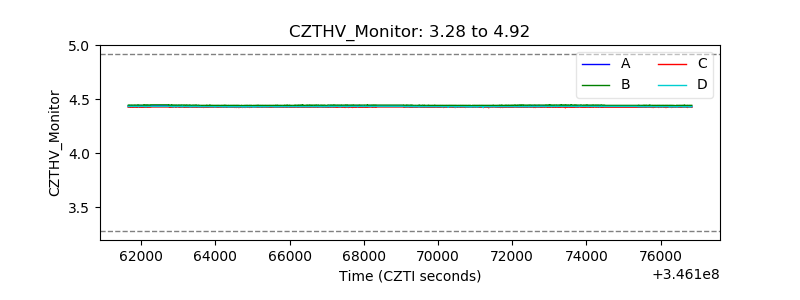 |
| D_VDD | 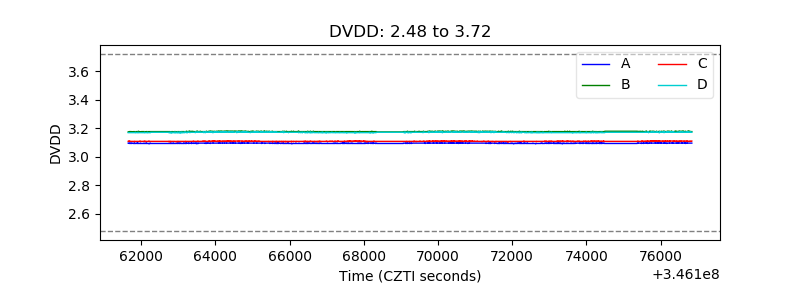 |
| Temperature 1 | 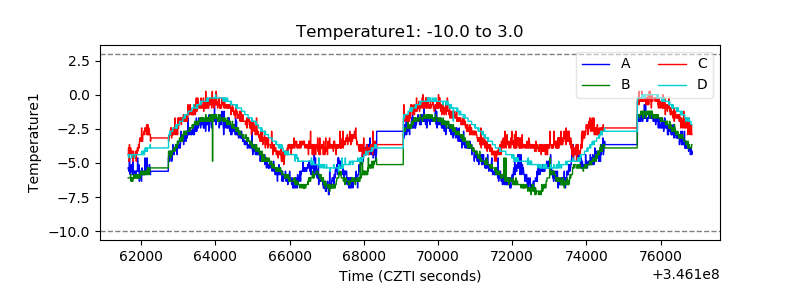 |
| Veto HV Monitor | 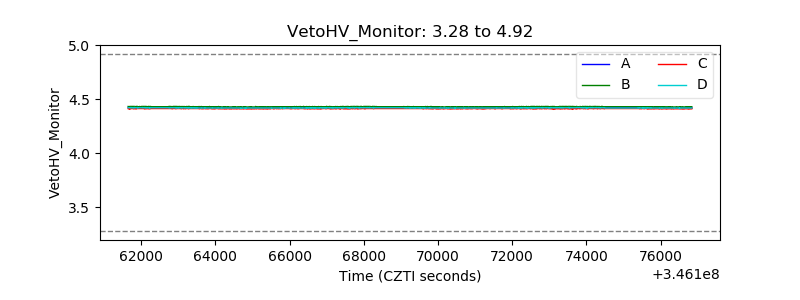 |
| Veto LLD | 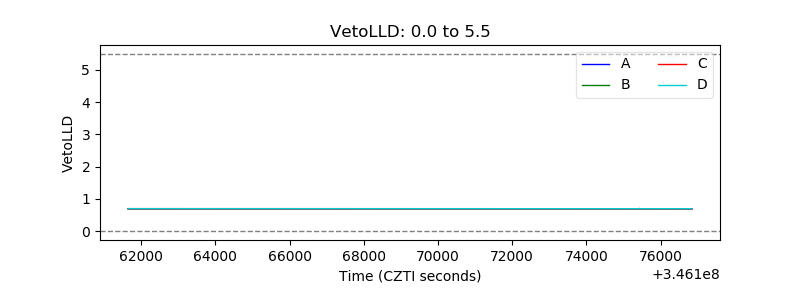 |
| Alpha Counter | 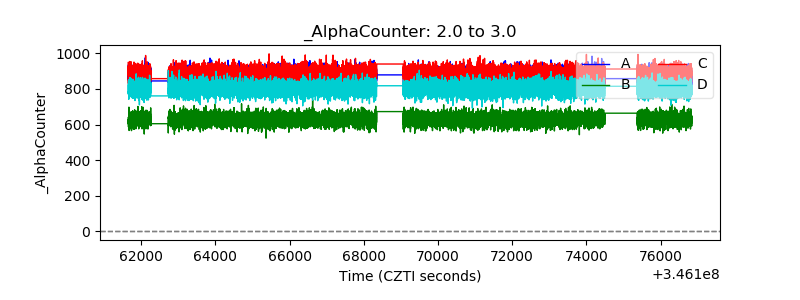 |
| _CPM_Rate | 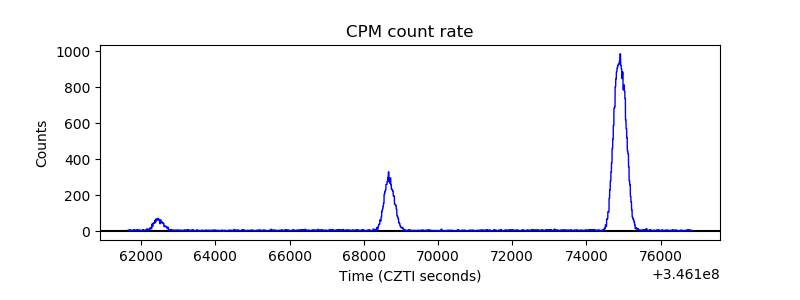 |
| CZT Counter | 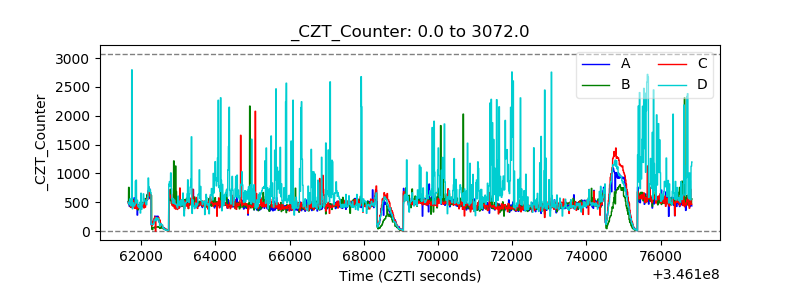 |
| +2.5 Volts monitor | 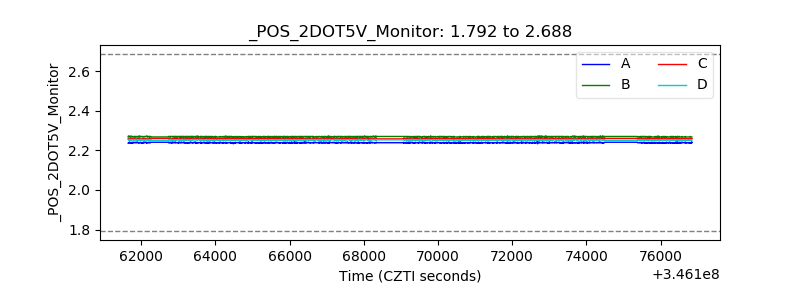 |
| +5 Volts monitor |  |
| _ROLL_ROT | 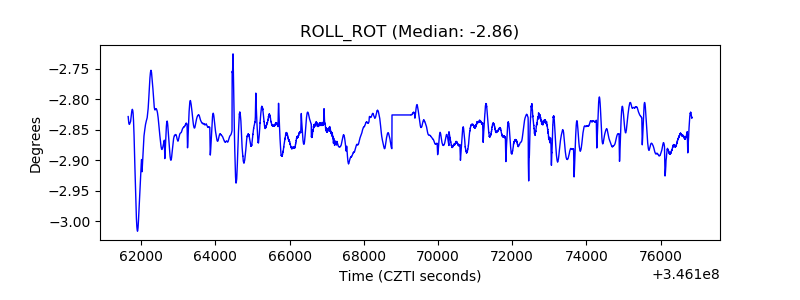 |
| _Roll_DEC | 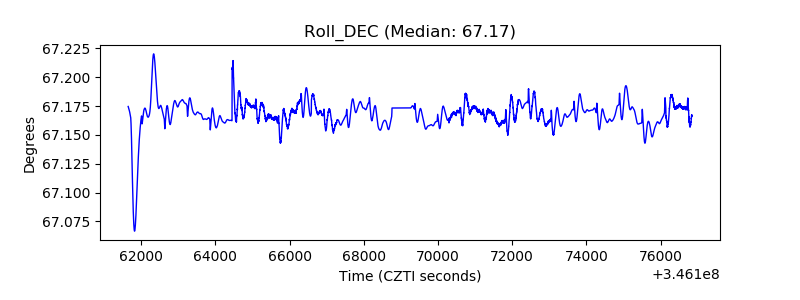 |
| _Roll_RA | 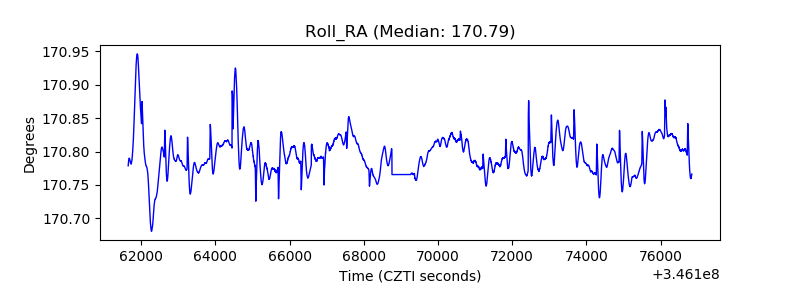 |
| Veto Counter | 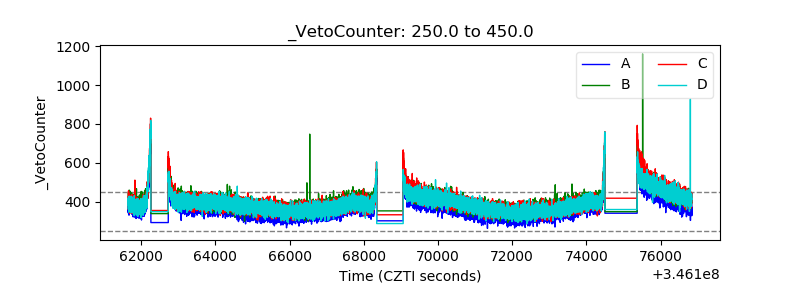 |