| Param | Original file | Final file |
|---|---|---|
| Filename | modeM0/AS1A10_102T06_9000004078_28279cztM0_level2.evt | modeM0/AS1A10_102T06_9000004078_28279cztM0_level2_quad_clean.evt |
| Size (bytes) | 516,833,280 | 81,864,000 |
| Size | 492.9 MB | 78.1 MB |
| Events in quadrant A | 3,038,106 | 523,231 |
| Events in quadrant B | 3,176,220 | 528,514 |
| Events in quadrant C | 3,109,641 | 510,164 |
| Events in quadrant D | 5,896,318 | 472,652 |
| Mode M9 | |||
|---|---|---|---|
| Quadrant | BADHDUFLAG | Total packets | Discarded packets |
| A | 0 | 10 | 0 |
| B | 0 | 10 | 0 |
| C | 0 | 10 | 0 |
| D | 0 | 10 | 0 |
| Mode M0 | |||
|---|---|---|---|
| Quadrant | BADHDUFLAG | Total packets | Discarded packets |
| A | 0 | 13289 | 0 |
| B | 0 | 13723 | 0 |
| C | 0 | 13489 | 0 |
| D | 0 | 21873 | 0 |
| Quadrant | Total seconds | Saturated seconds | Saturation percentage |
|---|---|---|---|
| A | 6366 | 43 | 0.675463% |
| B | 6365 | 72 | 1.131186% |
| C | 6365 | 79 | 1.241163% |
| D | 6366 | 661 | 10.383286% |
Noise dominated data is calculated using 1-second bins in cleaned event files. If a bin has >2000 counts, and if more than 50% of those come from <1% of pixels, then it is considered to be noise-dominated and hence unusable.
| Quadrant | # 1 sec bins | Bins with >0 counts | Bins with >2000 counts | High rate bins dominated by noise | Noise dominated (total time) | Noise dominated (detector-on time) | Marked lightcurve |
|---|---|---|---|---|---|---|---|
| A | 7381 | 6366 | 0 | 0 | 0.00% | 0.00% | 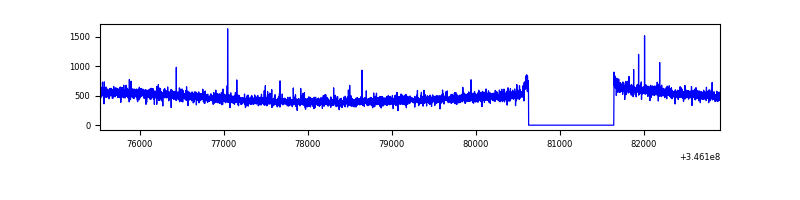 |
| B | 7380 | 6365 | 14 | 14 | 0.19% | 0.22% | 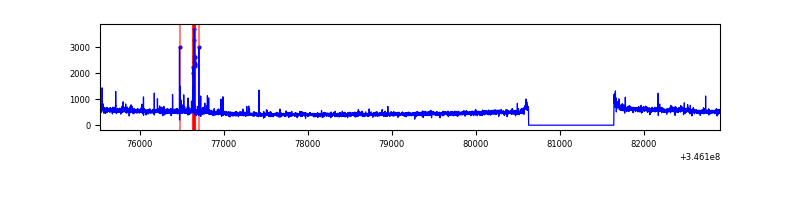 |
| C | 7380 | 6365 | 0 | 0 | 0.00% | 0.00% | 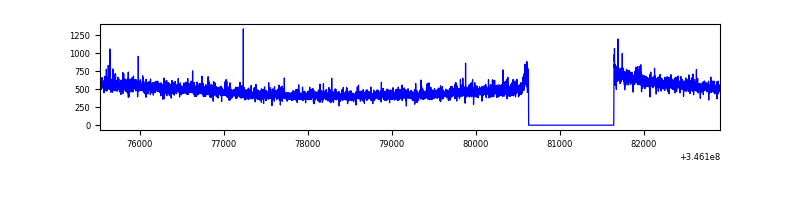 |
| D | 7381 | 6366 | 544 | 544 | 7.37% | 8.55% | 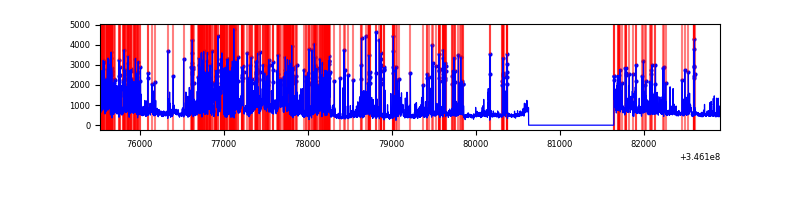 |
Top three noisy pixels from each quadrant. If the there are fewer than three noisy pixels in the level2.evt file, extra rows are filled as -1
| Pixel properties | Quadrant properties | ||||||
|---|---|---|---|---|---|---|---|
| Quadrant | DetID | PixID | Counts | Sigma | Mean | Median | Sigma |
| A | 13 | 254 | 12069 | 71.68 | 783 | 767 | 157.7 |
| A | 3 | 137 | 7558 | 43.07 | 783 | 767 | 157.7 |
| A | 12 | 96 | 6868 | 38.69 | 783 | 767 | 157.7 |
| B | 15 | 32 | 48338 | 329.15 | 776 | 757 | 144.6 |
| B | 4 | 52 | 28776 | 193.83 | 776 | 757 | 144.6 |
| B | 4 | 200 | 21515 | 143.6 | 776 | 757 | 144.6 |
| C | 14 | 238 | 121430 | 678.56 | 757 | 761 | 177.8 |
| C | 3 | 233 | 31900 | 175.11 | 757 | 761 | 177.8 |
| C | 15 | 208 | 7159 | 35.98 | 757 | 761 | 177.8 |
| D | 1 | 52 | 1839384 | 10481.78 | 733 | 712 | 175.4 |
| D | 12 | 250 | 643000 | 3661.51 | 733 | 712 | 175.4 |
| D | 8 | 195 | 358794 | 2041.33 | 733 | 712 | 175.4 |
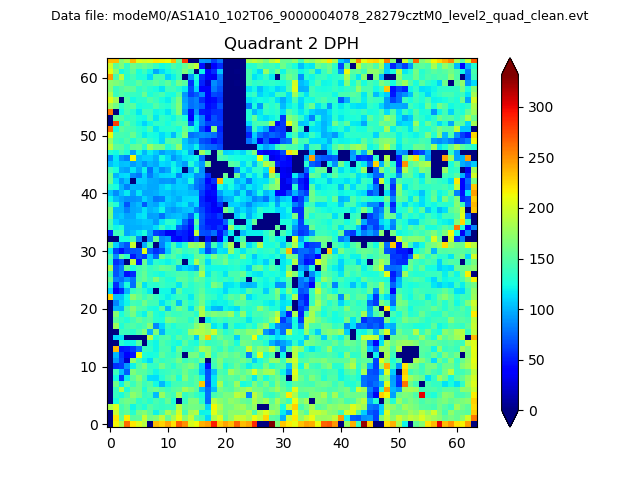
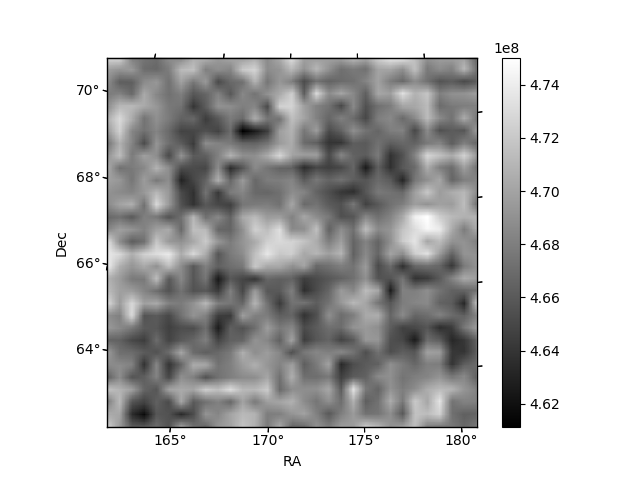
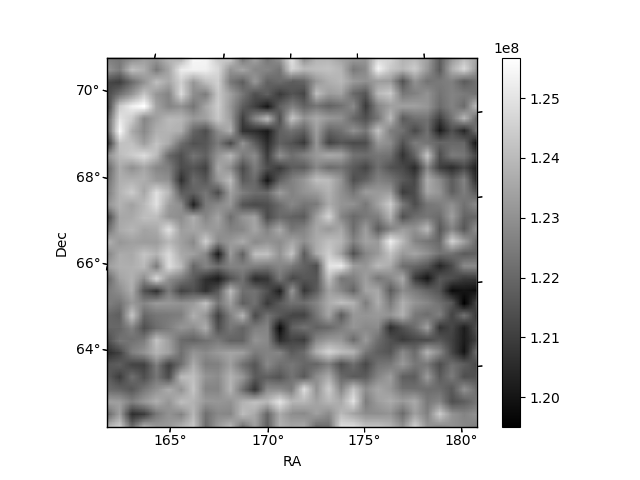
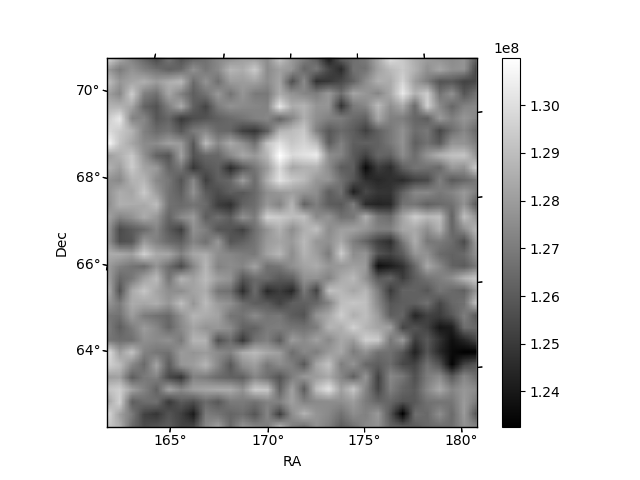
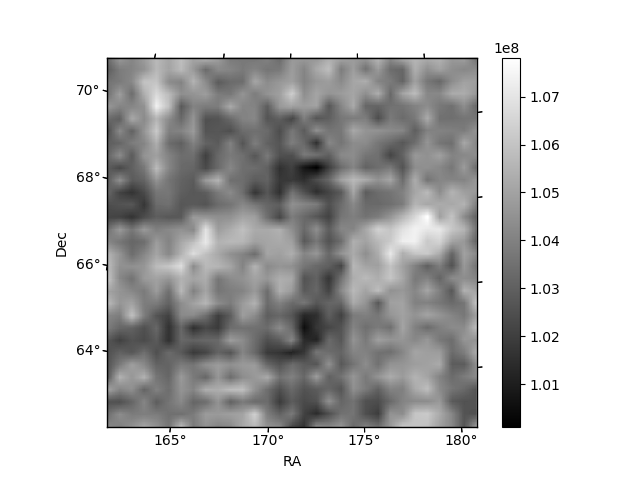
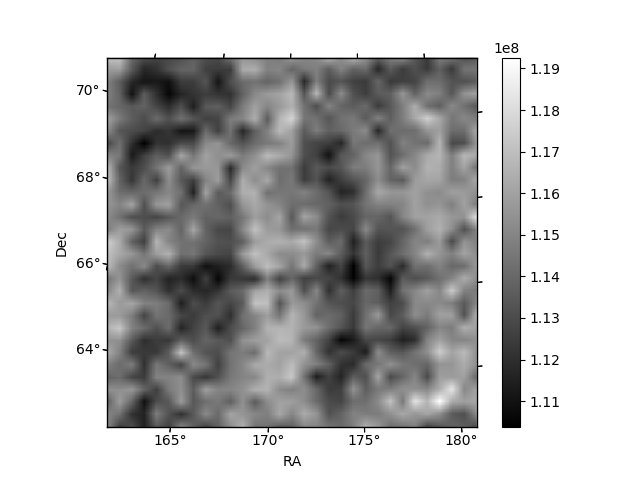
Histogram calculated using DETX and DETY for each event in the final _common_clean file
| Quadrant A | 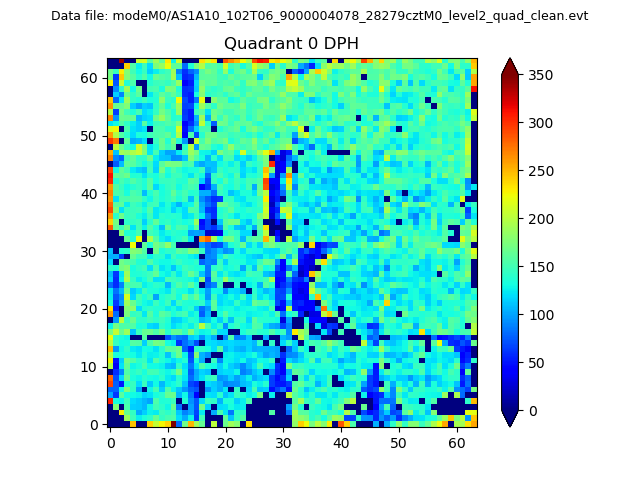 |
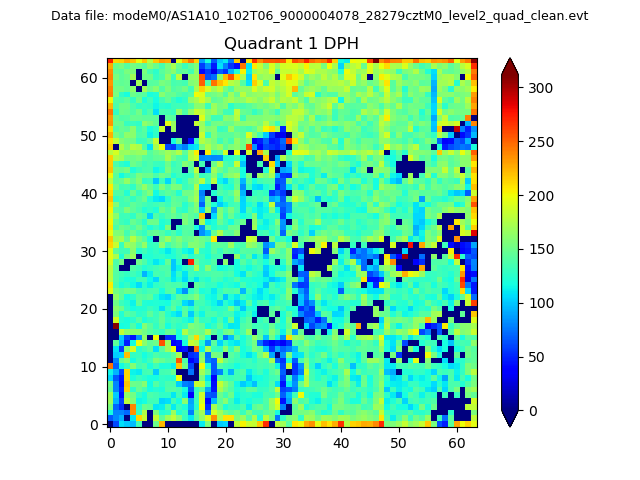 |
Quadrant B |
|---|---|---|---|
| Quadrant D | 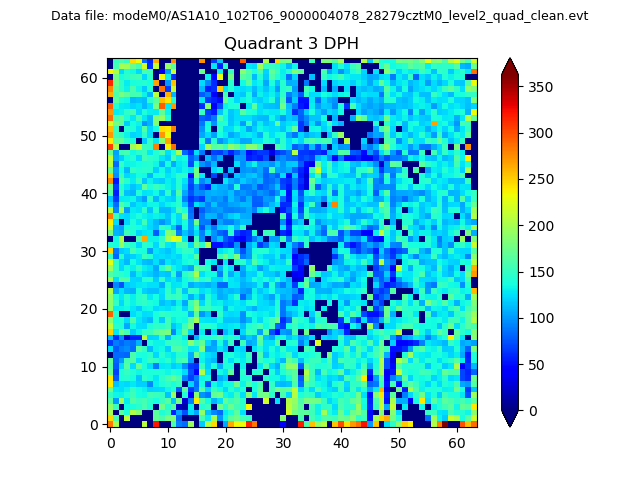 |
 |
Quadrant C |
| Plot type | Count rate plots | Images |
|---|---|---|
| Comparison with Poisson distribution Blue bars denote a histogram of data divided into 1 sec bins. Red curve is a Poisson curve with rate = median count rate of data. |
 |
 |
| Quadrant-wise count rates Data is divided into 100 sec bins |
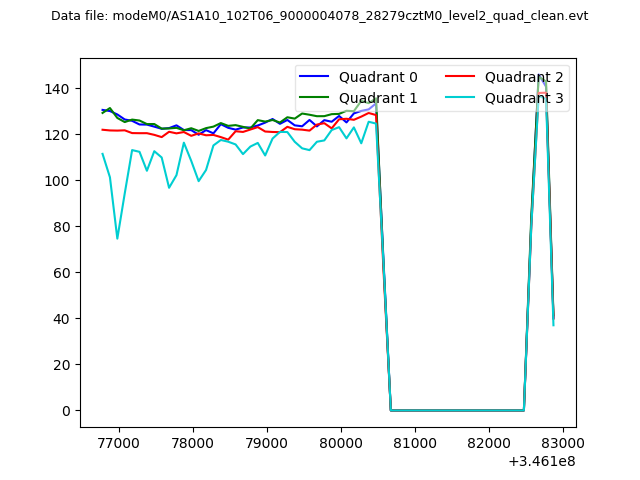 |
|
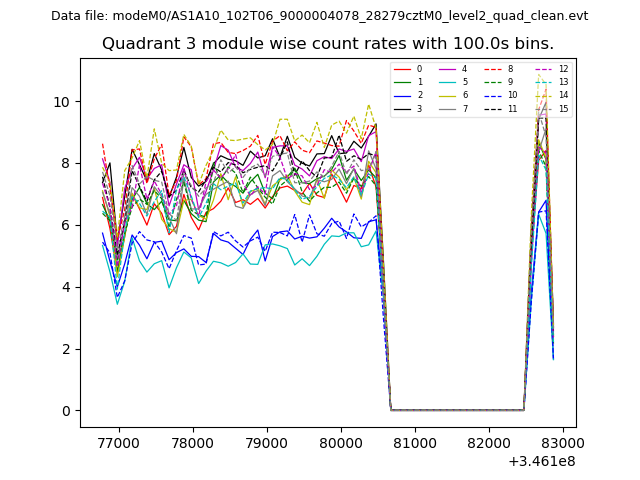
| Module-wise count rates for Quadrant A Data is divided into 100 sec bins |
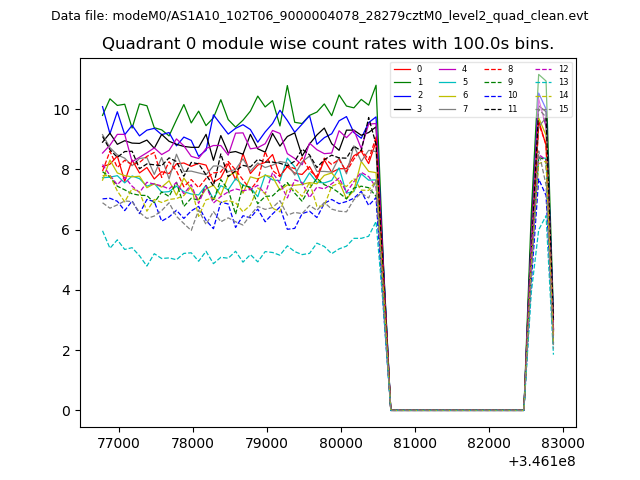 |
 |
| Module-wise count rates for Quadrant B Data is divided into 100 sec bins |
 |
 |
| Module-wise count rates for Quadrant C Data is divided into 100 sec bins |
 |
 |
| Module-wise count rates for Quadrant D Data is divided into 100 sec bins |
 |
 |
| Parameter | Plot |
|---|---|
| CZT HV Monitor |  |
| D_VDD | 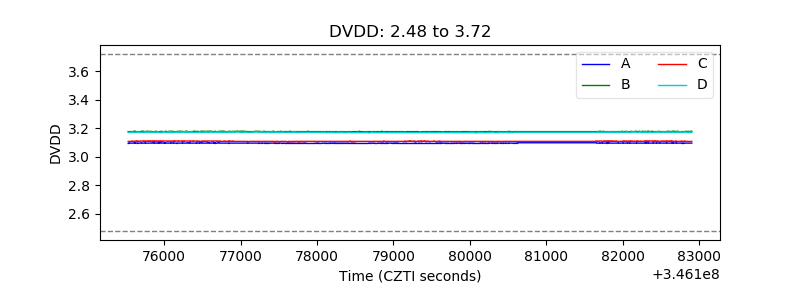 |
| Temperature 1 | 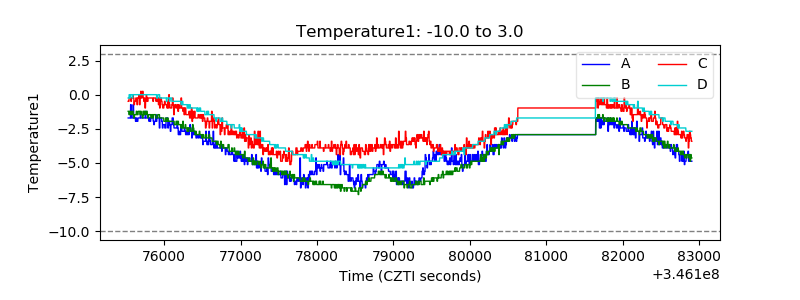 |
| Veto HV Monitor |  |
| Veto LLD | 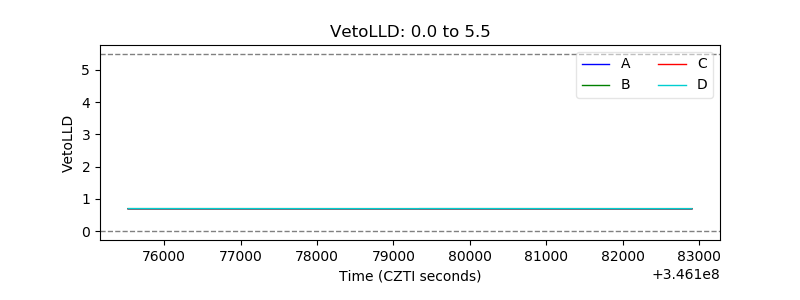 |
| Alpha Counter | 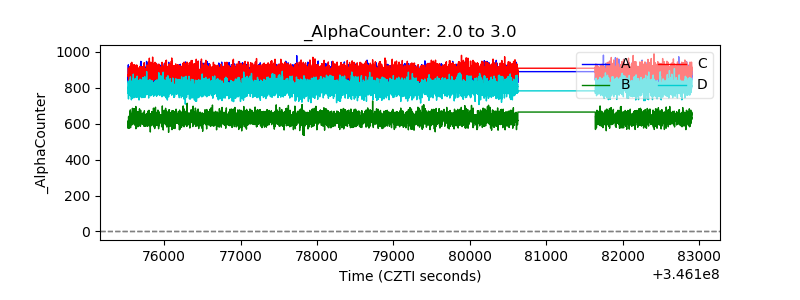 |
| _CPM_Rate | 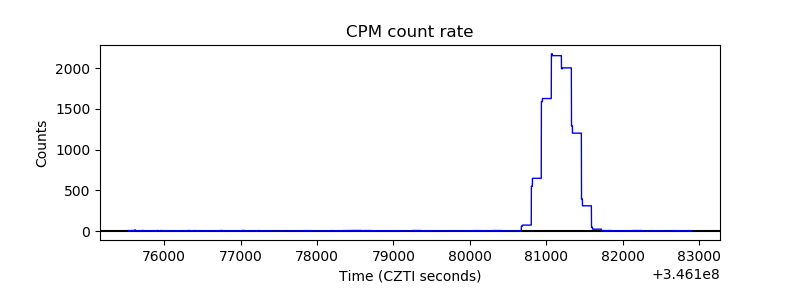 |
| CZT Counter | 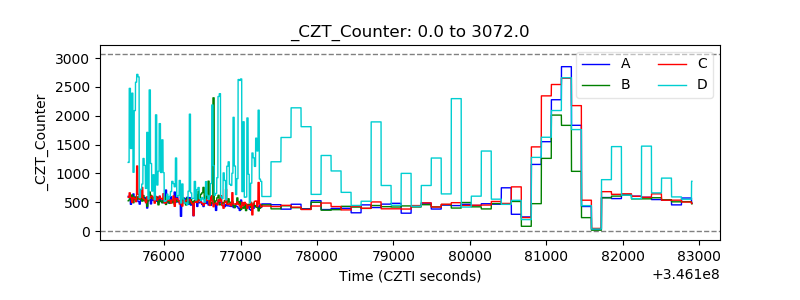 |
| +2.5 Volts monitor | 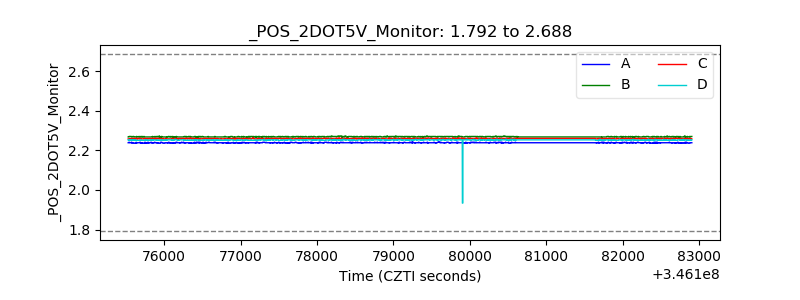 |
| +5 Volts monitor |  |
| _ROLL_ROT |  |
| _Roll_DEC | 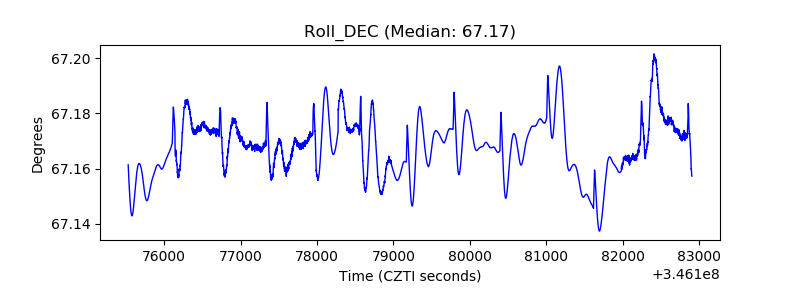 |
| _Roll_RA | 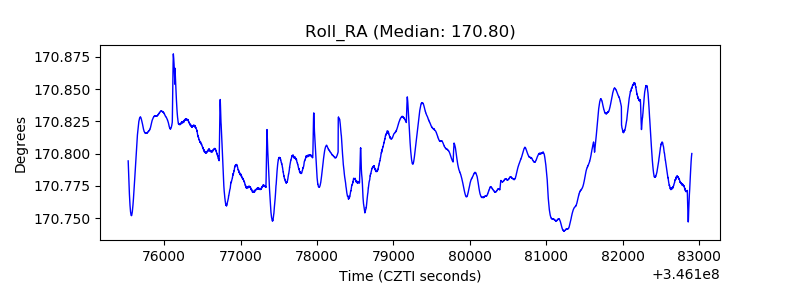 |
| Veto Counter |  |