| Param | Original file | Final file |
|---|---|---|
| Filename | modeM0/AS1A10_102T06_9000004078_28281cztM0_level2.evt | modeM0/AS1A10_102T06_9000004078_28281cztM0_level2_quad_clean.evt |
| Size (bytes) | 509,423,040 | 100,946,880 |
| Size | 485.8 MB | 96.3 MB |
| Events in quadrant A | 3,055,694 | 670,367 |
| Events in quadrant B | 3,172,058 | 684,591 |
| Events in quadrant C | 3,246,973 | 659,374 |
| Events in quadrant D | 5,526,862 | 604,166 |
| Mode M9 | |||
|---|---|---|---|
| Quadrant | BADHDUFLAG | Total packets | Discarded packets |
| A | 0 | 12 | 0 |
| B | 0 | 12 | 0 |
| C | 0 | 12 | 0 |
| D | 0 | 12 | 0 |
| Mode M0 | |||
|---|---|---|---|
| Quadrant | BADHDUFLAG | Total packets | Discarded packets |
| A | 0 | 13339 | 0 |
| B | 0 | 13676 | 0 |
| C | 0 | 13859 | 0 |
| D | 0 | 20809 | 0 |
| Quadrant | Total seconds | Saturated seconds | Saturation percentage |
|---|---|---|---|
| A | 6280 | 35 | 0.557325% |
| B | 6280 | 45 | 0.716561% |
| C | 6280 | 86 | 1.369427% |
| D | 6280 | 759 | 12.085987% |
Noise dominated data is calculated using 1-second bins in cleaned event files. If a bin has >2000 counts, and if more than 50% of those come from <1% of pixels, then it is considered to be noise-dominated and hence unusable.
| Quadrant | # 1 sec bins | Bins with >0 counts | Bins with >2000 counts | High rate bins dominated by noise | Noise dominated (total time) | Noise dominated (detector-on time) | Marked lightcurve |
|---|---|---|---|---|---|---|---|
| A | 7440 | 6280 | 0 | 0 | 0.00% | 0.00% | 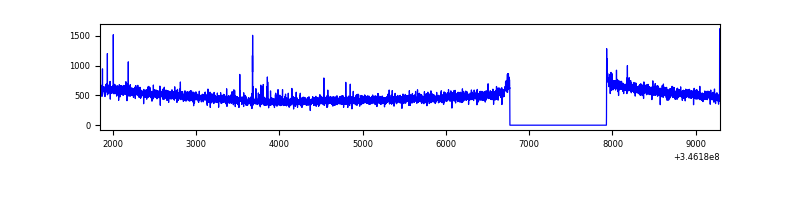 |
| B | 7440 | 6281 | 4 | 4 | 0.05% | 0.06% | 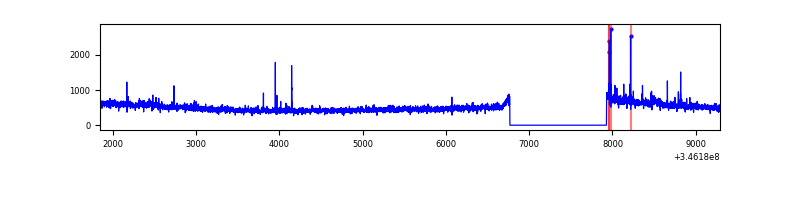 |
| C | 7440 | 6280 | 0 | 0 | 0.00% | 0.00% | 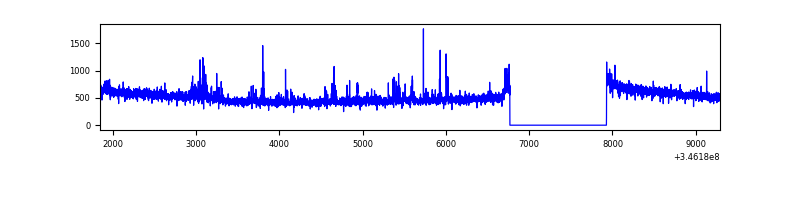 |
| D | 7440 | 6280 | 634 | 634 | 8.52% | 10.10% | 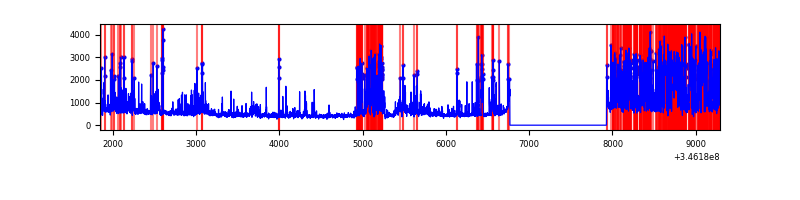 |
Top three noisy pixels from each quadrant. If the there are fewer than three noisy pixels in the level2.evt file, extra rows are filled as -1
| Pixel properties | Quadrant properties | ||||||
|---|---|---|---|---|---|---|---|
| Quadrant | DetID | PixID | Counts | Sigma | Mean | Median | Sigma |
| A | 12 | 96 | 19577 | 118.88 | 786 | 770 | 158.2 |
| A | 13 | 254 | 12049 | 71.29 | 786 | 770 | 158.2 |
| A | 3 | 137 | 7360 | 41.66 | 786 | 770 | 158.2 |
| B | 0 | 230 | 26193 | 172.45 | 787 | 767 | 147.4 |
| B | 4 | 52 | 25460 | 167.48 | 787 | 767 | 147.4 |
| B | 4 | 200 | 24341 | 159.89 | 787 | 767 | 147.4 |
| C | 3 | 233 | 129111 | 721.25 | 768 | 773 | 177.9 |
| C | 14 | 238 | 125049 | 698.42 | 768 | 773 | 177.9 |
| C | 13 | 61 | 5278 | 25.32 | 768 | 773 | 177.9 |
| D | 1 | 52 | 1967714 | 11330.66 | 731 | 712 | 173.6 |
| D | 12 | 250 | 337974 | 1942.75 | 731 | 712 | 173.6 |
| D | 13 | 104 | 243826 | 1400.43 | 731 | 712 | 173.6 |
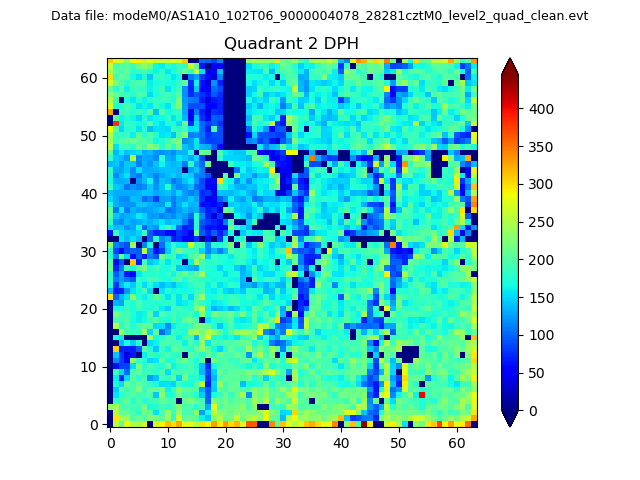
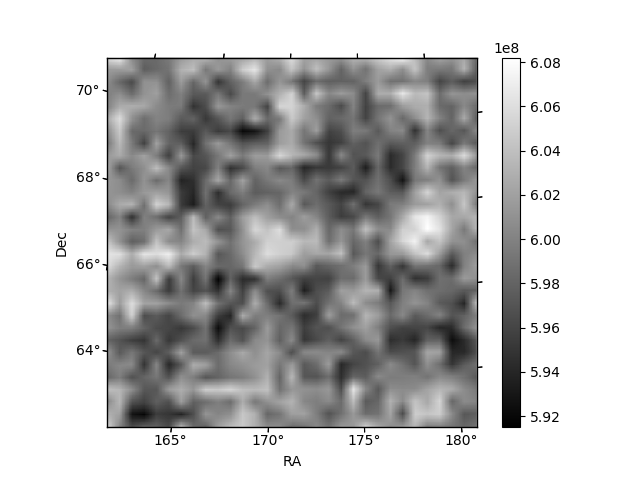
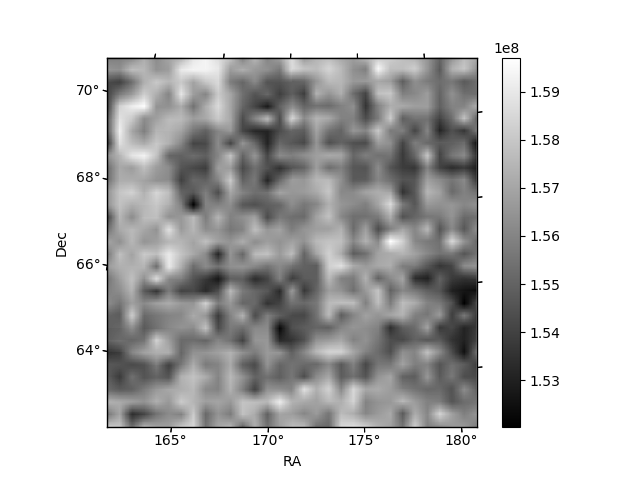
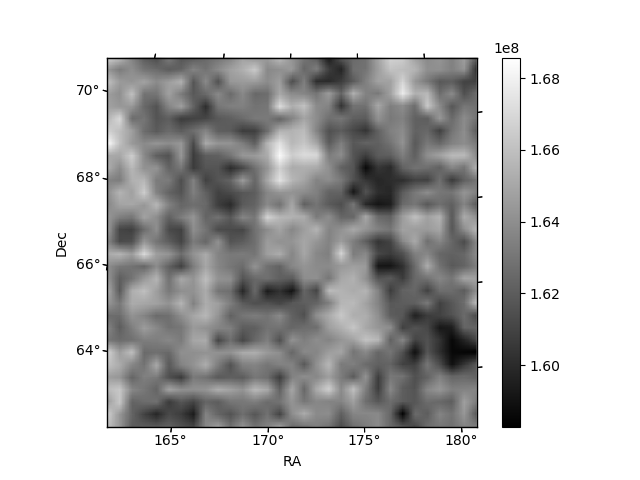
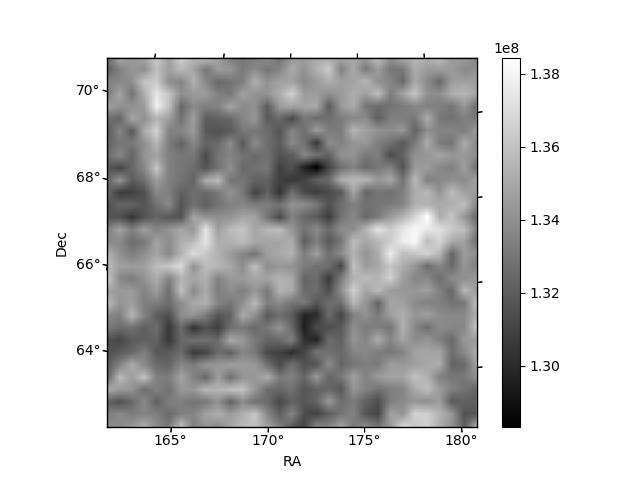
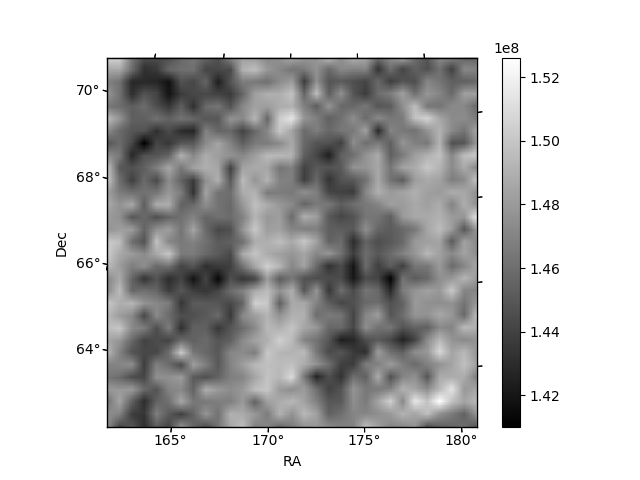
Histogram calculated using DETX and DETY for each event in the final _common_clean file
| Quadrant A | 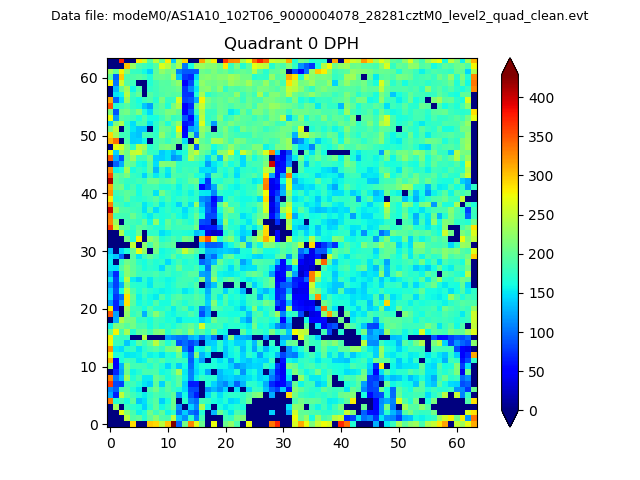 |
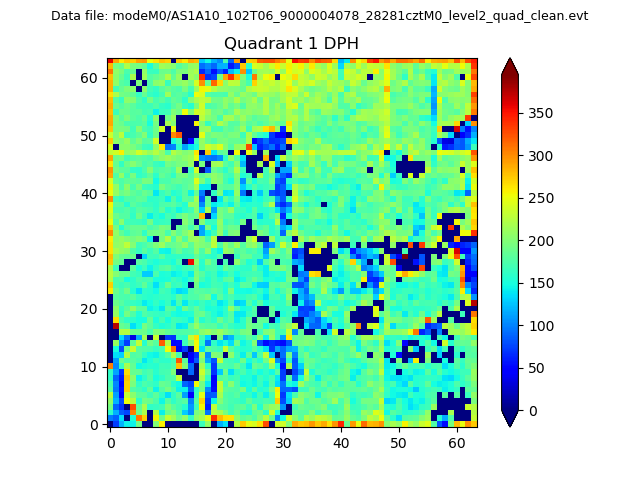 |
Quadrant B |
|---|---|---|---|
| Quadrant D | 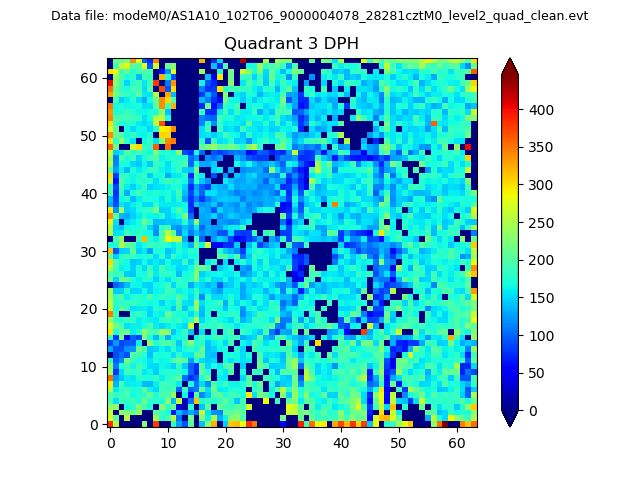 |
 |
Quadrant C |
| Plot type | Count rate plots | Images |
|---|---|---|
| Comparison with Poisson distribution Blue bars denote a histogram of data divided into 1 sec bins. Red curve is a Poisson curve with rate = median count rate of data. |
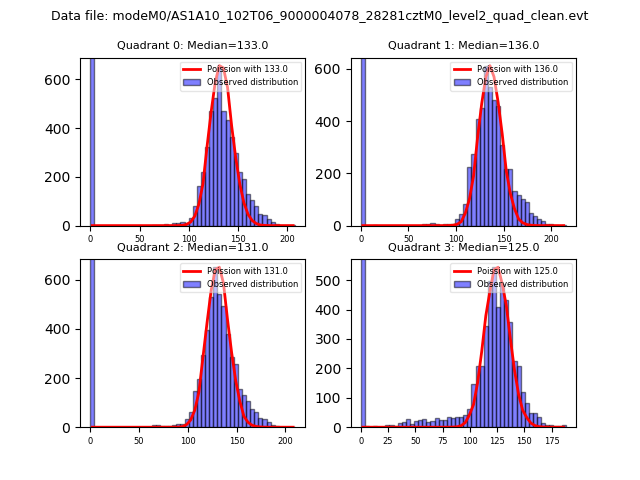 |
 |
| Quadrant-wise count rates Data is divided into 100 sec bins |
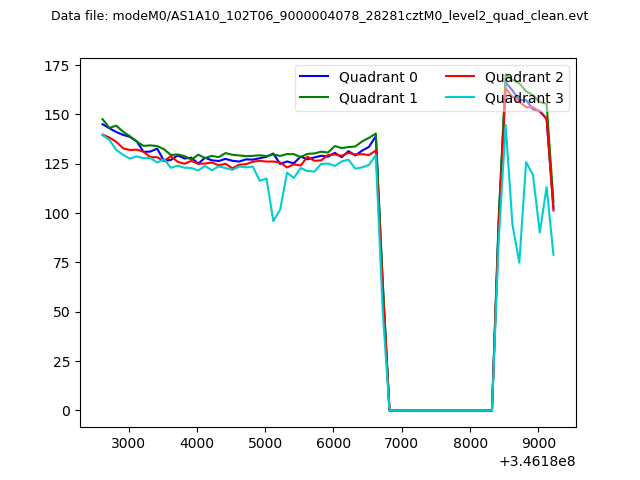 |
|
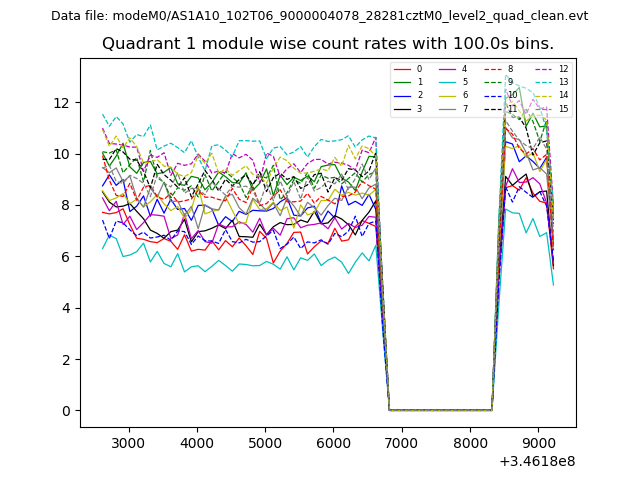
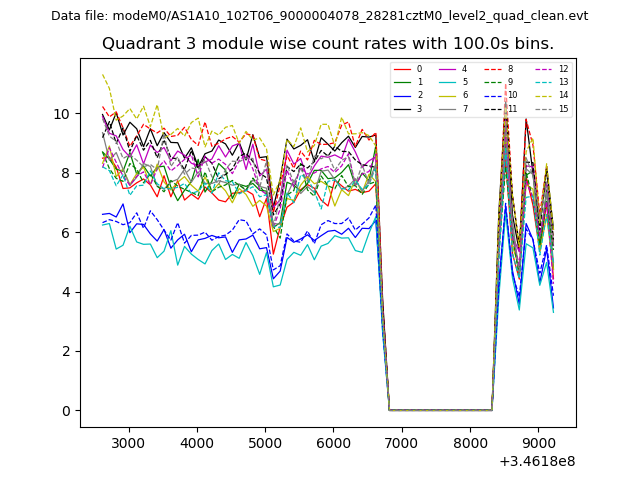
| Module-wise count rates for Quadrant A Data is divided into 100 sec bins |
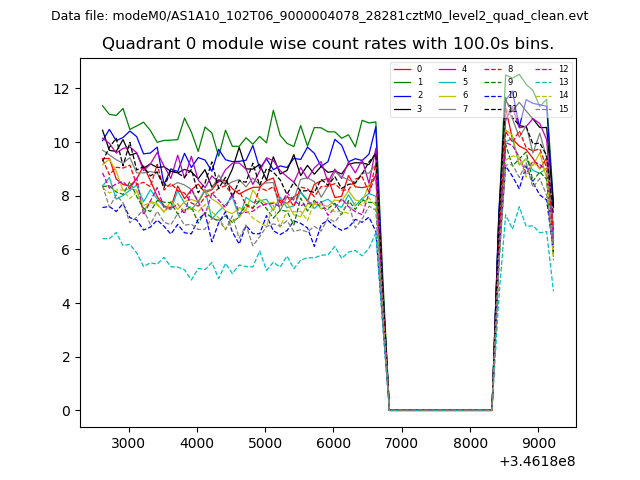 |
 |
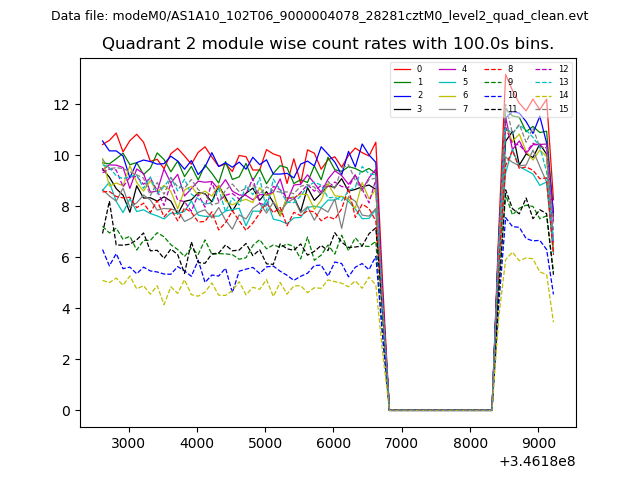
| Module-wise count rates for Quadrant B Data is divided into 100 sec bins |
 |
 |
| Module-wise count rates for Quadrant C Data is divided into 100 sec bins |
 |
 |
| Module-wise count rates for Quadrant D Data is divided into 100 sec bins |
 |
 |
| Parameter | Plot |
|---|---|
| CZT HV Monitor | 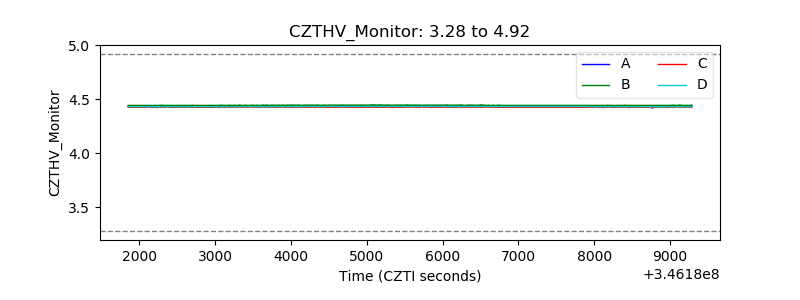 |
| D_VDD | 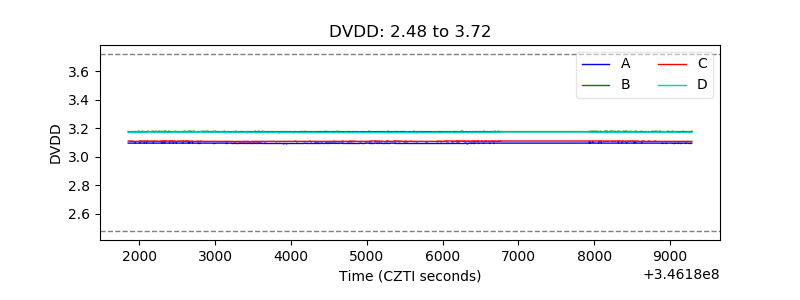 |
| Temperature 1 | 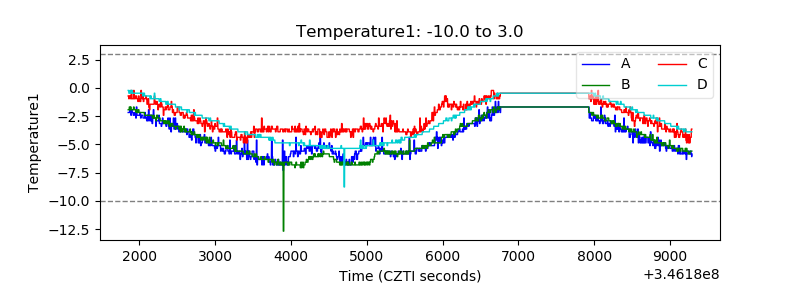 |
| Veto HV Monitor | 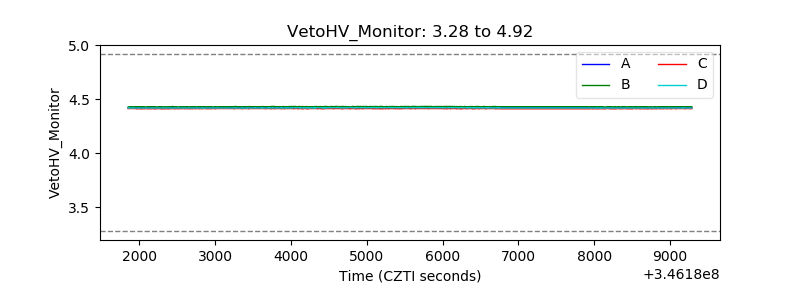 |
| Veto LLD | 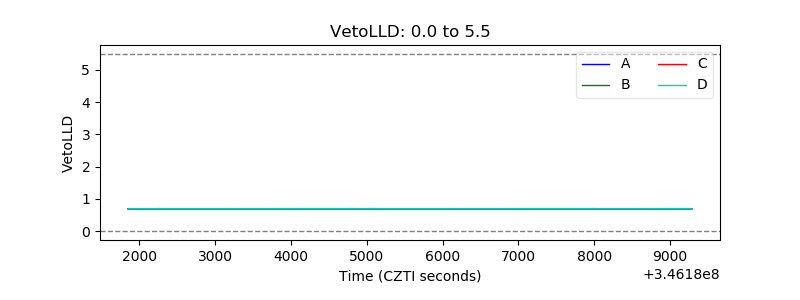 |
| Alpha Counter | 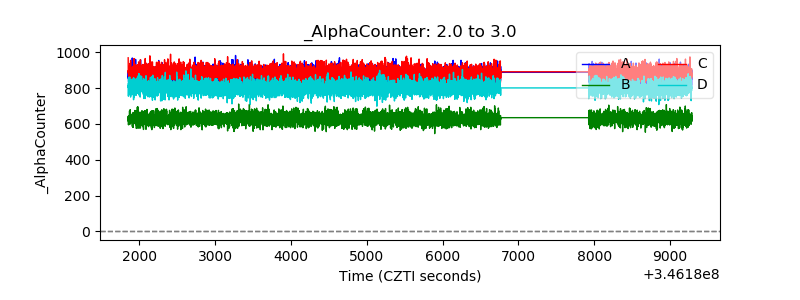 |
| _CPM_Rate | 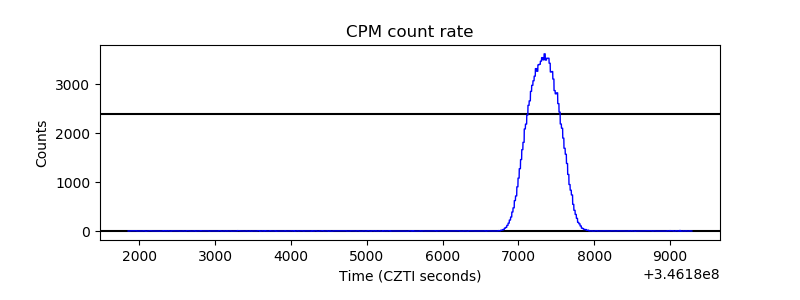 |
| CZT Counter | 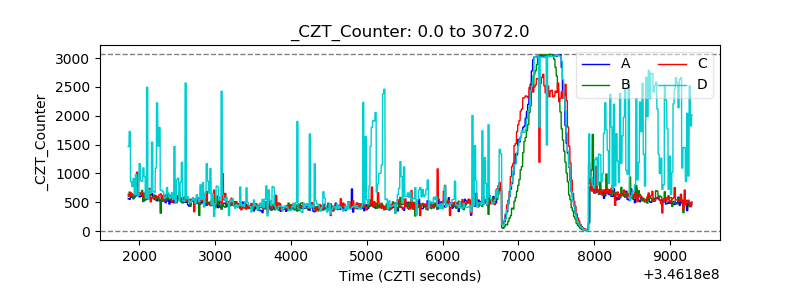 |
| +2.5 Volts monitor |  |
| +5 Volts monitor |  |
| _ROLL_ROT | 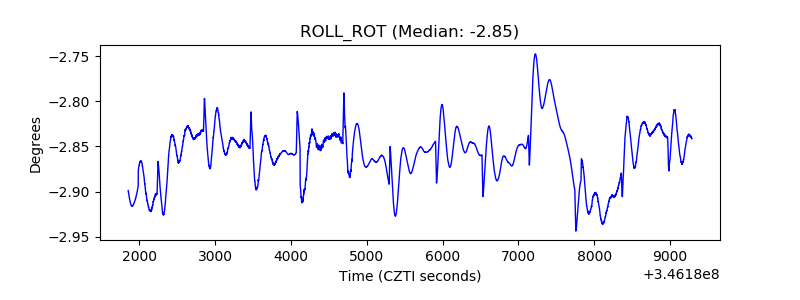 |
| _Roll_DEC | 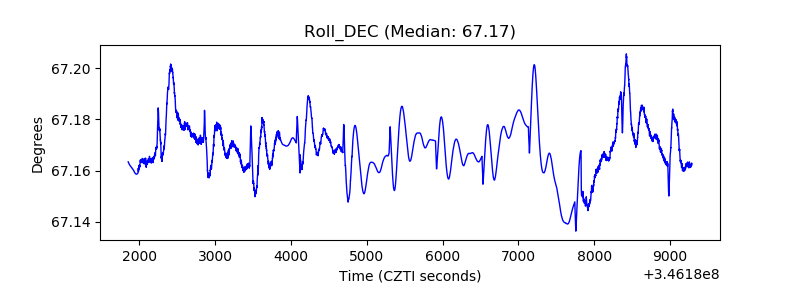 |
| _Roll_RA | 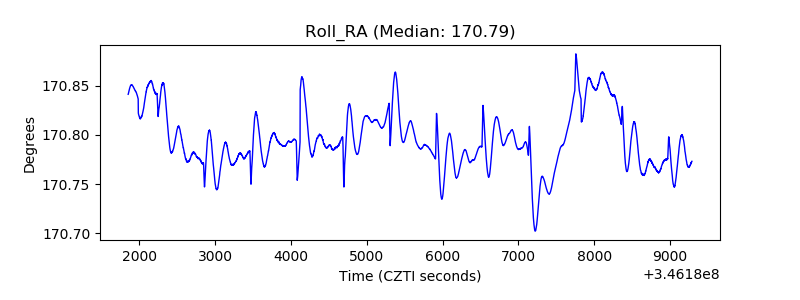 |
| Veto Counter | 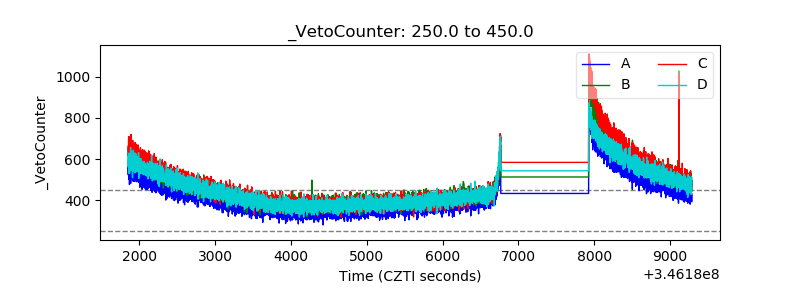 |