| Param | Original file | Final file |
|---|---|---|
| Filename | modeM0/AS1A10_102T06_9000004078_28282cztM0_level2.evt | modeM0/AS1A10_102T06_9000004078_28282cztM0_level2_quad_clean.evt |
| Size (bytes) | 575,081,280 | 117,915,840 |
| Size | 548.4 MB | 112.5 MB |
| Events in quadrant A | 3,172,370 | 802,859 |
| Events in quadrant B | 3,608,043 | 826,374 |
| Events in quadrant C | 3,265,934 | 799,964 |
| Events in quadrant D | 6,948,182 | 707,259 |
| Mode M9 | |||
|---|---|---|---|
| Quadrant | BADHDUFLAG | Total packets | Discarded packets |
| A | 0 | 13 | 0 |
| B | 0 | 13 | 0 |
| C | 0 | 13 | 0 |
| D | 0 | 13 | 0 |
| Mode M0 | |||
|---|---|---|---|
| Quadrant | BADHDUFLAG | Total packets | Discarded packets |
| A | 0 | 13580 | 0 |
| B | 0 | 14988 | 0 |
| C | 0 | 13835 | 0 |
| D | 0 | 25054 | 0 |
| Quadrant | Total seconds | Saturated seconds | Saturation percentage |
|---|---|---|---|
| A | 6227 | 42 | 0.674482% |
| B | 6228 | 139 | 2.231856% |
| C | 6228 | 99 | 1.589595% |
| D | 6228 | 1178 | 18.914579% |
Noise dominated data is calculated using 1-second bins in cleaned event files. If a bin has >2000 counts, and if more than 50% of those come from <1% of pixels, then it is considered to be noise-dominated and hence unusable.
| Quadrant | # 1 sec bins | Bins with >0 counts | Bins with >2000 counts | High rate bins dominated by noise | Noise dominated (total time) | Noise dominated (detector-on time) | Marked lightcurve |
|---|---|---|---|---|---|---|---|
| A | 7482 | 6228 | 1 | 1 | 0.01% | 0.02% | 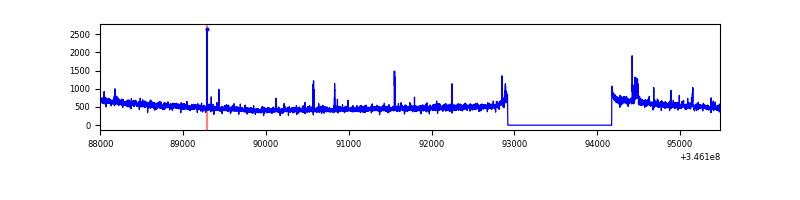 |
| B | 7483 | 6229 | 65 | 65 | 0.87% | 1.04% | 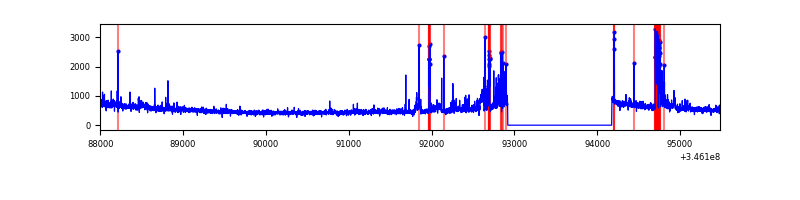 |
| C | 7483 | 6228 | 0 | 0 | 0.00% | 0.00% | 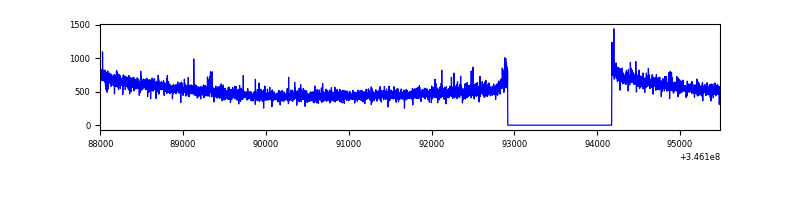 |
| D | 7483 | 6228 | 1002 | 1002 | 13.39% | 16.09% | 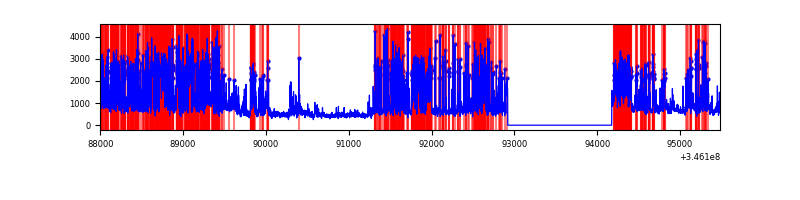 |
Top three noisy pixels from each quadrant. If the there are fewer than three noisy pixels in the level2.evt file, extra rows are filled as -1
| Pixel properties | Quadrant properties | ||||||
|---|---|---|---|---|---|---|---|
| Quadrant | DetID | PixID | Counts | Sigma | Mean | Median | Sigma |
| A | 12 | 96 | 50758 | 311.03 | 804 | 790 | 160.7 |
| A | 15 | 174 | 20164 | 120.59 | 804 | 790 | 160.7 |
| A | 13 | 254 | 11445 | 66.32 | 804 | 790 | 160.7 |
| B | 10 | 245 | 386966 | 2612.35 | 804 | 787 | 147.8 |
| B | 0 | 230 | 25035 | 164.03 | 804 | 787 | 147.8 |
| B | 4 | 52 | 21443 | 139.73 | 804 | 787 | 147.8 |
| C | 14 | 238 | 129052 | 703.96 | 790 | 796 | 182.2 |
| C | 3 | 233 | 57946 | 313.68 | 790 | 796 | 182.2 |
| C | 13 | 61 | 5531 | 25.99 | 790 | 796 | 182.2 |
| D | 1 | 52 | 2895723 | 16747.52 | 731 | 711 | 172.9 |
| D | 8 | 195 | 643794 | 3720.21 | 731 | 711 | 172.9 |
| D | 12 | 250 | 258731 | 1492.63 | 731 | 711 | 172.9 |
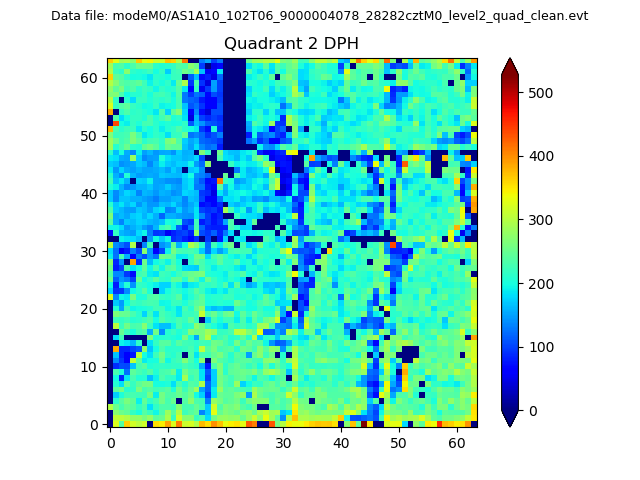
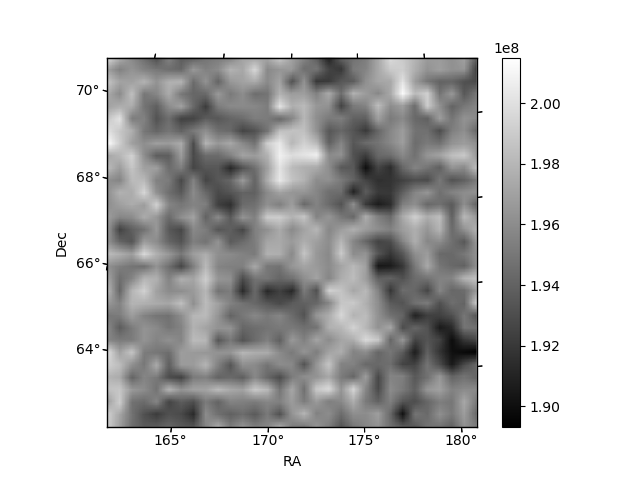
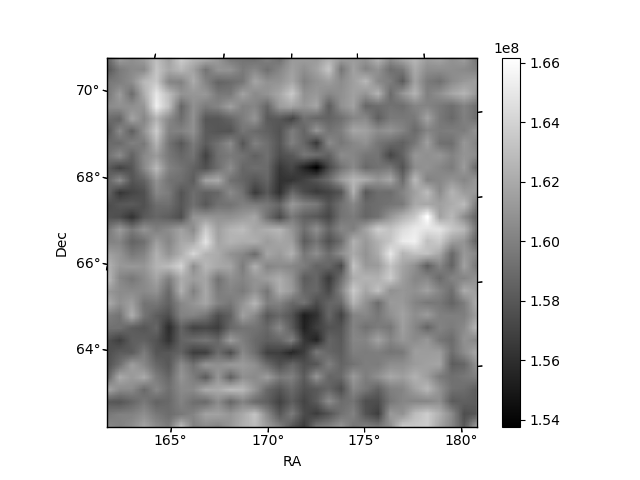
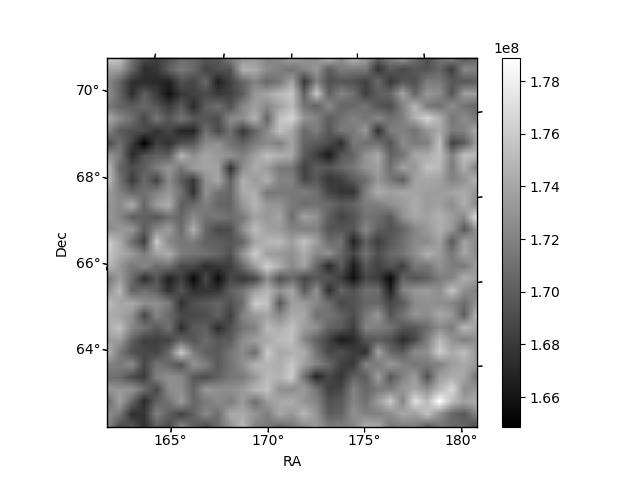
Histogram calculated using DETX and DETY for each event in the final _common_clean file
| Quadrant A | 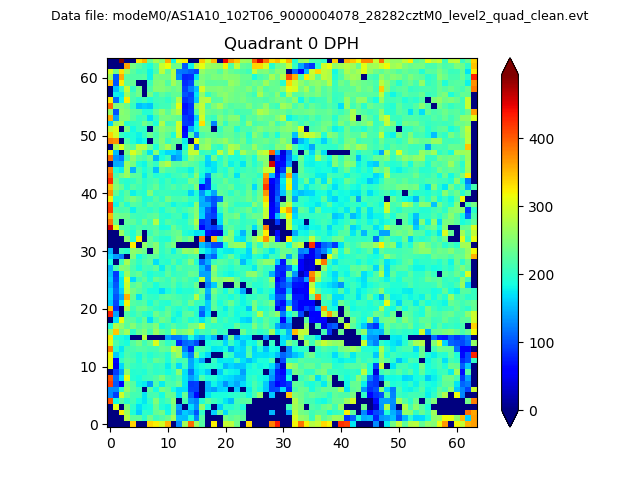 |
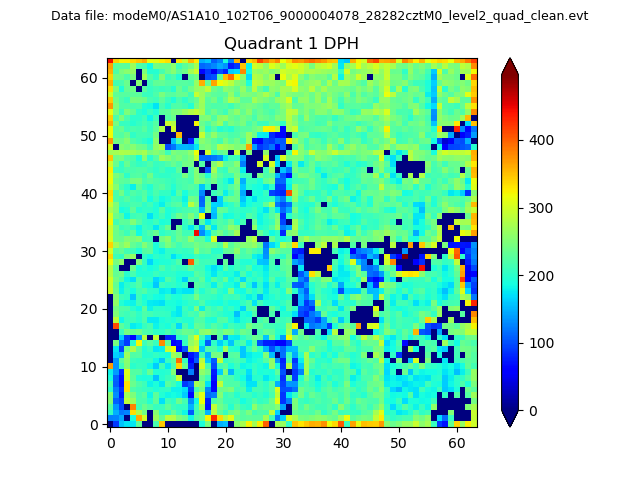 |
Quadrant B |
|---|---|---|---|
| Quadrant D | 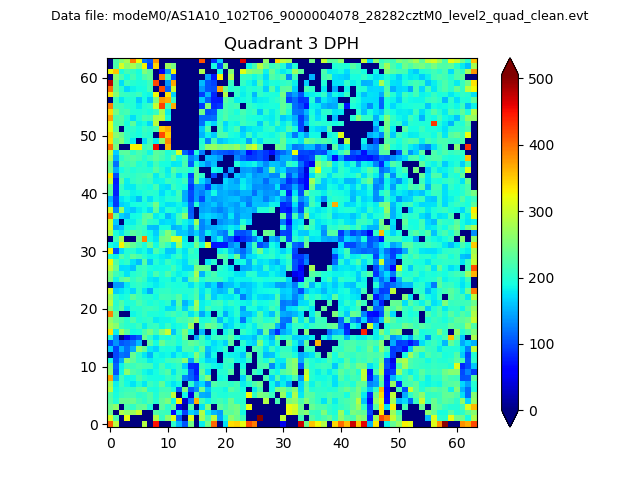 |
 |
Quadrant C |
| Plot type | Count rate plots | Images |
|---|---|---|
| Comparison with Poisson distribution Blue bars denote a histogram of data divided into 1 sec bins. Red curve is a Poisson curve with rate = median count rate of data. |
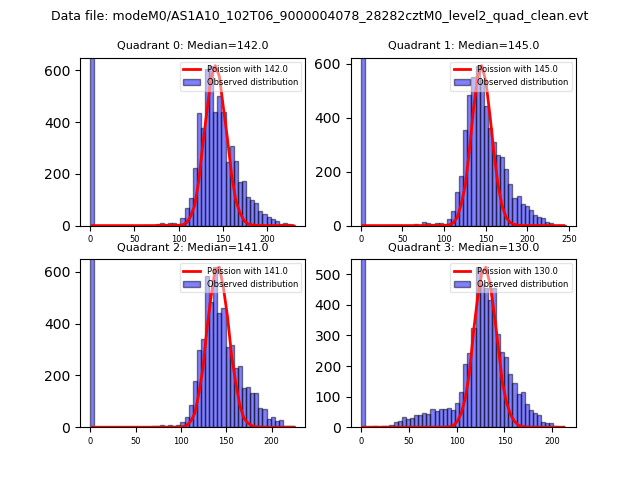 |
 |
| Quadrant-wise count rates Data is divided into 100 sec bins |
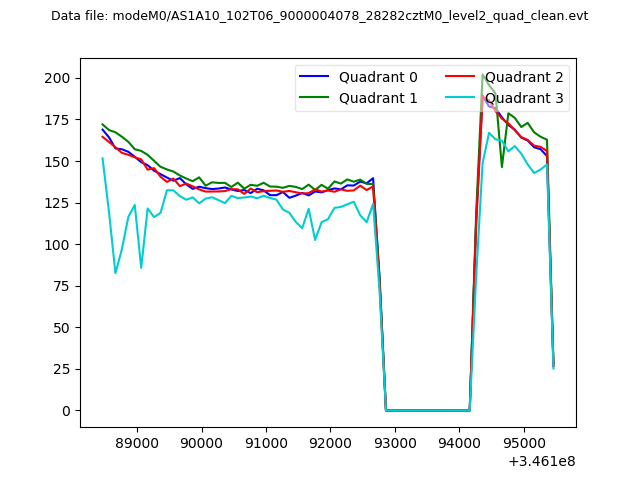 |
|
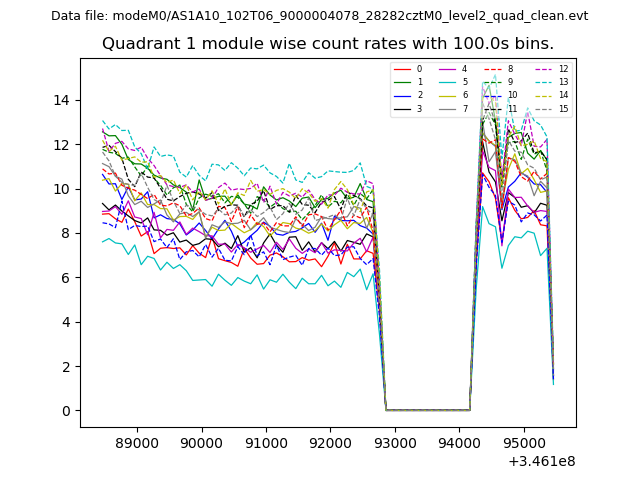
| Module-wise count rates for Quadrant A Data is divided into 100 sec bins |
 |
 |
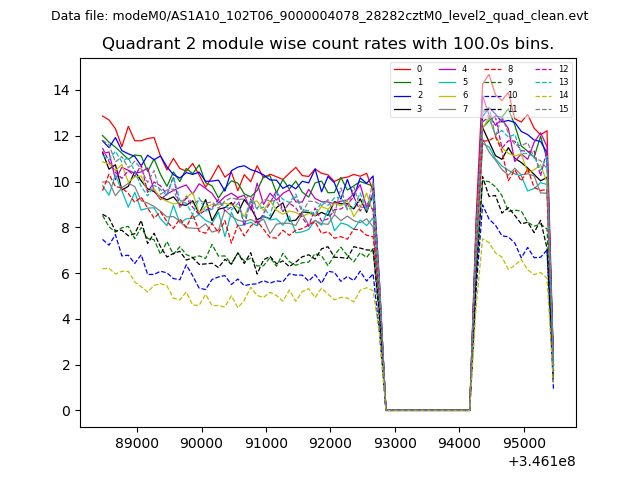
| Module-wise count rates for Quadrant B Data is divided into 100 sec bins |
 |
 |
| Module-wise count rates for Quadrant C Data is divided into 100 sec bins |
 |
 |
| Module-wise count rates for Quadrant D Data is divided into 100 sec bins |
 |
 |
| Parameter | Plot |
|---|---|
| CZT HV Monitor | 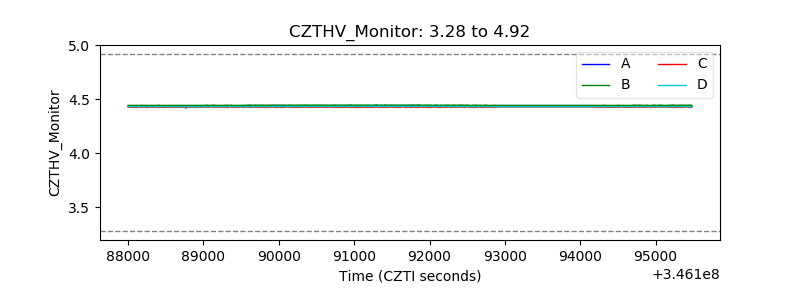 |
| D_VDD | 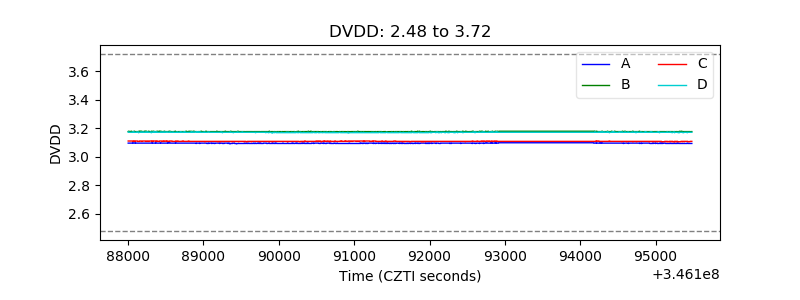 |
| Temperature 1 | 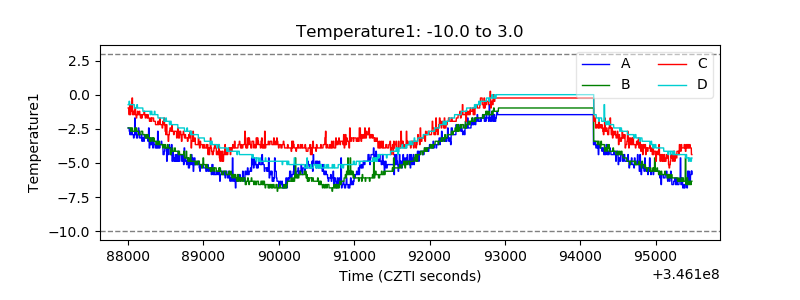 |
| Veto HV Monitor | 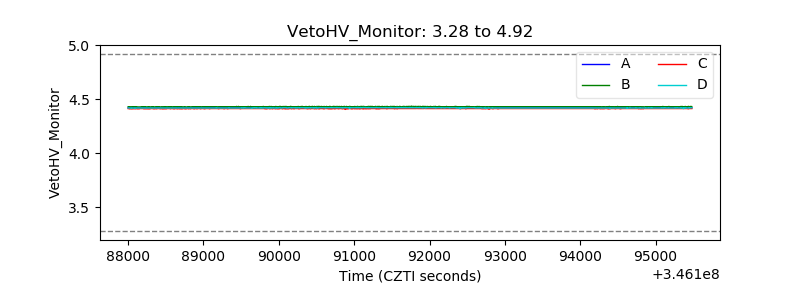 |
| Veto LLD | 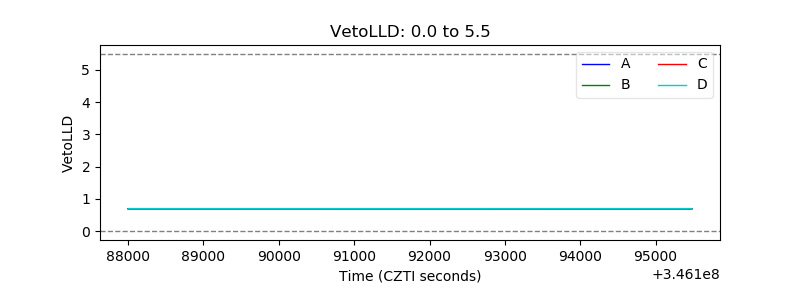 |
| Alpha Counter | 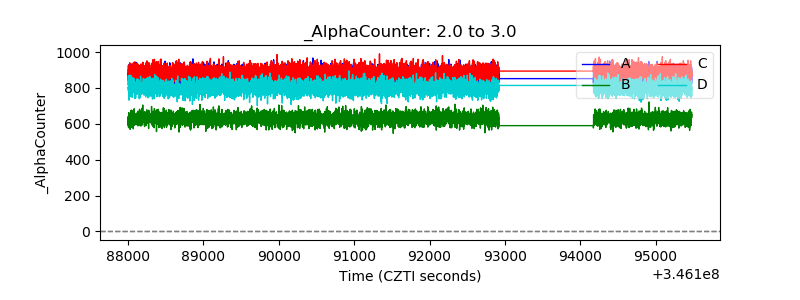 |
| _CPM_Rate | 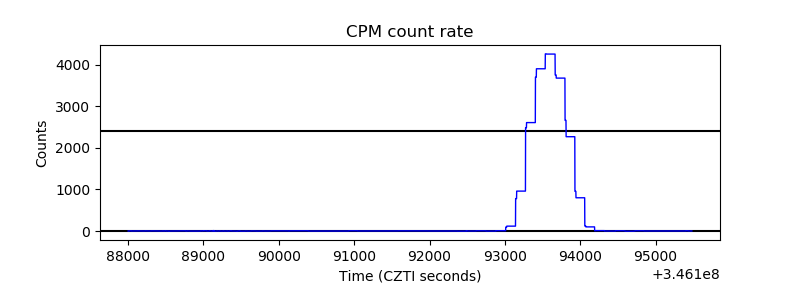 |
| CZT Counter | 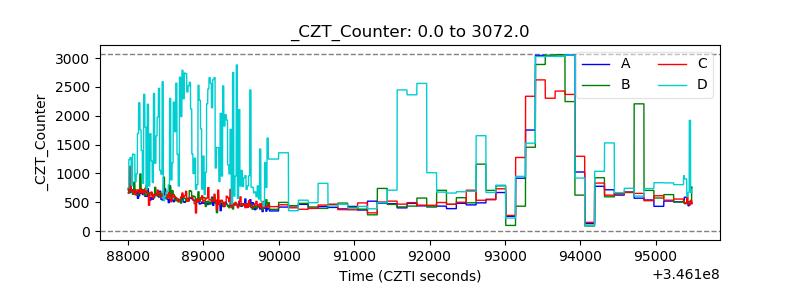 |
| +2.5 Volts monitor |  |
| +5 Volts monitor |  |
| _ROLL_ROT |  |
| _Roll_DEC | 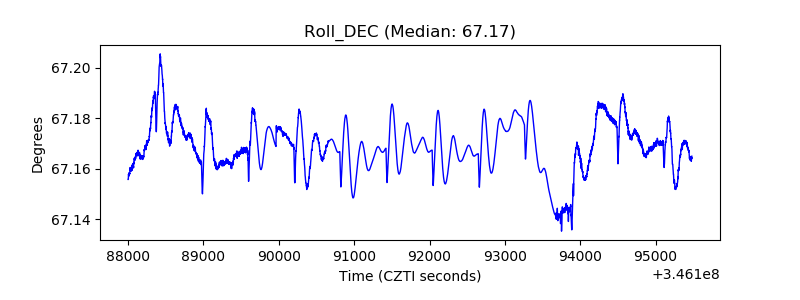 |
| _Roll_RA | 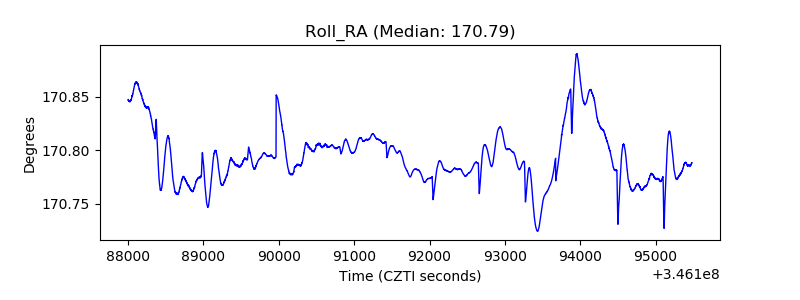 |
| Veto Counter |  |