| Param | Original file | Final file |
|---|---|---|
| Filename | modeM0/AS1A10_102T06_9000004078_28283cztM0_level2.evt | modeM0/AS1A10_102T06_9000004078_28283cztM0_level2_quad_clean.evt |
| Size (bytes) | 557,775,360 | 126,696,960 |
| Size | 531.9 MB | 120.8 MB |
| Events in quadrant A | 3,195,802 | 865,118 |
| Events in quadrant B | 3,868,256 | 889,096 |
| Events in quadrant C | 3,310,515 | 867,150 |
| Events in quadrant D | 6,094,670 | 780,020 |
| Mode M9 | |||
|---|---|---|---|
| Quadrant | BADHDUFLAG | Total packets | Discarded packets |
| A | 0 | 16 | 0 |
| B | 0 | 17 | 0 |
| C | 0 | 17 | 0 |
| D | 0 | 17 | 0 |
| Mode M0 | |||
|---|---|---|---|
| Quadrant | BADHDUFLAG | Total packets | Discarded packets |
| A | 0 | 13565 | 0 |
| B | 0 | 15660 | 0 |
| C | 0 | 13934 | 0 |
| D | 0 | 22478 | 0 |
| Quadrant | Total seconds | Saturated seconds | Saturation percentage |
|---|---|---|---|
| A | 6248 | 63 | 1.008323% |
| B | 6248 | 228 | 3.649168% |
| C | 6248 | 122 | 1.952625% |
| D | 6248 | 754 | 12.067862% |
Noise dominated data is calculated using 1-second bins in cleaned event files. If a bin has >2000 counts, and if more than 50% of those come from <1% of pixels, then it is considered to be noise-dominated and hence unusable.
| Quadrant | # 1 sec bins | Bins with >0 counts | Bins with >2000 counts | High rate bins dominated by noise | Noise dominated (total time) | Noise dominated (detector-on time) | Marked lightcurve |
|---|---|---|---|---|---|---|---|
| A | 7568 | 6248 | 1 | 1 | 0.01% | 0.02% | 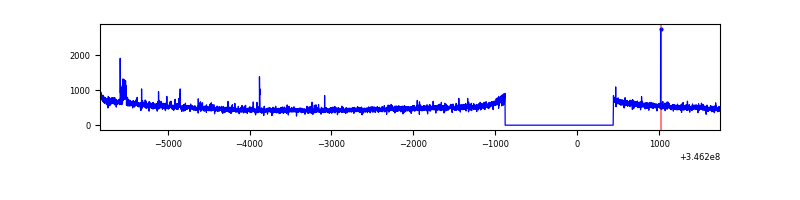 |
| B | 7568 | 6249 | 106 | 106 | 1.40% | 1.70% | 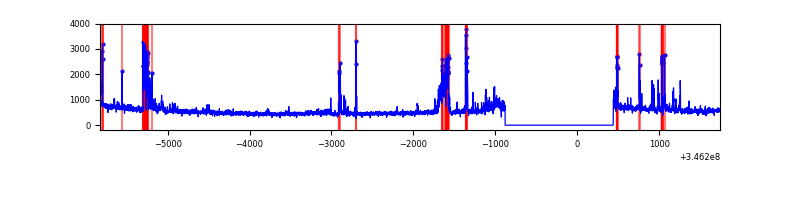 |
| C | 7568 | 6248 | 0 | 0 | 0.00% | 0.00% | 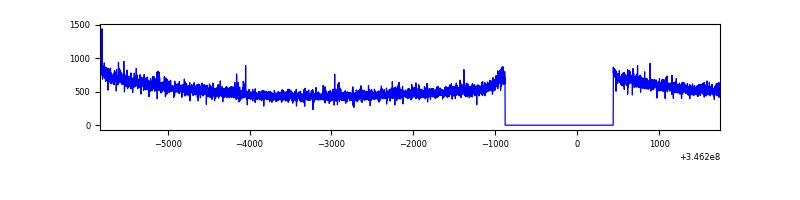 |
| D | 7568 | 6249 | 571 | 571 | 7.54% | 9.14% | 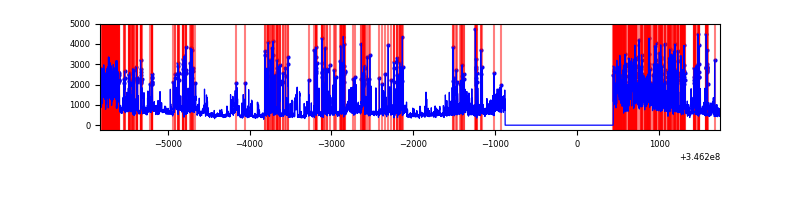 |
Top three noisy pixels from each quadrant. If the there are fewer than three noisy pixels in the level2.evt file, extra rows are filled as -1
| Pixel properties | Quadrant properties | ||||||
|---|---|---|---|---|---|---|---|
| Quadrant | DetID | PixID | Counts | Sigma | Mean | Median | Sigma |
| A | 12 | 96 | 35775 | 216.17 | 817 | 803 | 161.8 |
| A | 13 | 254 | 11162 | 64.03 | 817 | 803 | 161.8 |
| A | 3 | 137 | 7176 | 39.39 | 817 | 803 | 161.8 |
| B | 10 | 245 | 596832 | 4030.26 | 818 | 800 | 147.9 |
| B | 4 | 200 | 29642 | 195.02 | 818 | 800 | 147.9 |
| B | 12 | 111 | 17425 | 112.42 | 818 | 800 | 147.9 |
| C | 14 | 238 | 133452 | 723.34 | 803 | 811 | 183.4 |
| C | 3 | 233 | 48505 | 260.09 | 803 | 811 | 183.4 |
| C | 13 | 61 | 5525 | 25.71 | 803 | 811 | 183.4 |
| D | 1 | 52 | 2091021 | 11788.36 | 761 | 745 | 177.3 |
| D | 8 | 195 | 867325 | 4887.18 | 761 | 745 | 177.3 |
| D | 12 | 250 | 106477 | 596.29 | 761 | 745 | 177.3 |
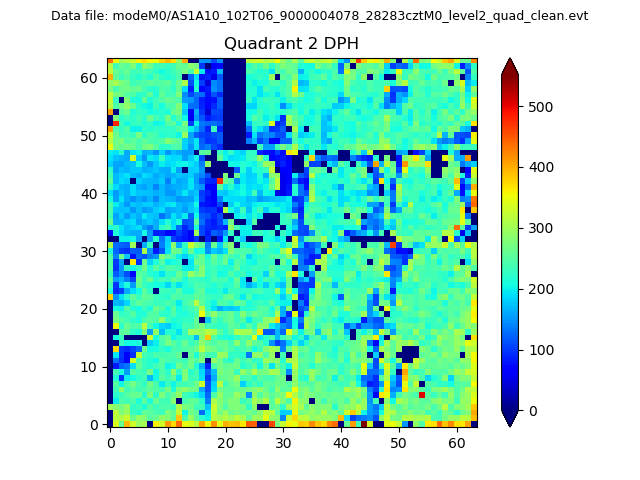
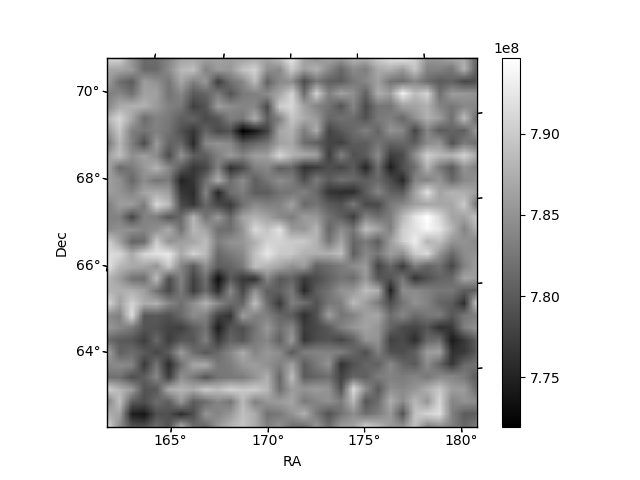
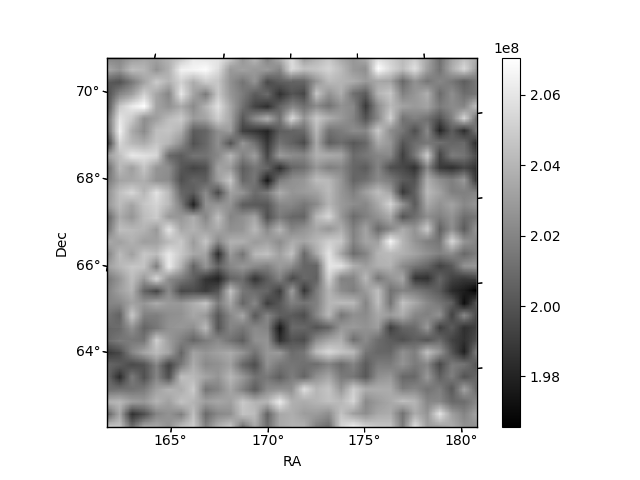
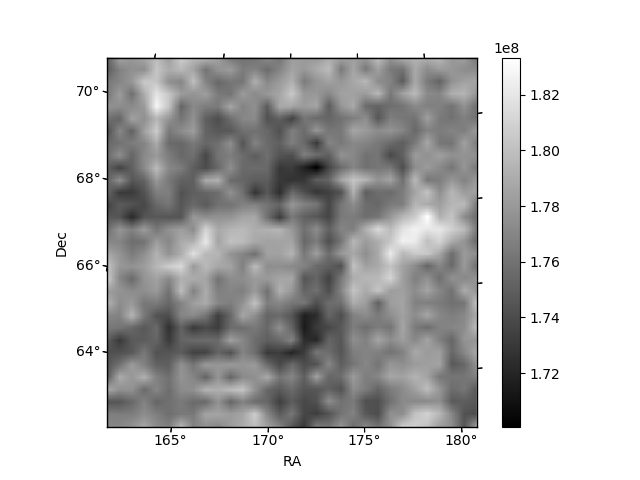
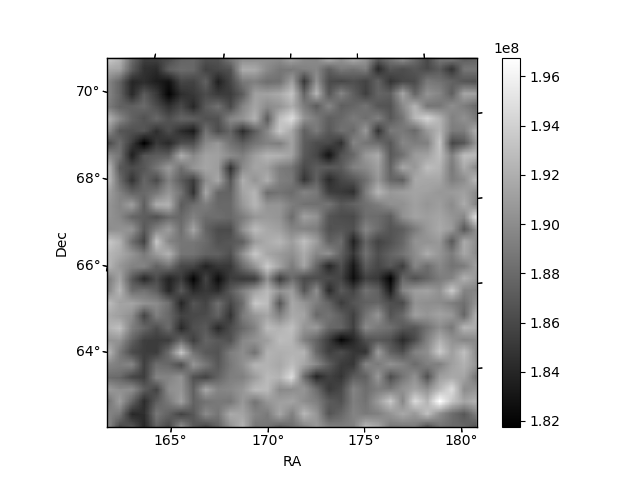
Histogram calculated using DETX and DETY for each event in the final _common_clean file
| Quadrant A | 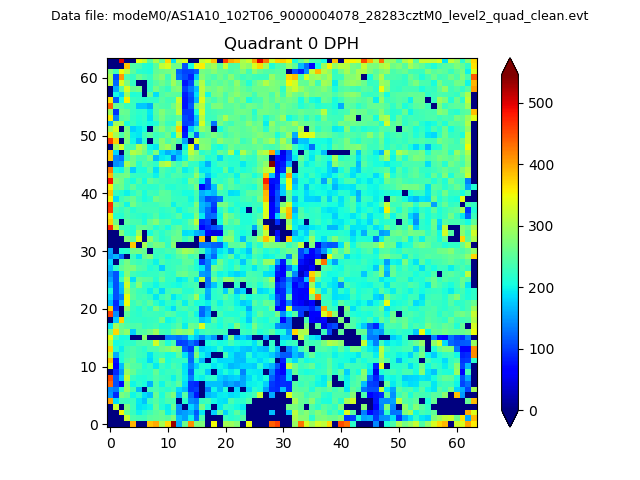 |
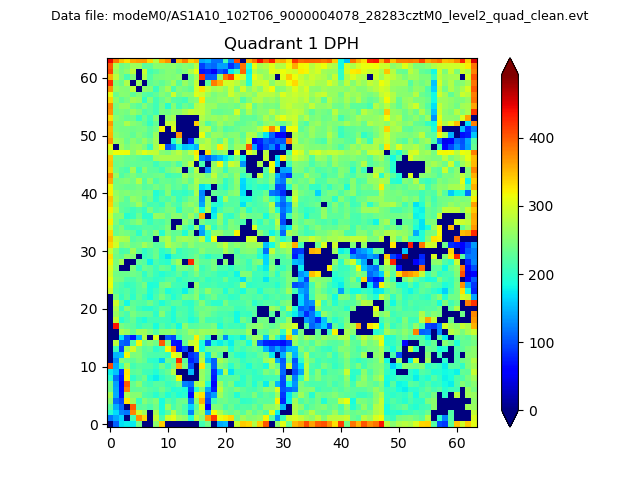 |
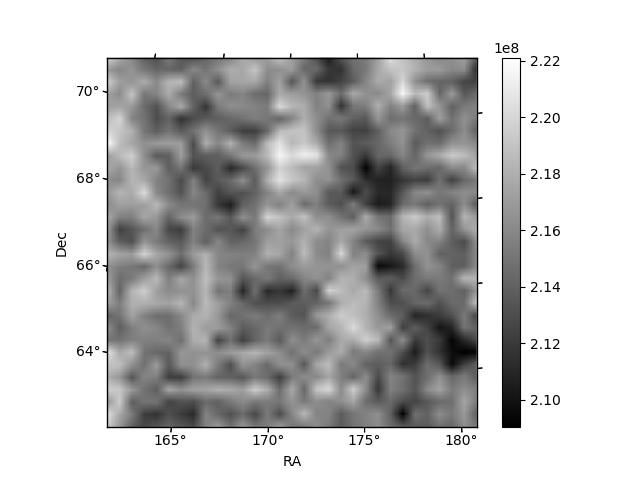
Quadrant B |
|---|---|---|---|
| Quadrant D | 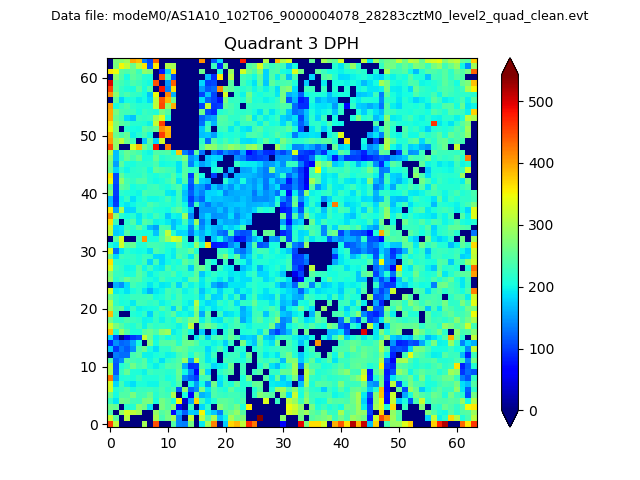 |
 |
Quadrant C |
| Plot type | Count rate plots | Images |
|---|---|---|
| Comparison with Poisson distribution Blue bars denote a histogram of data divided into 1 sec bins. Red curve is a Poisson curve with rate = median count rate of data. |
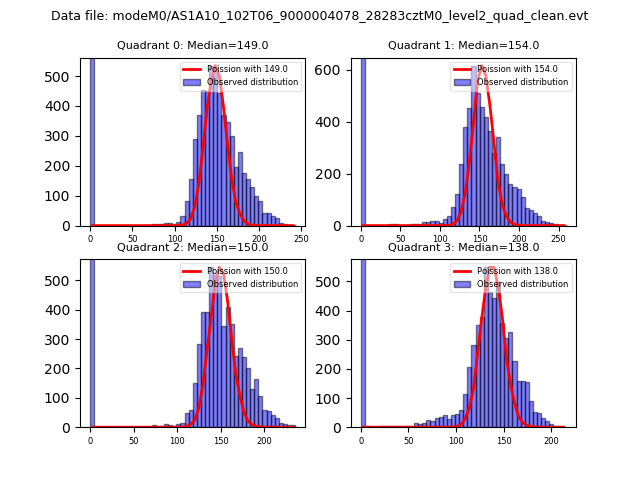 |
 |
| Quadrant-wise count rates Data is divided into 100 sec bins |
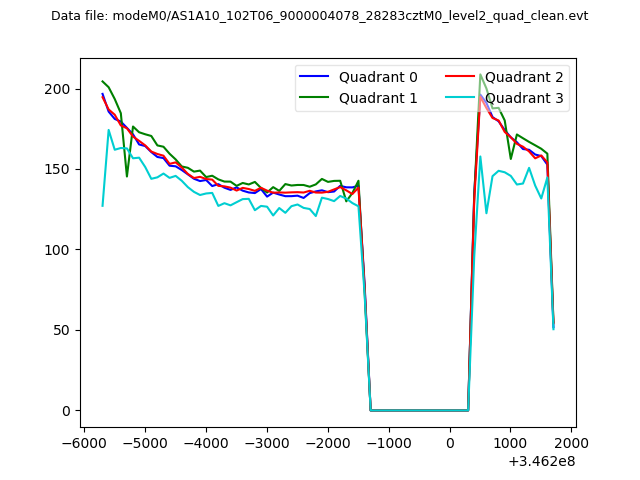 |
|
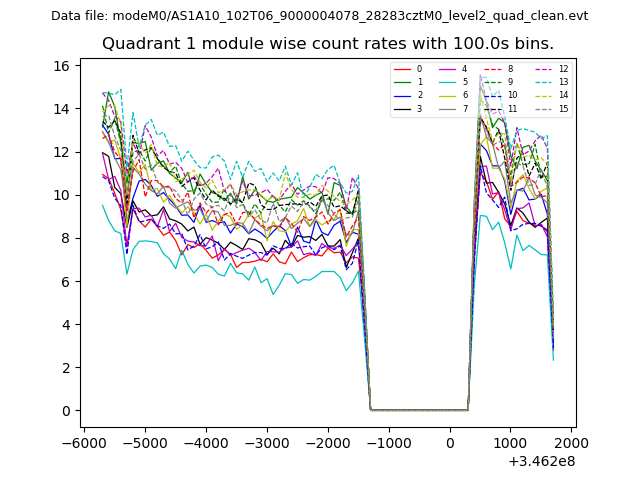
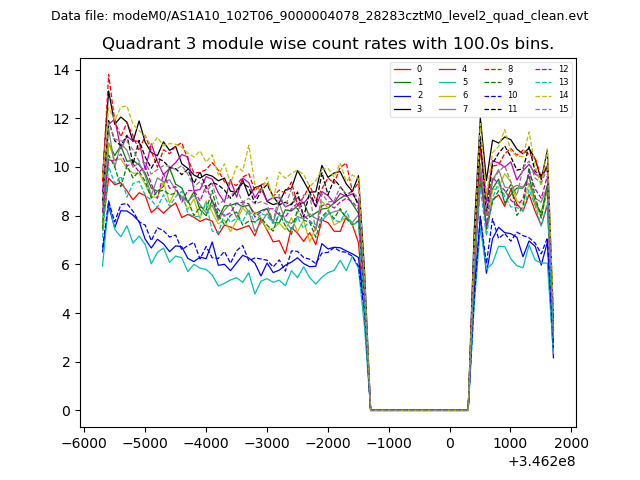
| Module-wise count rates for Quadrant A Data is divided into 100 sec bins |
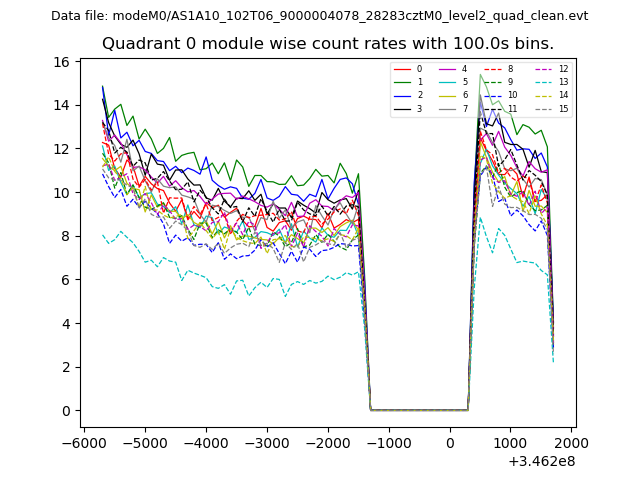 |
 |
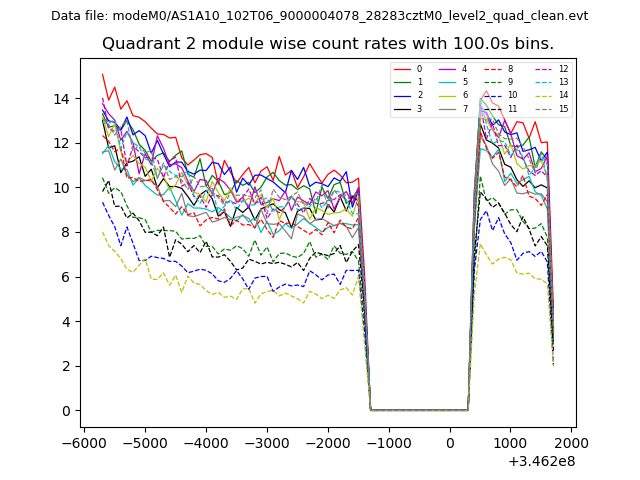
| Module-wise count rates for Quadrant B Data is divided into 100 sec bins |
 |
 |
| Module-wise count rates for Quadrant C Data is divided into 100 sec bins |
 |
 |
| Module-wise count rates for Quadrant D Data is divided into 100 sec bins |
 |
 |
| Parameter | Plot |
|---|---|
| CZT HV Monitor | 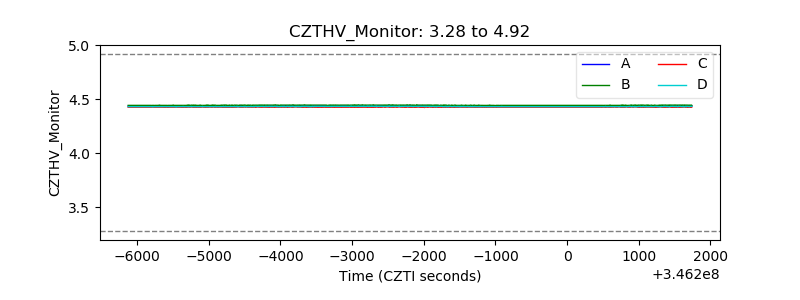 |
| D_VDD | 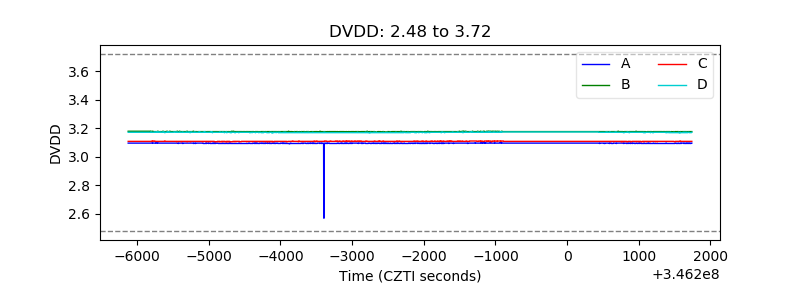 |
| Temperature 1 | 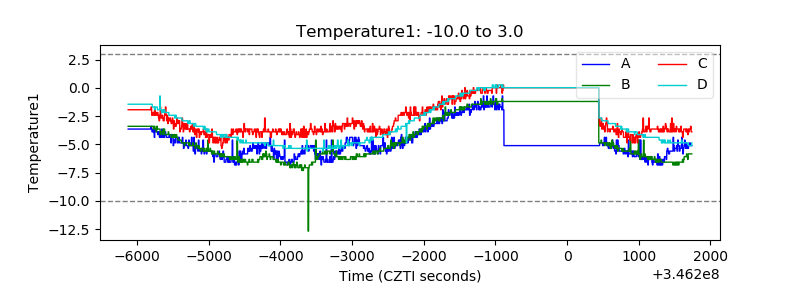 |
| Veto HV Monitor | 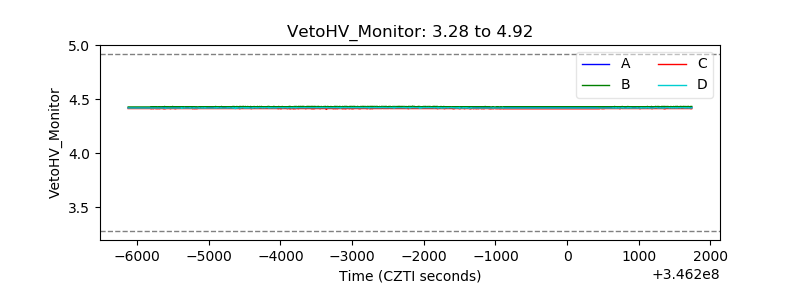 |
| Veto LLD | 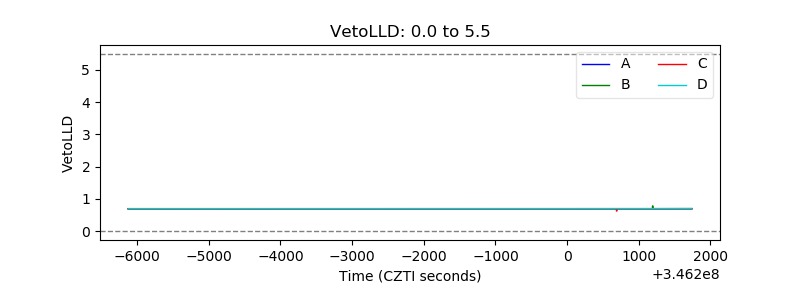 |
| Alpha Counter | 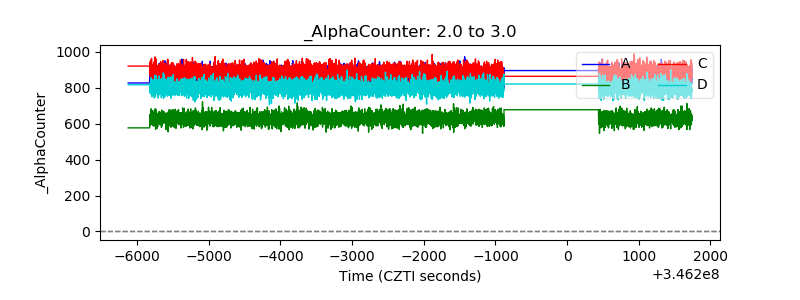 |
| _CPM_Rate | 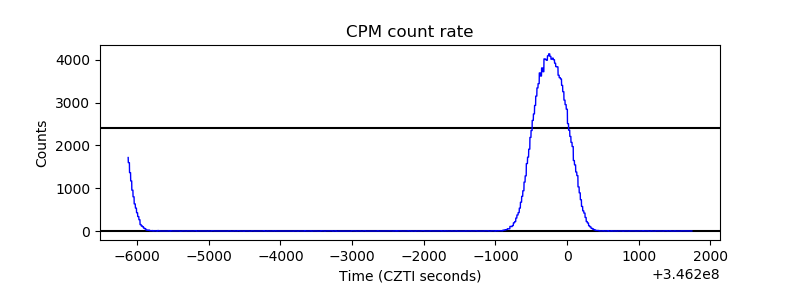 |
| CZT Counter | 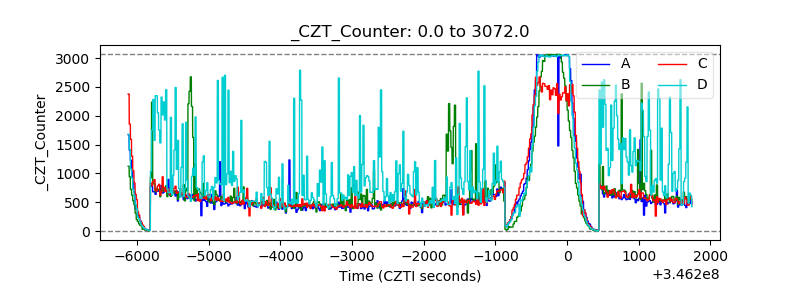 |
| +2.5 Volts monitor |  |
| +5 Volts monitor |  |
| _ROLL_ROT | 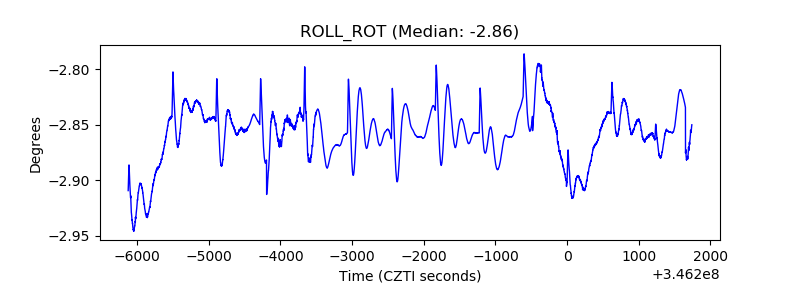 |
| _Roll_DEC |  |
| _Roll_RA | 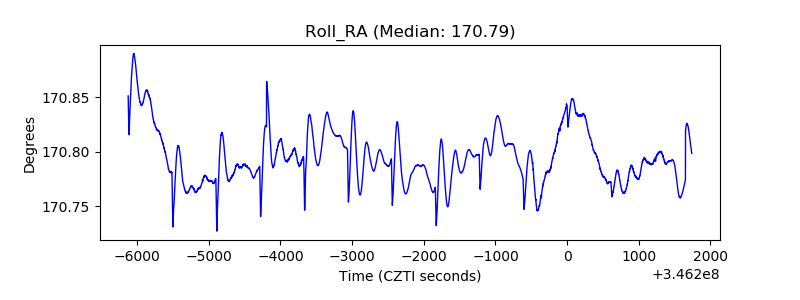 |
| Veto Counter | 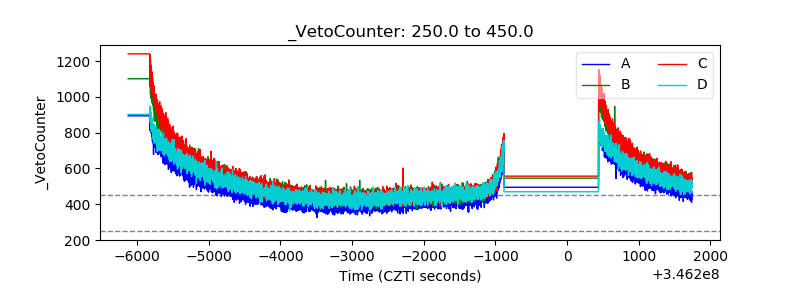 |