| Param | Original file | Final file |
|---|---|---|
| Filename | modeM0/AS1A10_102T06_9000004078_28284cztM0_level2.evt | modeM0/AS1A10_102T06_9000004078_28284cztM0_level2_quad_clean.evt |
| Size (bytes) | 539,743,680 | 117,244,800 |
| Size | 514.7 MB | 111.8 MB |
| Events in quadrant A | 3,067,997 | 801,558 |
| Events in quadrant B | 3,593,609 | 828,592 |
| Events in quadrant C | 3,174,866 | 795,699 |
| Events in quadrant D | 6,099,635 | 702,603 |
| Mode M9 | |||
|---|---|---|---|
| Quadrant | BADHDUFLAG | Total packets | Discarded packets |
| A | 0 | 21 | 0 |
| B | 0 | 22 | 0 |
| C | 0 | 22 | 0 |
| D | 0 | 22 | 0 |
| Mode M0 | |||
|---|---|---|---|
| Quadrant | BADHDUFLAG | Total packets | Discarded packets |
| A | 0 | 12971 | 0 |
| B | 0 | 14666 | 0 |
| C | 0 | 13307 | 0 |
| D | 0 | 22322 | 0 |
| Quadrant | Total seconds | Saturated seconds | Saturation percentage |
|---|---|---|---|
| A | 6052 | 33 | 0.545274% |
| B | 6052 | 122 | 2.015863% |
| C | 6052 | 78 | 1.288830% |
| D | 6051 | 973 | 16.079987% |
Noise dominated data is calculated using 1-second bins in cleaned event files. If a bin has >2000 counts, and if more than 50% of those come from <1% of pixels, then it is considered to be noise-dominated and hence unusable.
| Quadrant | # 1 sec bins | Bins with >0 counts | Bins with >2000 counts | High rate bins dominated by noise | Noise dominated (total time) | Noise dominated (detector-on time) | Marked lightcurve |
|---|---|---|---|---|---|---|---|
| A | 7432 | 6053 | 7 | 7 | 0.09% | 0.12% | 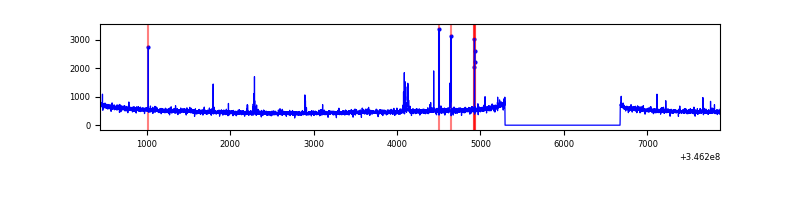 |
| B | 7432 | 6053 | 65 | 65 | 0.87% | 1.07% | 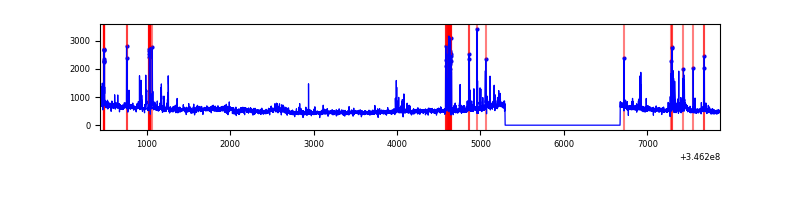 |
| C | 7432 | 6053 | 0 | 0 | 0.00% | 0.00% | 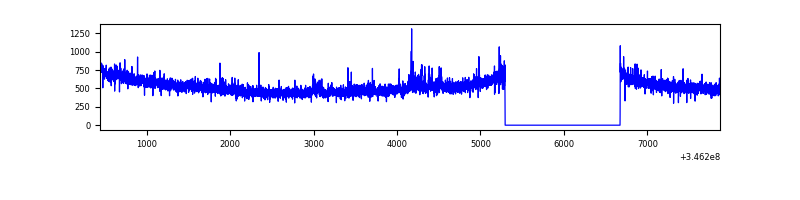 |
| D | 7431 | 6052 | 804 | 804 | 10.82% | 13.28% | 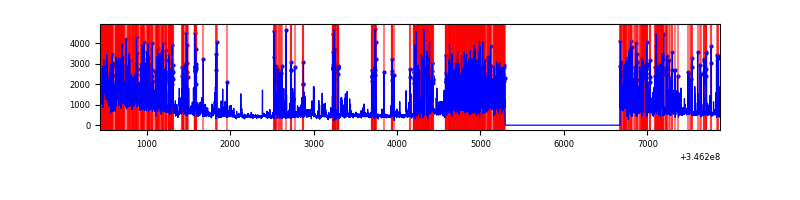 |
Top three noisy pixels from each quadrant. If the there are fewer than three noisy pixels in the level2.evt file, extra rows are filled as -1
| Pixel properties | Quadrant properties | ||||||
|---|---|---|---|---|---|---|---|
| Quadrant | DetID | PixID | Counts | Sigma | Mean | Median | Sigma |
| A | 12 | 96 | 56576 | 364.99 | 776 | 762 | 152.9 |
| A | 4 | 2 | 15966 | 99.43 | 776 | 762 | 152.9 |
| A | 13 | 254 | 10362 | 62.78 | 776 | 762 | 152.9 |
| B | 10 | 245 | 487519 | 3378.28 | 780 | 764 | 144.1 |
| B | 4 | 200 | 34770 | 236.02 | 780 | 764 | 144.1 |
| B | 12 | 111 | 16800 | 111.3 | 780 | 764 | 144.1 |
| C | 14 | 238 | 125695 | 722.87 | 758 | 765 | 172.8 |
| C | 3 | 233 | 92447 | 530.49 | 758 | 765 | 172.8 |
| C | 13 | 61 | 5227 | 25.82 | 758 | 765 | 172.8 |
| D | 1 | 52 | 2518822 | 15699.67 | 689 | 672 | 160.4 |
| D | 8 | 195 | 780073 | 4859.26 | 689 | 672 | 160.4 |
| D | 12 | 250 | 79060 | 488.72 | 689 | 672 | 160.4 |
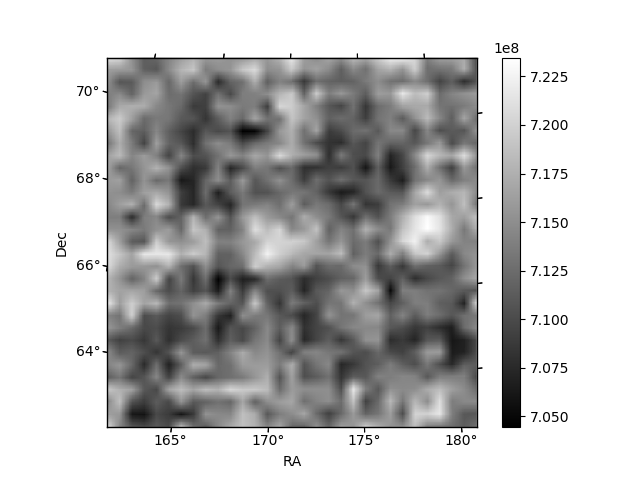
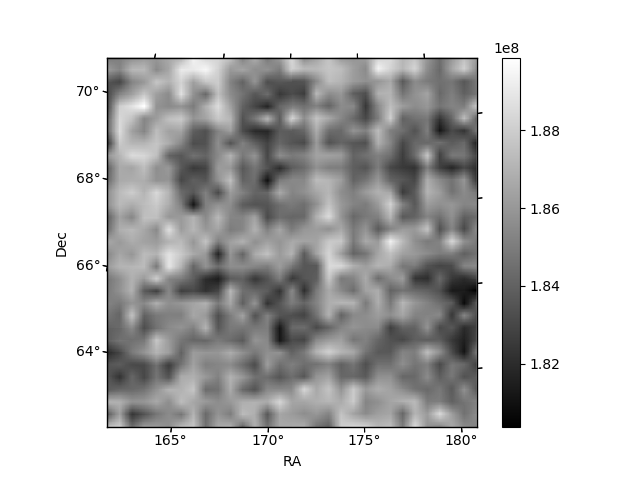
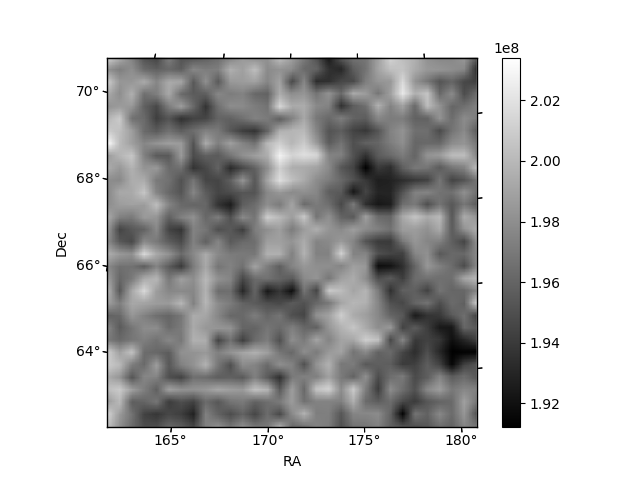
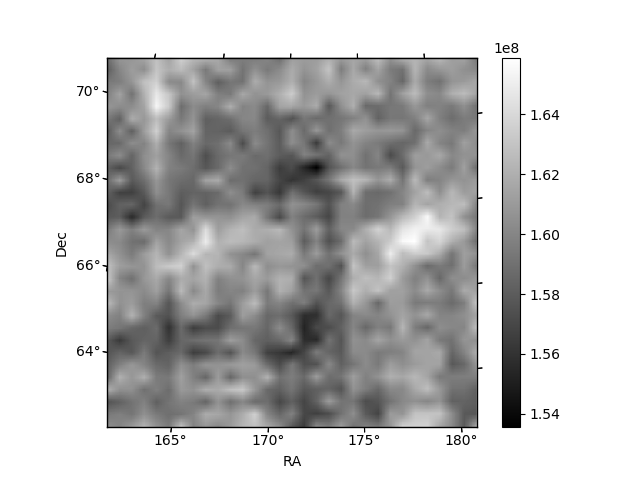
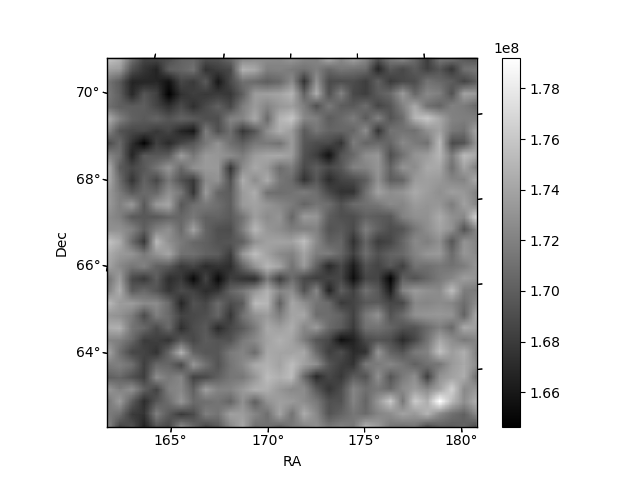
Histogram calculated using DETX and DETY for each event in the final _common_clean file
| Quadrant A | 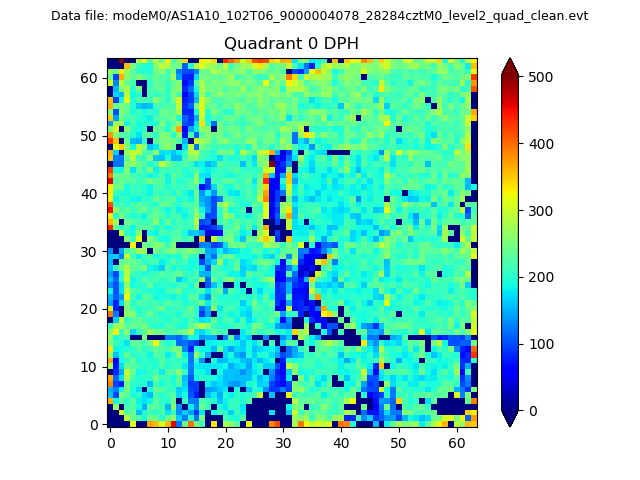 |
 |
Quadrant B |
|---|---|---|---|
| Quadrant D | 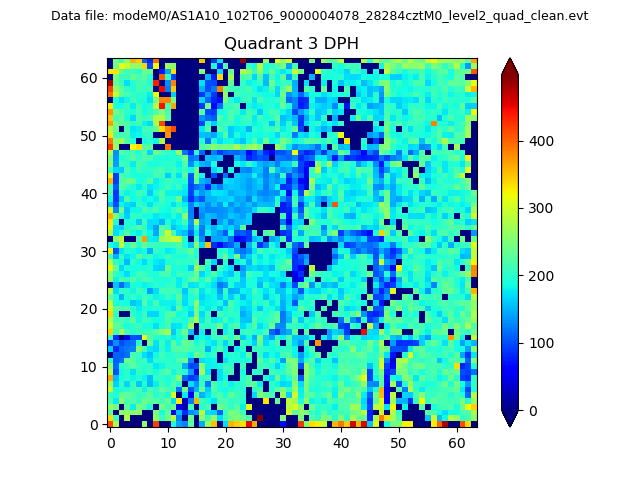 |
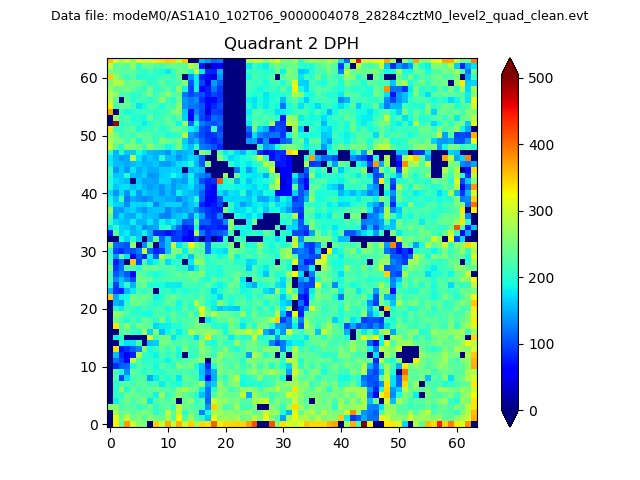 |
Quadrant C |
| Plot type | Count rate plots | Images |
|---|---|---|
| Comparison with Poisson distribution Blue bars denote a histogram of data divided into 1 sec bins. Red curve is a Poisson curve with rate = median count rate of data. |
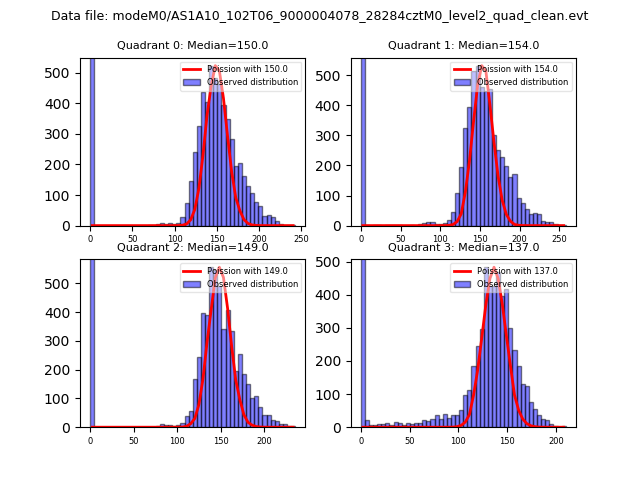 |
 |
| Quadrant-wise count rates Data is divided into 100 sec bins |
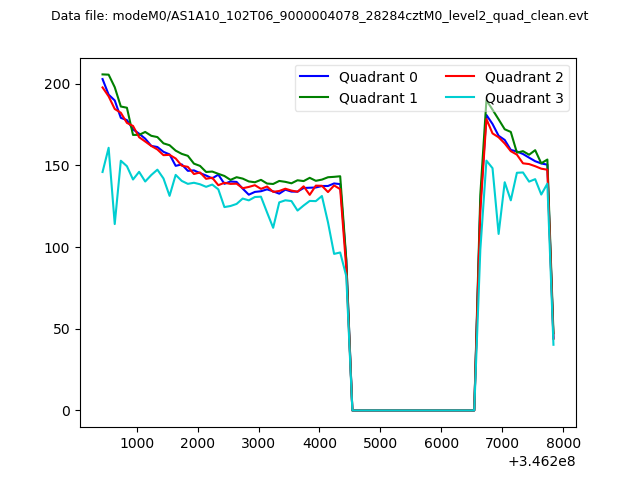 |
|
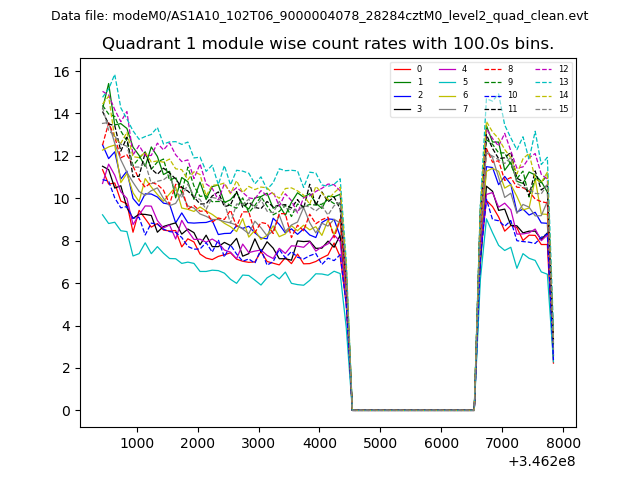
| Module-wise count rates for Quadrant A Data is divided into 100 sec bins |
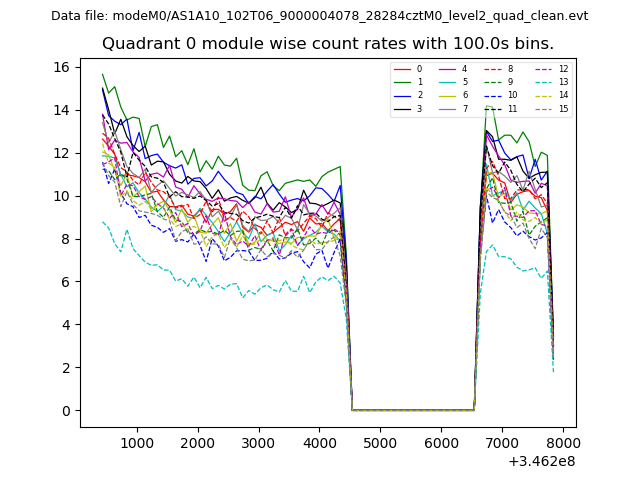 |
 |
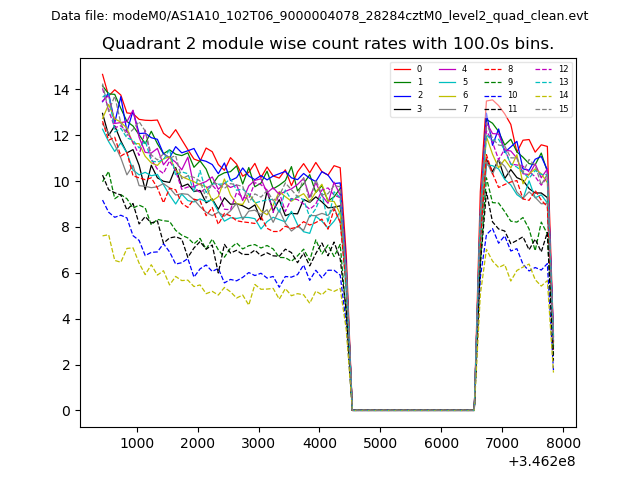
| Module-wise count rates for Quadrant B Data is divided into 100 sec bins |
 |
 |
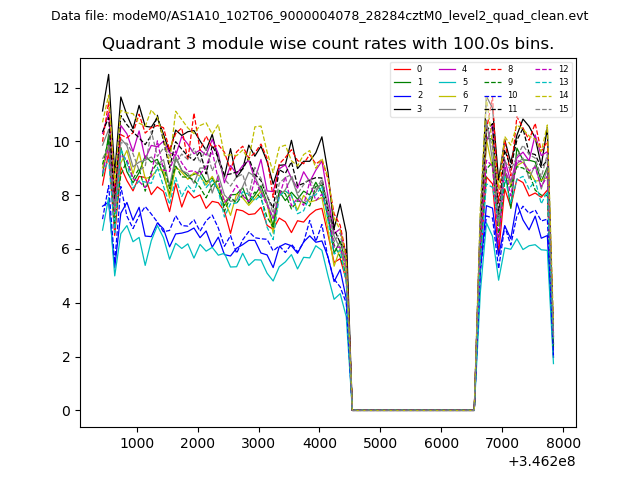
| Module-wise count rates for Quadrant C Data is divided into 100 sec bins |
 |
 |
| Module-wise count rates for Quadrant D Data is divided into 100 sec bins |
 |
 |
| Parameter | Plot |
|---|---|
| CZT HV Monitor | 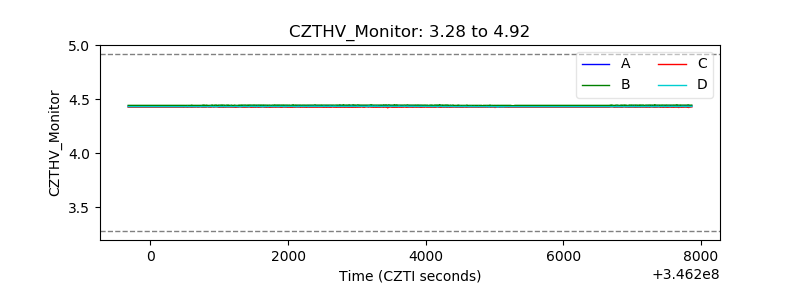 |
| D_VDD | 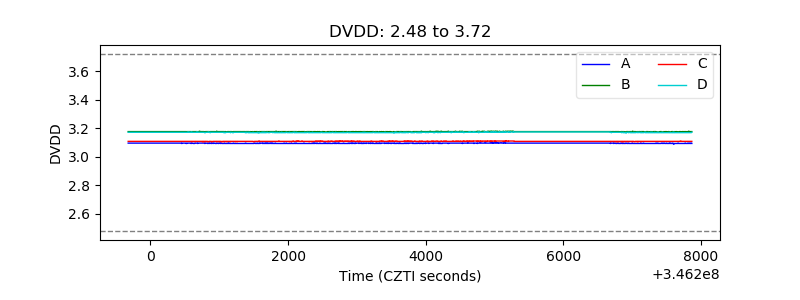 |
| Temperature 1 | 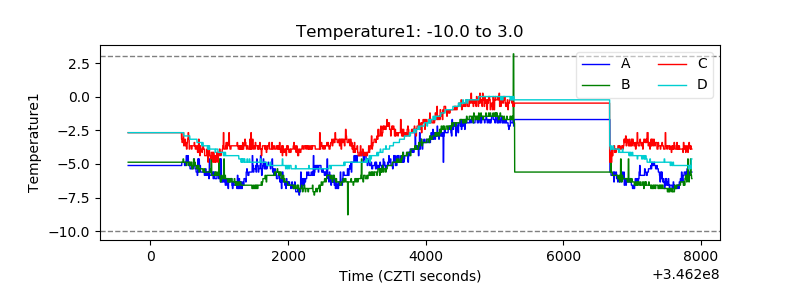 |
| Veto HV Monitor |  |
| Veto LLD | 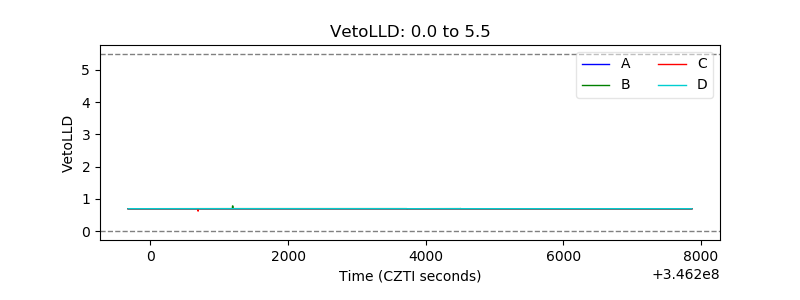 |
| Alpha Counter | 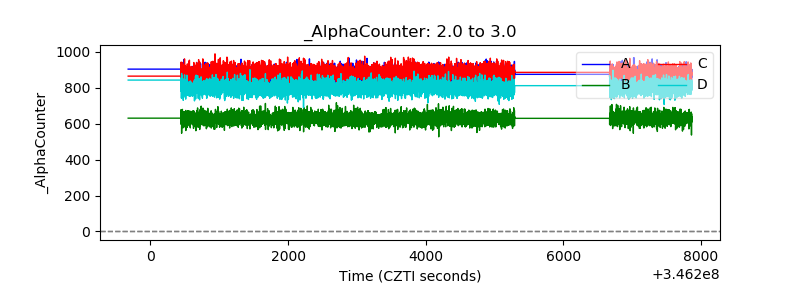 |
| _CPM_Rate |  |
| CZT Counter | 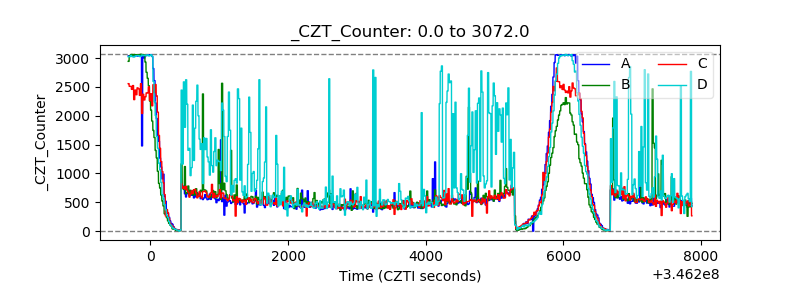 |
| +2.5 Volts monitor |  |
| +5 Volts monitor |  |
| _ROLL_ROT | 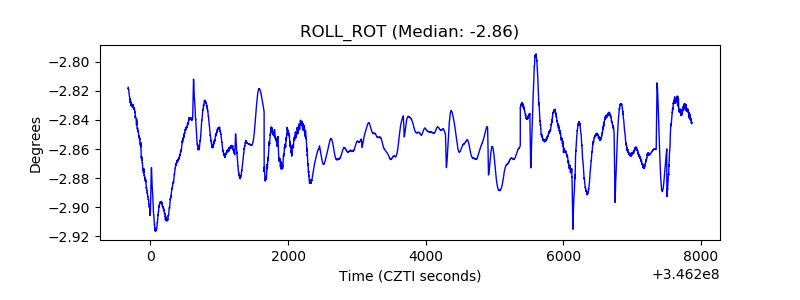 |
| _Roll_DEC | 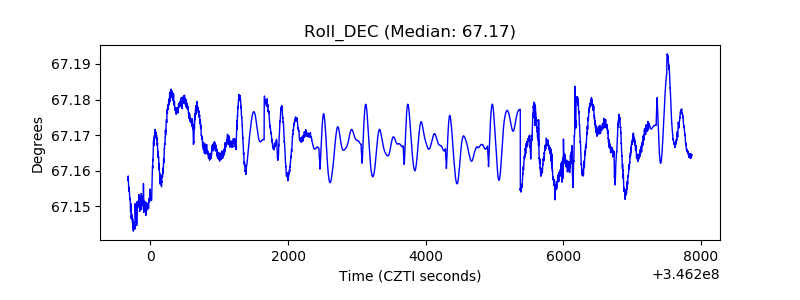 |
| _Roll_RA | 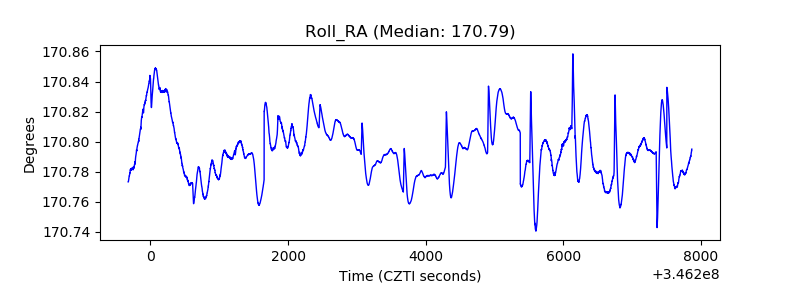 |
| Veto Counter | 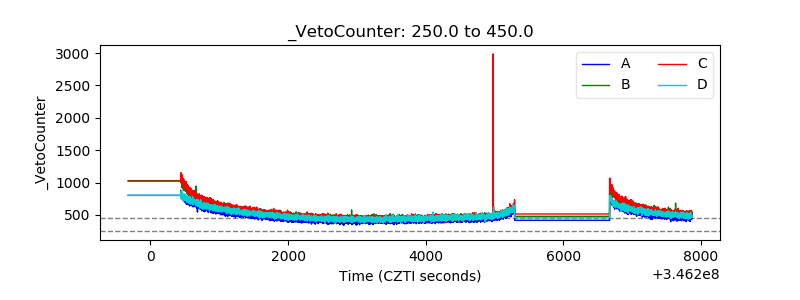 |