| Param | Original file | Final file |
|---|---|---|
| Filename | modeM0/AS1A10_102T06_9000004078_28285cztM0_level2.evt | modeM0/AS1A10_102T06_9000004078_28285cztM0_level2_quad_clean.evt |
| Size (bytes) | 522,262,080 | 113,132,160 |
| Size | 498.1 MB | 107.9 MB |
| Events in quadrant A | 3,109,873 | 758,691 |
| Events in quadrant B | 3,512,593 | 782,082 |
| Events in quadrant C | 3,179,750 | 745,016 |
| Events in quadrant D | 5,574,541 | 688,115 |
| Mode M9 | |||
|---|---|---|---|
| Quadrant | BADHDUFLAG | Total packets | Discarded packets |
| A | 0 | 17 | 0 |
| B | 0 | 18 | 0 |
| C | 0 | 18 | 0 |
| D | 0 | 18 | 0 |
| Mode M0 | |||
|---|---|---|---|
| Quadrant | BADHDUFLAG | Total packets | Discarded packets |
| A | 0 | 13450 | 0 |
| B | 0 | 14629 | 0 |
| C | 0 | 13624 | 0 |
| D | 0 | 21138 | 0 |
| Quadrant | Total seconds | Saturated seconds | Saturation percentage |
|---|---|---|---|
| A | 6485 | 11 | 0.169622% |
| B | 6485 | 73 | 1.125675% |
| C | 6485 | 63 | 0.971473% |
| D | 6485 | 703 | 10.840401% |
Noise dominated data is calculated using 1-second bins in cleaned event files. If a bin has >2000 counts, and if more than 50% of those come from <1% of pixels, then it is considered to be noise-dominated and hence unusable.
| Quadrant | # 1 sec bins | Bins with >0 counts | Bins with >2000 counts | High rate bins dominated by noise | Noise dominated (total time) | Noise dominated (detector-on time) | Marked lightcurve |
|---|---|---|---|---|---|---|---|
| A | 7805 | 6486 | 1 | 1 | 0.01% | 0.02% | 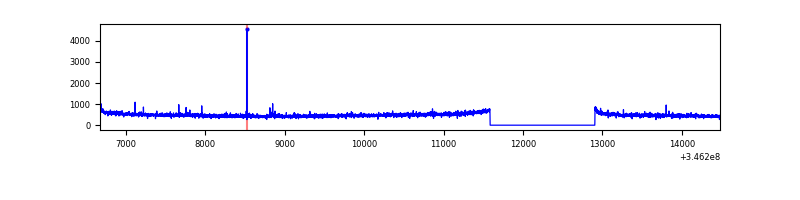 |
| B | 7805 | 6486 | 27 | 27 | 0.35% | 0.42% | 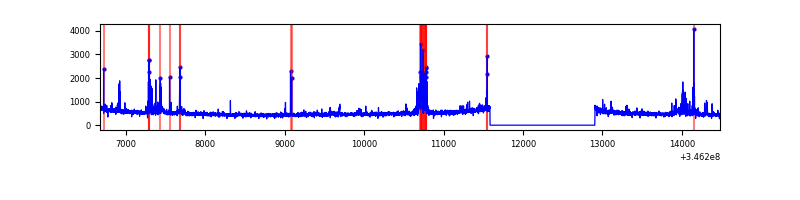 |
| C | 7805 | 6486 | 0 | 0 | 0.00% | 0.00% | 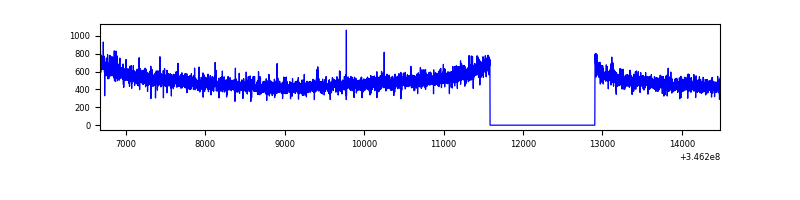 |
| D | 7805 | 6486 | 601 | 601 | 7.70% | 9.27% | 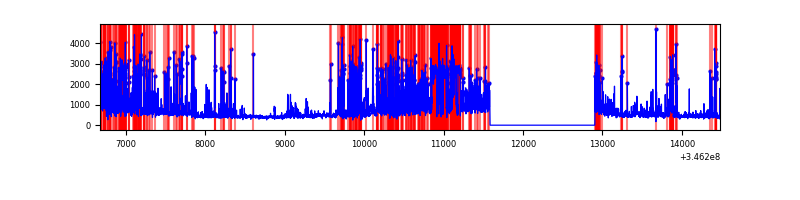 |
Top three noisy pixels from each quadrant. If the there are fewer than three noisy pixels in the level2.evt file, extra rows are filled as -1
| Pixel properties | Quadrant properties | ||||||
|---|---|---|---|---|---|---|---|
| Quadrant | DetID | PixID | Counts | Sigma | Mean | Median | Sigma |
| A | 12 | 96 | 23415 | 142.12 | 800 | 786 | 159.2 |
| A | 13 | 254 | 11013 | 64.23 | 800 | 786 | 159.2 |
| A | 3 | 137 | 7349 | 41.22 | 800 | 786 | 159.2 |
| B | 10 | 245 | 340831 | 2282.07 | 805 | 788 | 149.0 |
| B | 12 | 111 | 17874 | 114.67 | 805 | 788 | 149.0 |
| B | 11 | 111 | 16056 | 102.47 | 805 | 788 | 149.0 |
| C | 14 | 238 | 128615 | 719.58 | 772 | 776 | 177.7 |
| C | 3 | 233 | 41047 | 226.68 | 772 | 776 | 177.7 |
| C | 13 | 61 | 5277 | 25.34 | 772 | 776 | 177.7 |
| D | 1 | 52 | 2279380 | 13403.22 | 723 | 703 | 170.0 |
| D | 8 | 195 | 410161 | 2408.44 | 723 | 703 | 170.0 |
| D | 2 | 250 | 70086 | 408.11 | 723 | 703 | 170.0 |
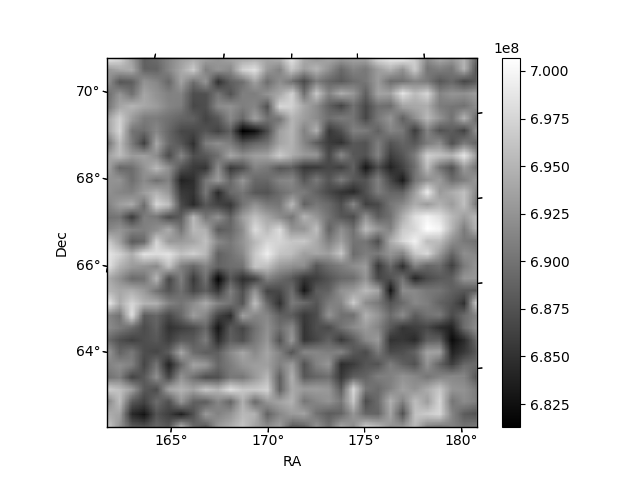
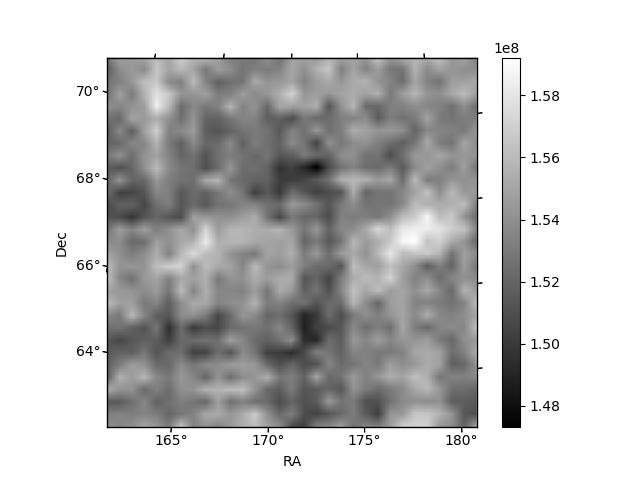
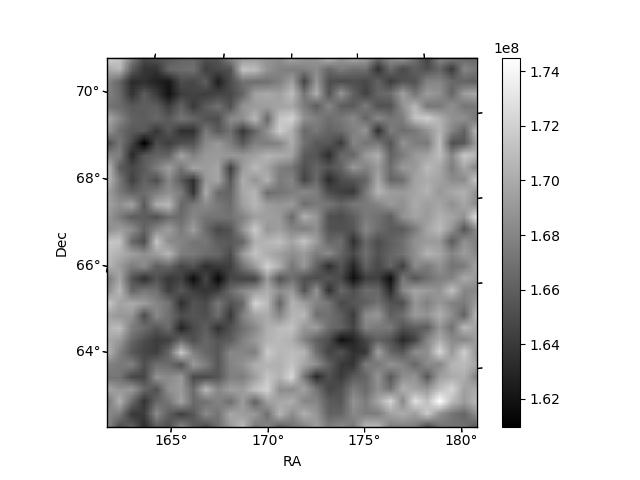
Histogram calculated using DETX and DETY for each event in the final _common_clean file
| Quadrant A | 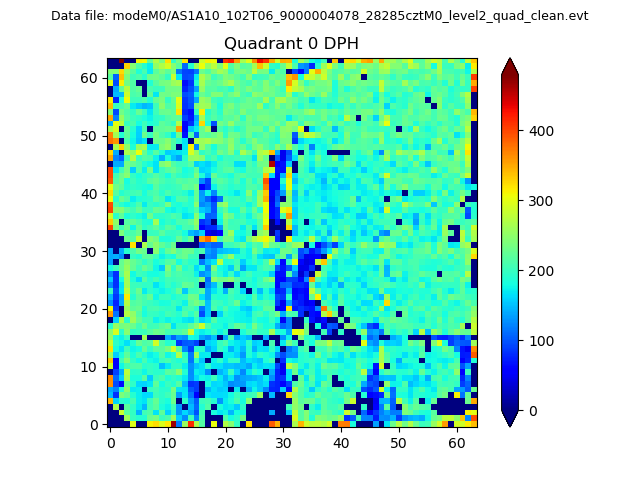 |
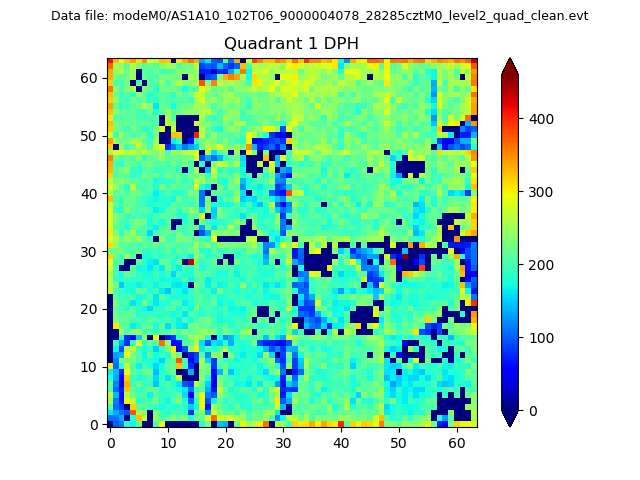 |
Quadrant B |
|---|---|---|---|
| Quadrant D | 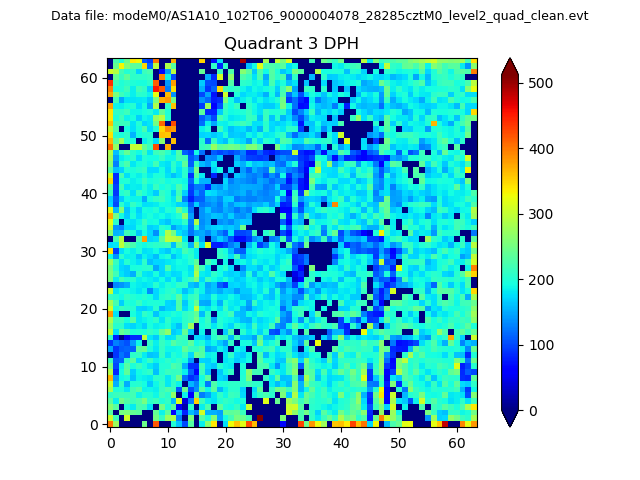 |
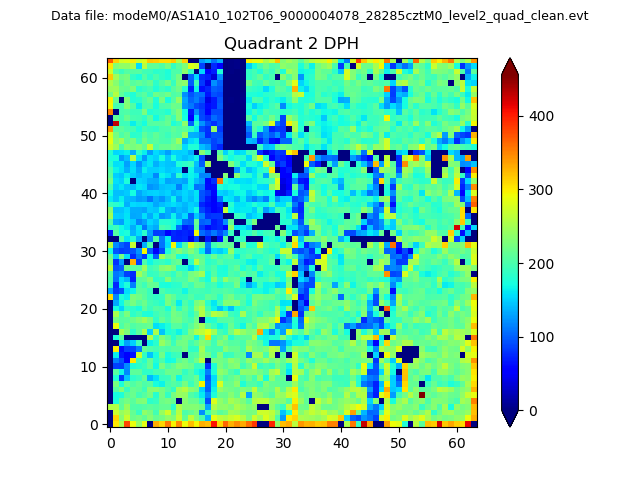 |
Quadrant C |
| Plot type | Count rate plots | Images |
|---|---|---|
| Comparison with Poisson distribution Blue bars denote a histogram of data divided into 1 sec bins. Red curve is a Poisson curve with rate = median count rate of data. |
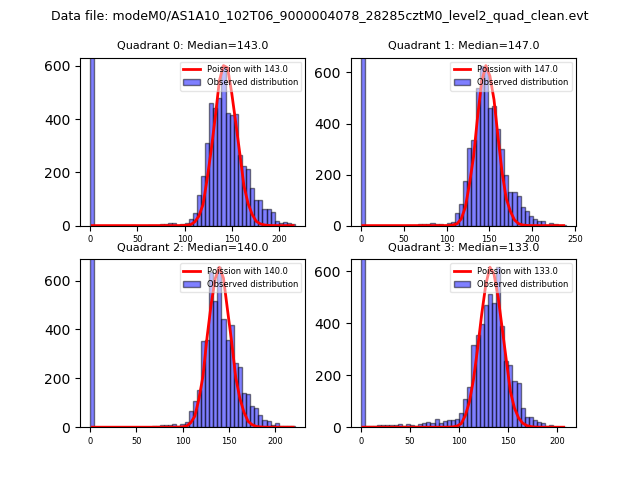 |
 |
| Quadrant-wise count rates Data is divided into 100 sec bins |
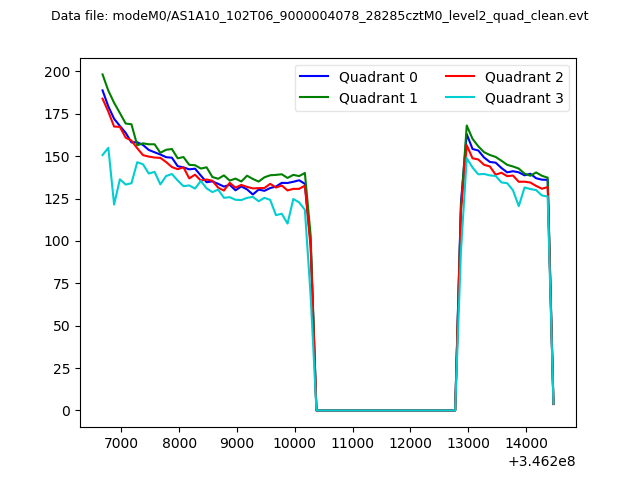 |
|
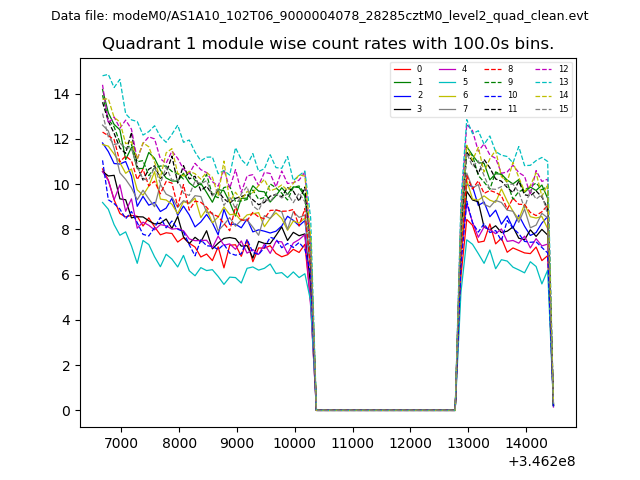
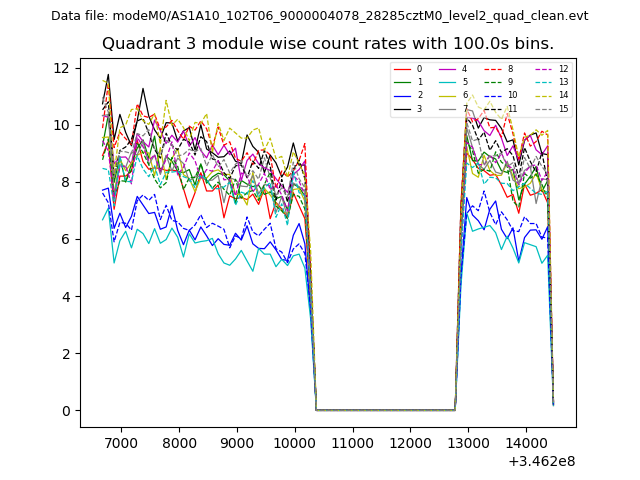
| Module-wise count rates for Quadrant A Data is divided into 100 sec bins |
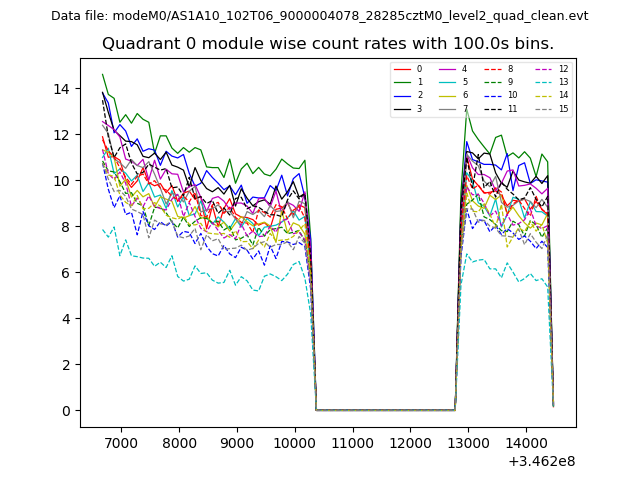 |
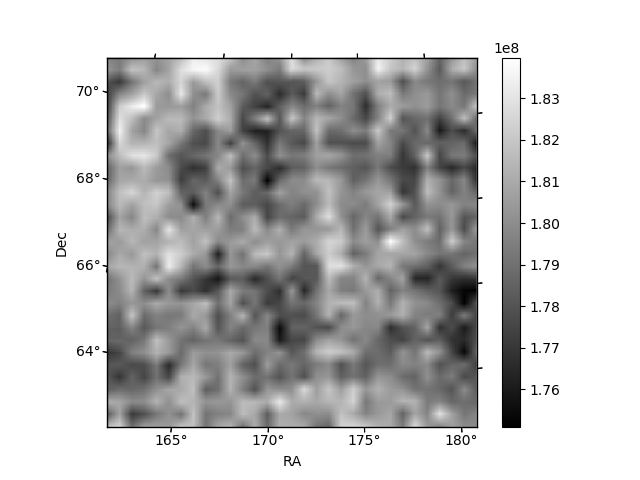 |
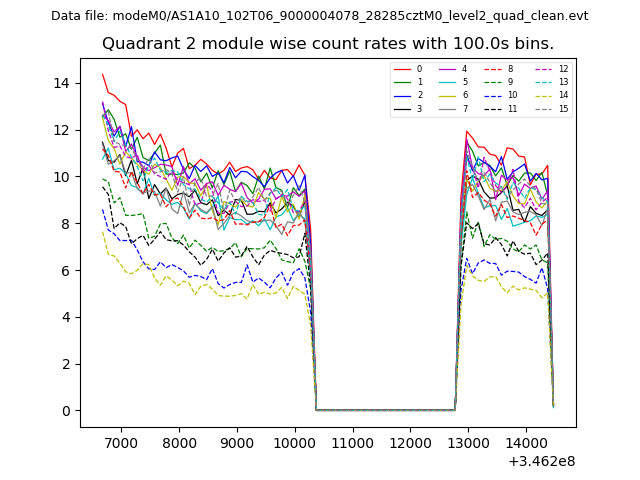
| Module-wise count rates for Quadrant B Data is divided into 100 sec bins |
 |
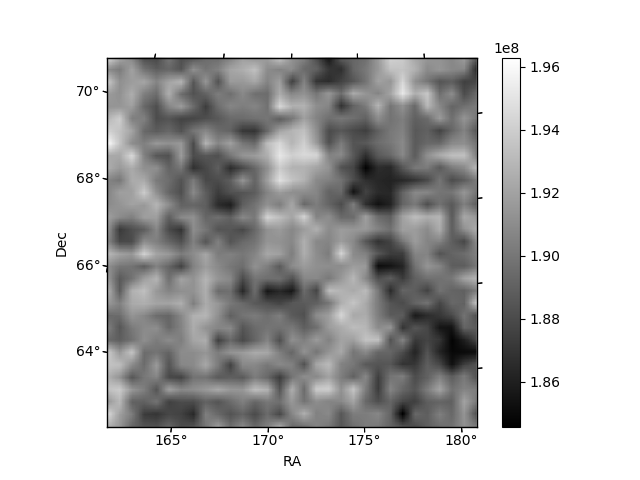 |
| Module-wise count rates for Quadrant C Data is divided into 100 sec bins |
 |
 |
| Module-wise count rates for Quadrant D Data is divided into 100 sec bins |
 |
 |
| Parameter | Plot |
|---|---|
| CZT HV Monitor | 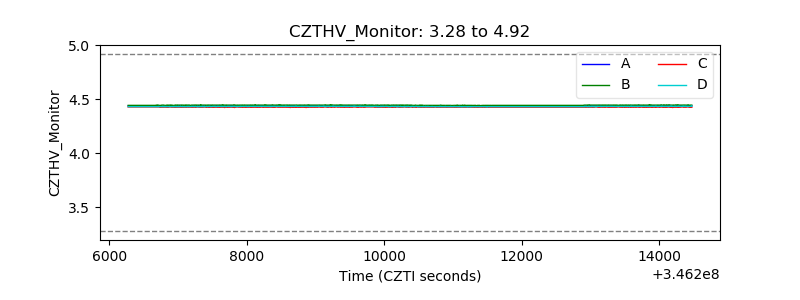 |
| D_VDD | 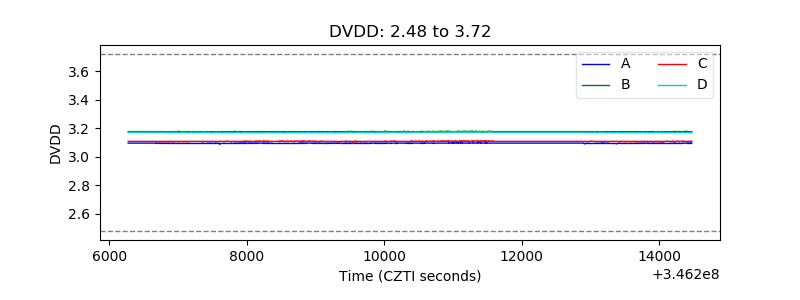 |
| Temperature 1 | 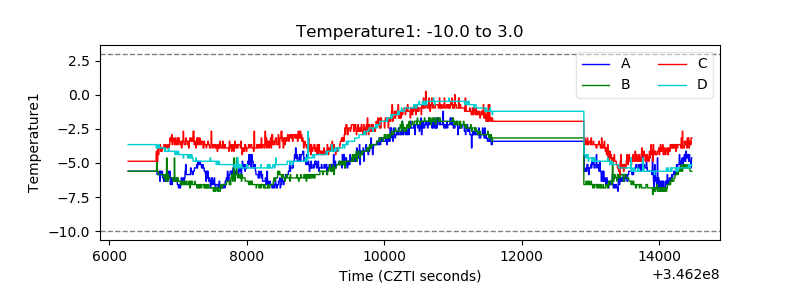 |
| Veto HV Monitor | 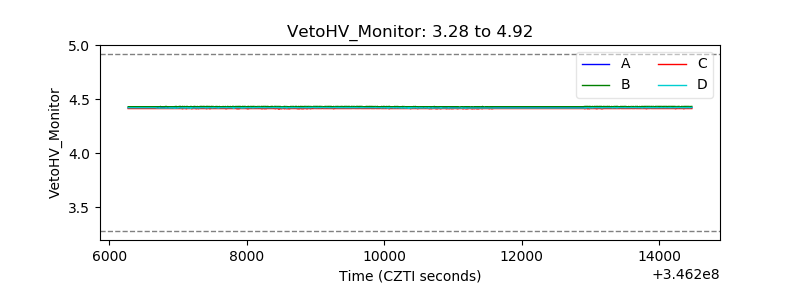 |
| Veto LLD | 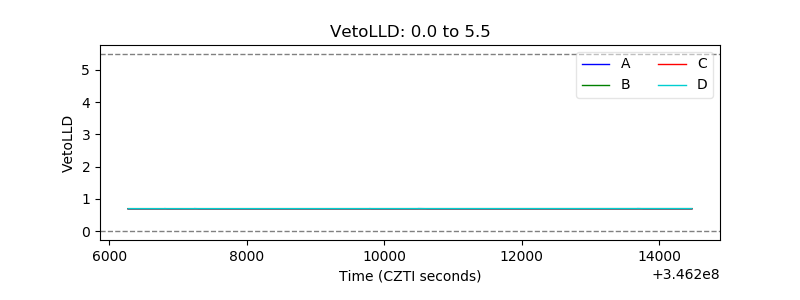 |
| Alpha Counter | 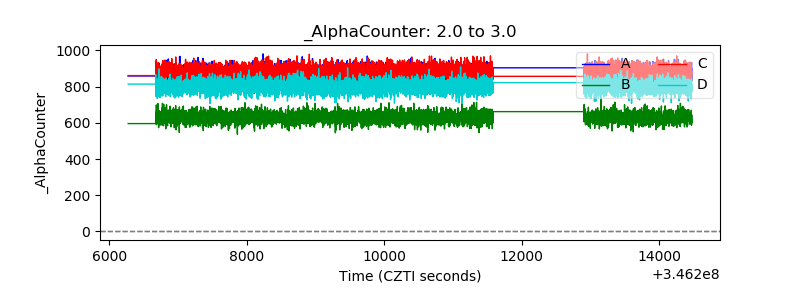 |
| _CPM_Rate | 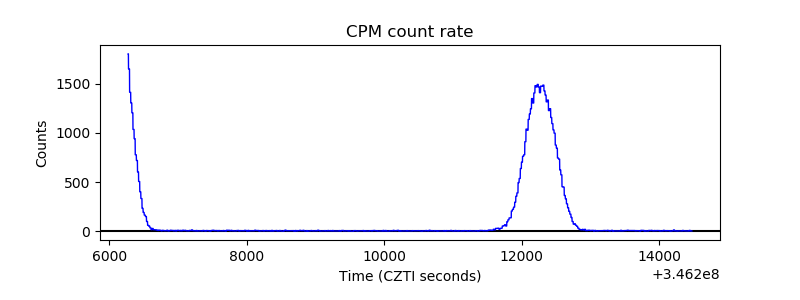 |
| CZT Counter | 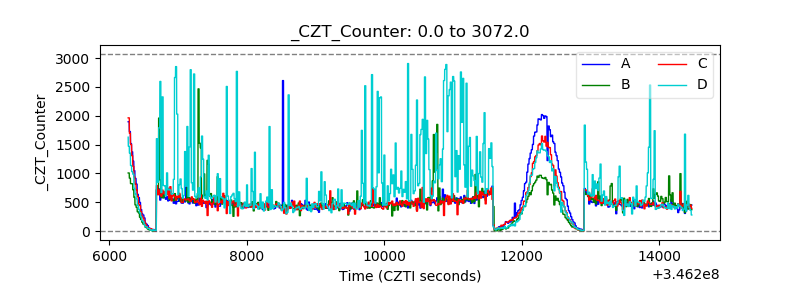 |
| +2.5 Volts monitor |  |
| +5 Volts monitor | 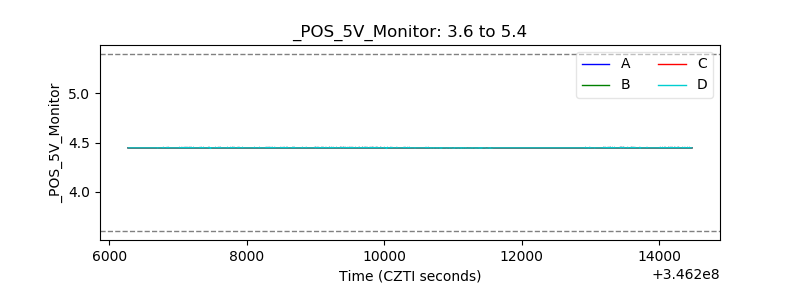 |
| _ROLL_ROT | 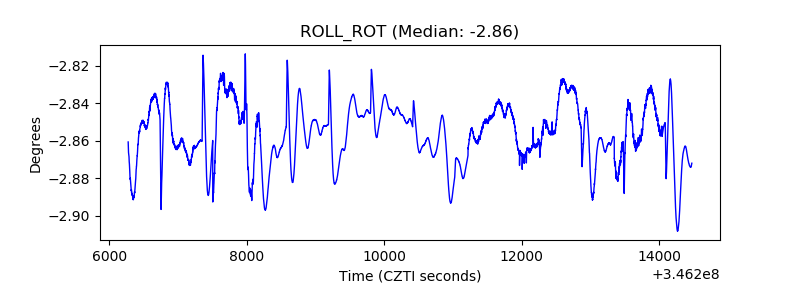 |
| _Roll_DEC |  |
| _Roll_RA | 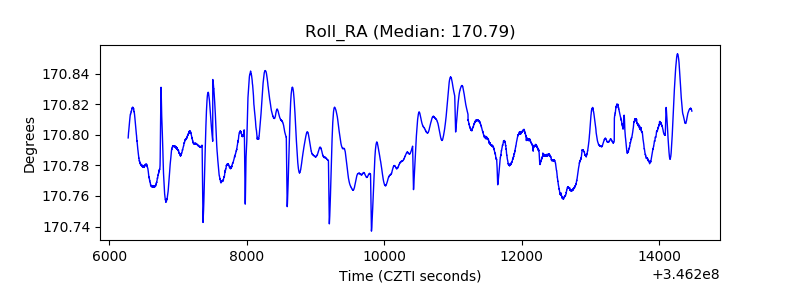 |
| Veto Counter | 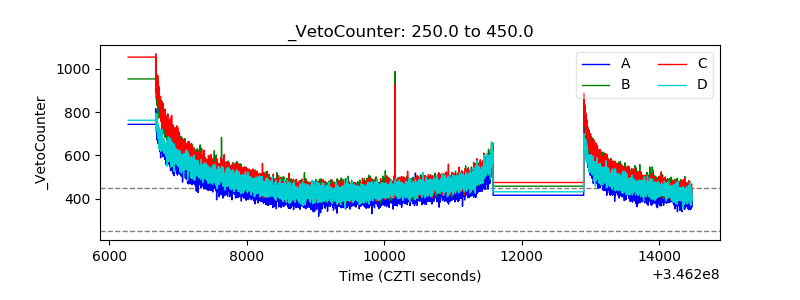 |