| Param | Original file | Final file |
|---|---|---|
| Filename | modeM0/AS1A10_102T06_9000004078_28288cztM0_level2.evt | modeM0/AS1A10_102T06_9000004078_28288cztM0_level2_quad_clean.evt |
| Size (bytes) | 1,357,073,280 | 247,743,360 |
| Size | 1.3 GB | 236.3 MB |
| Events in quadrant A | 7,872,860 | 1,619,044 |
| Events in quadrant B | 9,485,473 | 1,639,698 |
| Events in quadrant C | 7,946,152 | 1,589,495 |
| Events in quadrant D | 14,643,908 | 1,480,221 |
| Mode M9 | |||
|---|---|---|---|
| Quadrant | BADHDUFLAG | Total packets | Discarded packets |
| A | 0 | 18 | 0 |
| B | 0 | 18 | 0 |
| C | 0 | 18 | 0 |
| D | 0 | 18 | 0 |
| Mode M0 | |||
|---|---|---|---|
| Quadrant | BADHDUFLAG | Total packets | Discarded packets |
| A | 0 | 34948 | 0 |
| B | 0 | 39700 | 0 |
| C | 0 | 35061 | 0 |
| D | 0 | 55093 | 0 |
| Quadrant | Total seconds | Saturated seconds | Saturation percentage |
|---|---|---|---|
| A | 17045 | 239 | 1.402171% |
| B | 17046 | 686 | 4.024405% |
| C | 17046 | 277 | 1.625015% |
| D | 17045 | 1613 | 9.463186% |
Noise dominated data is calculated using 1-second bins in cleaned event files. If a bin has >2000 counts, and if more than 50% of those come from <1% of pixels, then it is considered to be noise-dominated and hence unusable.
| Quadrant | # 1 sec bins | Bins with >0 counts | Bins with >2000 counts | High rate bins dominated by noise | Noise dominated (total time) | Noise dominated (detector-on time) | Marked lightcurve |
|---|---|---|---|---|---|---|---|
| A | 18780 | 17049 | 0 | 0 | 0.00% | 0.00% | 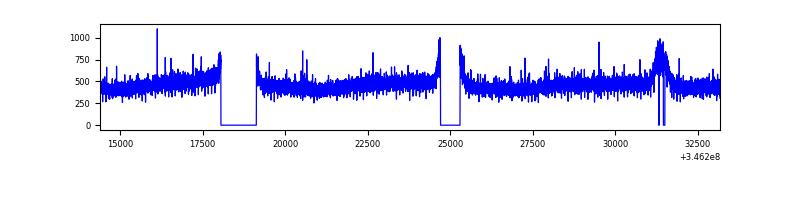 |
| B | 18781 | 17050 | 316 | 316 | 1.68% | 1.85% | 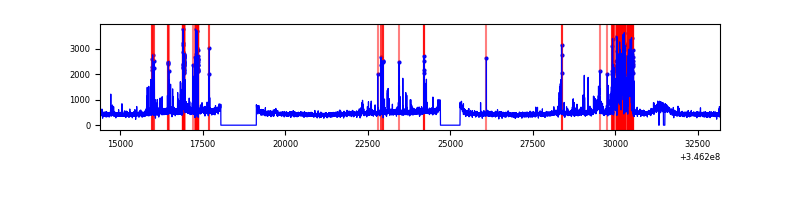 |
| C | 18781 | 17050 | 11 | 11 | 0.06% | 0.06% | 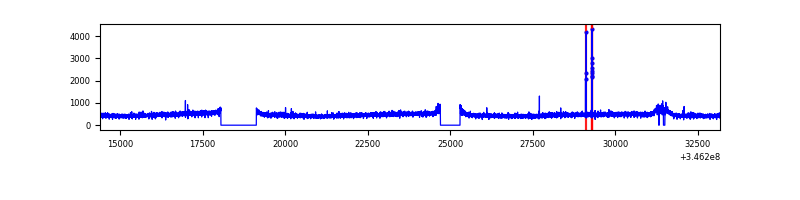 |
| D | 18780 | 17048 | 1272 | 1272 | 6.77% | 7.46% | 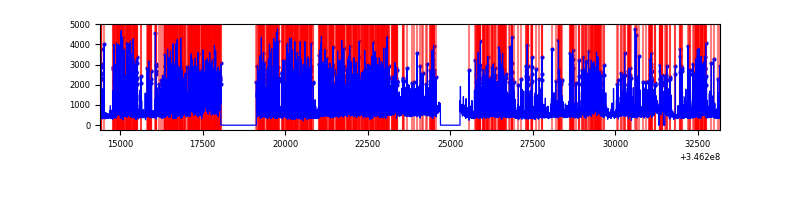 |
Top three noisy pixels from each quadrant. If the there are fewer than three noisy pixels in the level2.evt file, extra rows are filled as -1
| Pixel properties | Quadrant properties | ||||||
|---|---|---|---|---|---|---|---|
| Quadrant | DetID | PixID | Counts | Sigma | Mean | Median | Sigma |
| A | 13 | 254 | 29206 | 66.63 | 2039 | 1990 | 408.4 |
| A | 3 | 137 | 19825 | 43.67 | 2039 | 1990 | 408.4 |
| A | 0 | 226 | 17190 | 37.21 | 2039 | 1990 | 408.4 |
| B | 10 | 245 | 1517780 | 3997.33 | 2003 | 1951 | 379.2 |
| B | 4 | 200 | 64086 | 163.85 | 2003 | 1951 | 379.2 |
| B | 12 | 111 | 47456 | 120.0 | 2003 | 1951 | 379.2 |
| C | 14 | 238 | 317348 | 704.84 | 1945 | 1958 | 447.5 |
| C | 15 | 208 | 37164 | 78.68 | 1945 | 1958 | 447.5 |
| C | 3 | 233 | 20033 | 40.39 | 1945 | 1958 | 447.5 |
| D | 1 | 52 | 5766792 | 12944.25 | 1896 | 1841 | 445.4 |
| D | 8 | 195 | 1112042 | 2492.77 | 1896 | 1841 | 445.4 |
| D | 2 | 250 | 366283 | 818.29 | 1896 | 1841 | 445.4 |
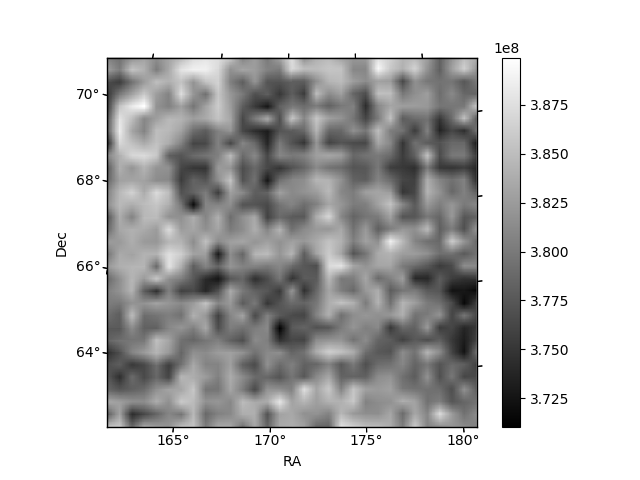
Histogram calculated using DETX and DETY for each event in the final _common_clean file
| Quadrant A | 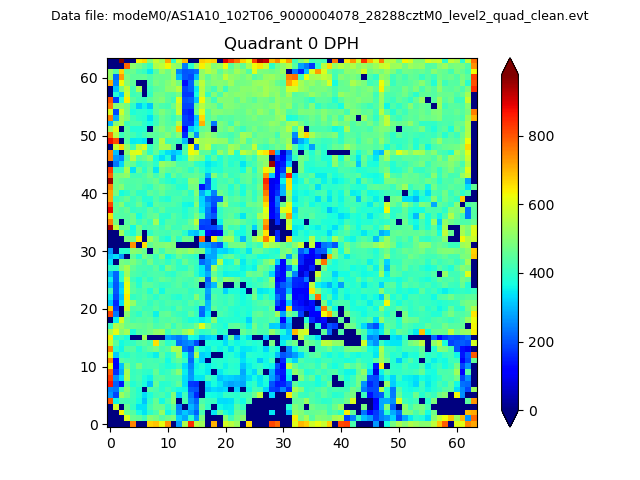 |
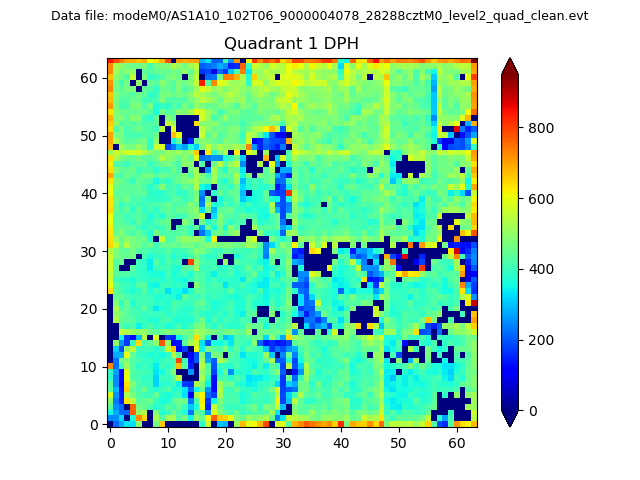 |
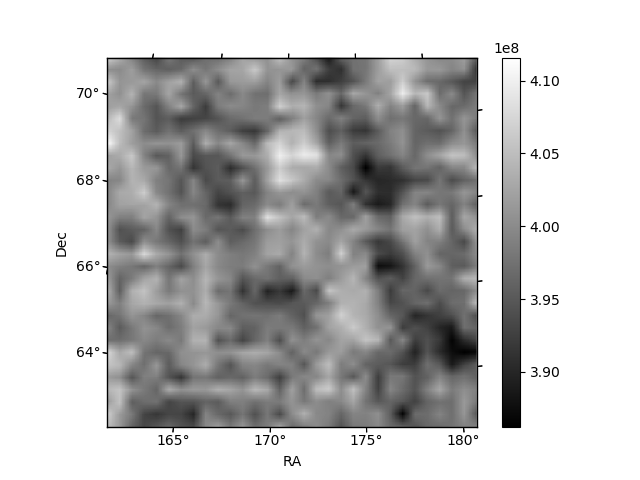
Quadrant B |
|---|---|---|---|
| Quadrant D | 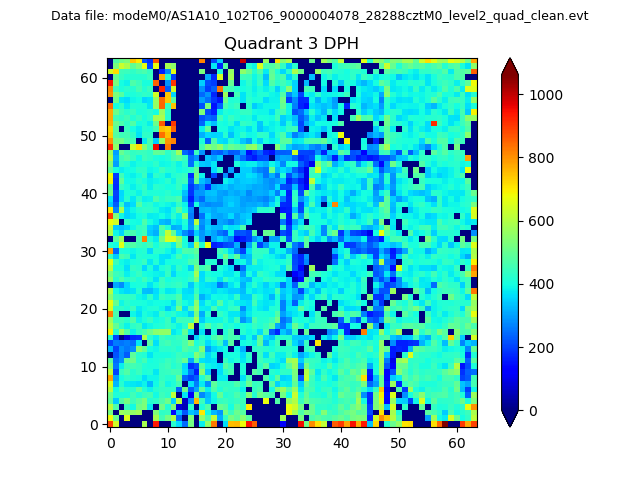 |
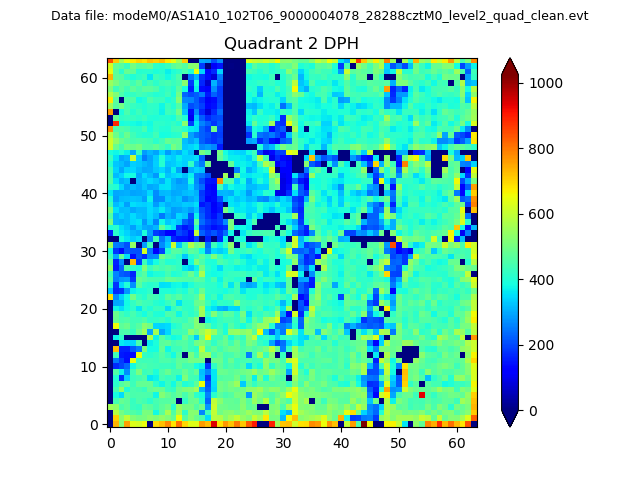 |
Quadrant C |
| Plot type | Count rate plots | Images |
|---|---|---|
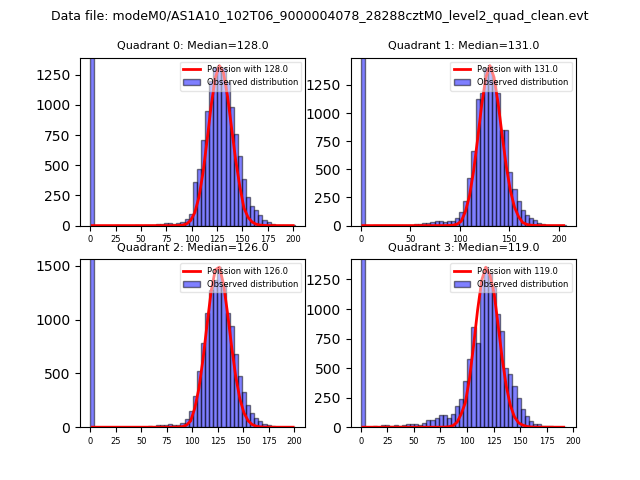
| Comparison with Poisson distribution Blue bars denote a histogram of data divided into 1 sec bins. Red curve is a Poisson curve with rate = median count rate of data. |
 |
 |
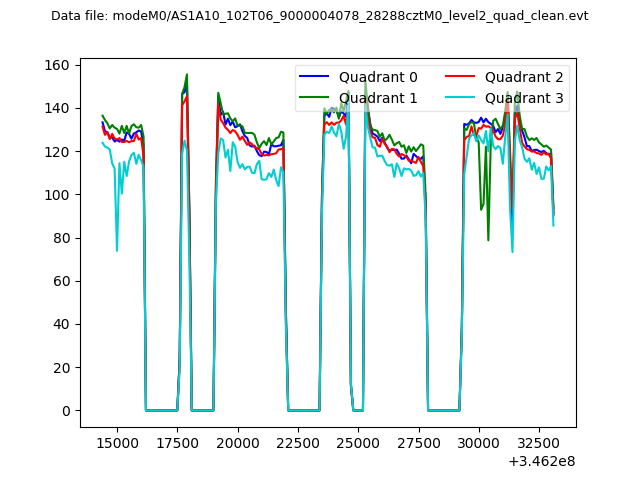
| Quadrant-wise count rates Data is divided into 100 sec bins |
 |
|
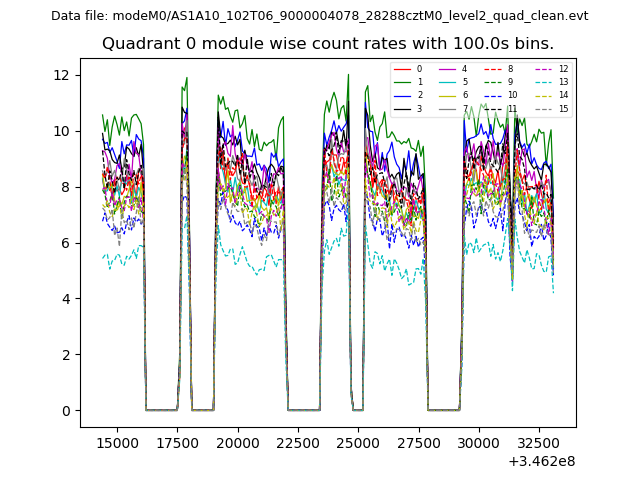
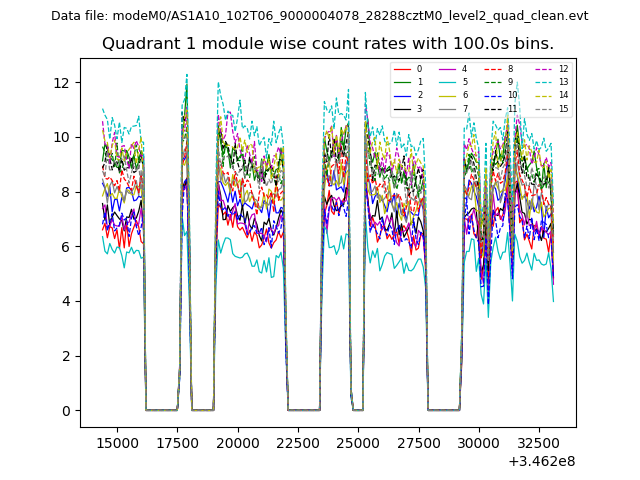
| Module-wise count rates for Quadrant A Data is divided into 100 sec bins |
 |
 |
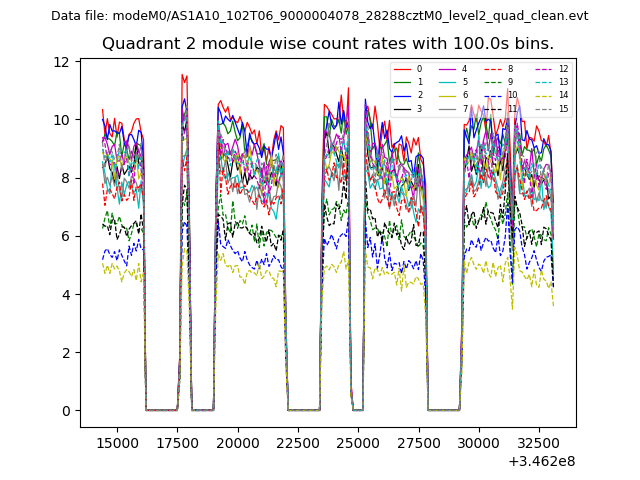
| Module-wise count rates for Quadrant B Data is divided into 100 sec bins |
 |
 |
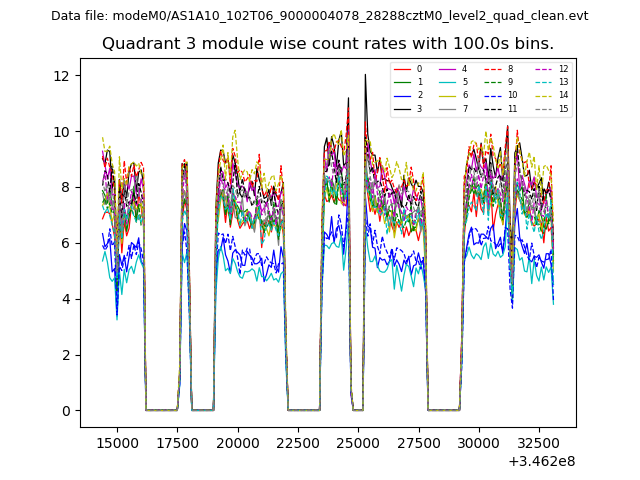
| Module-wise count rates for Quadrant C Data is divided into 100 sec bins |
 |
 |
| Module-wise count rates for Quadrant D Data is divided into 100 sec bins |
 |
 |
| Parameter | Plot |
|---|---|
| CZT HV Monitor | 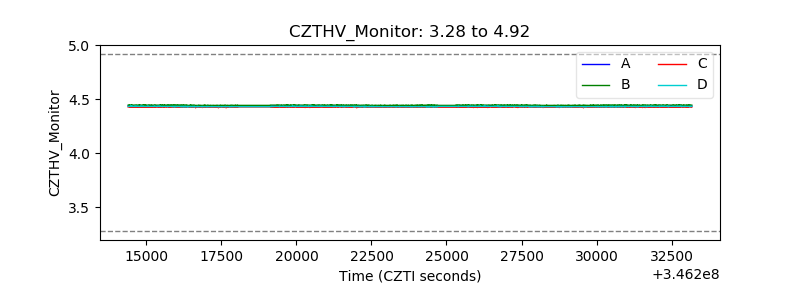 |
| D_VDD | 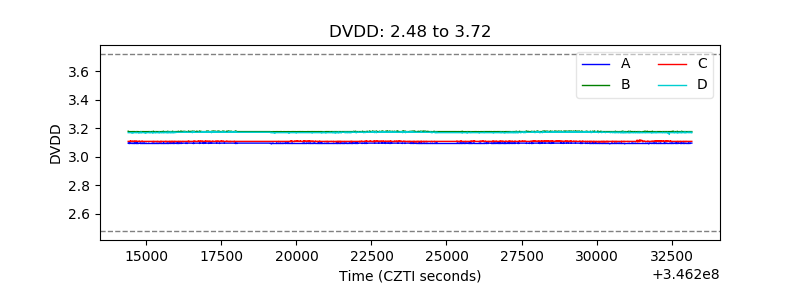 |
| Temperature 1 | 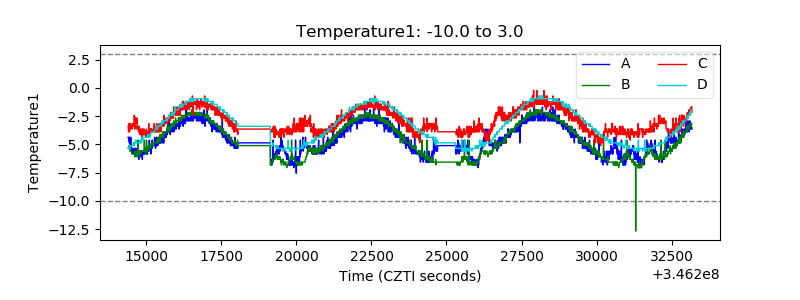 |
| Veto HV Monitor |  |
| Veto LLD | 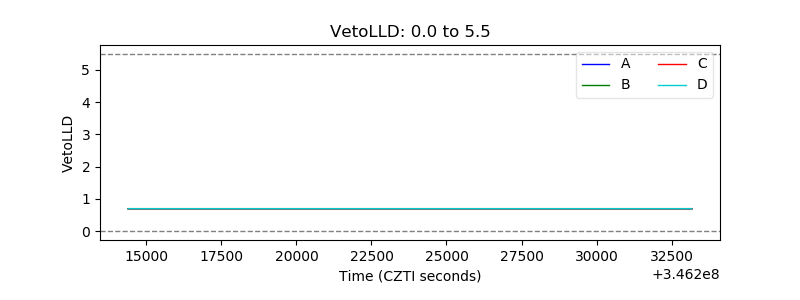 |
| Alpha Counter | 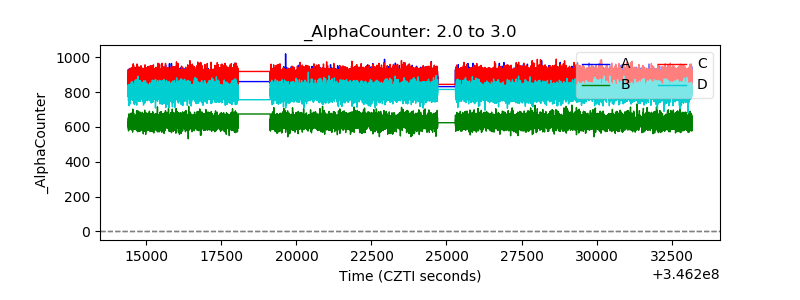 |
| _CPM_Rate | 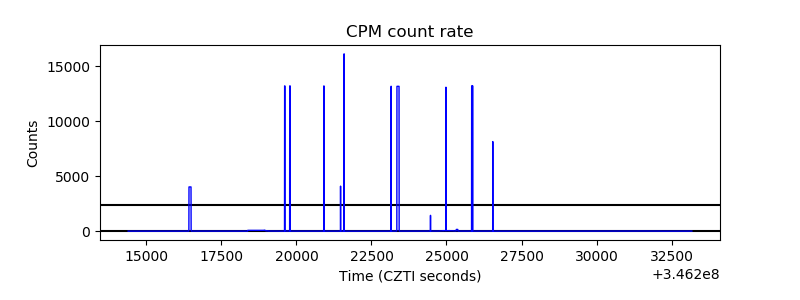 |
| CZT Counter | 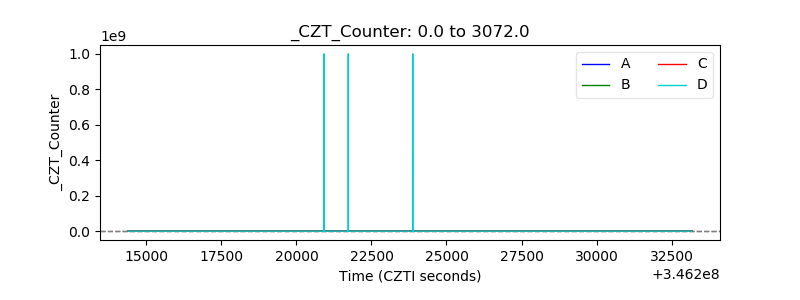 |
| +2.5 Volts monitor |  |
| +5 Volts monitor | 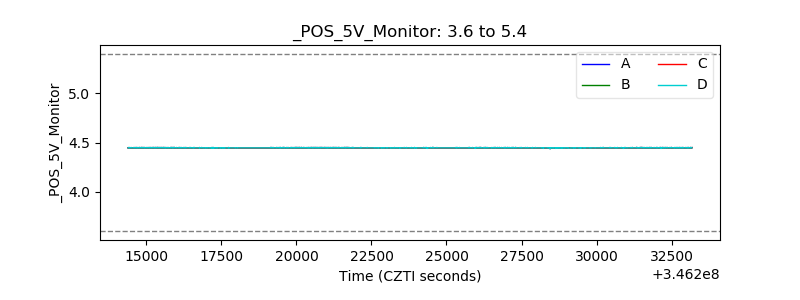 |
| _ROLL_ROT | 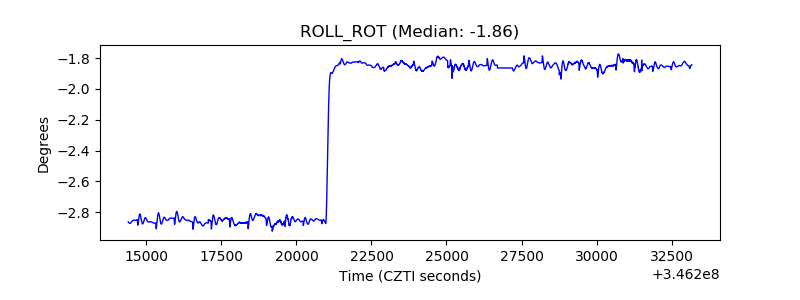 |
| _Roll_DEC | 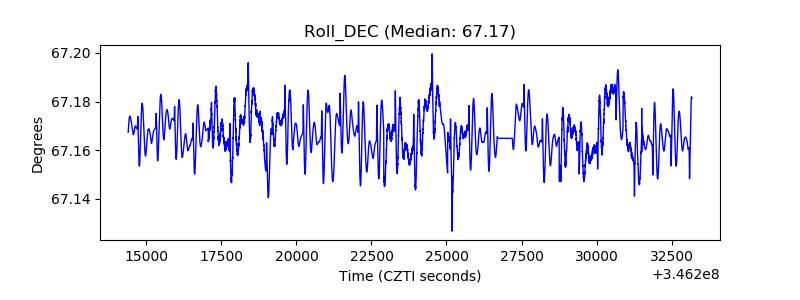 |
| _Roll_RA | 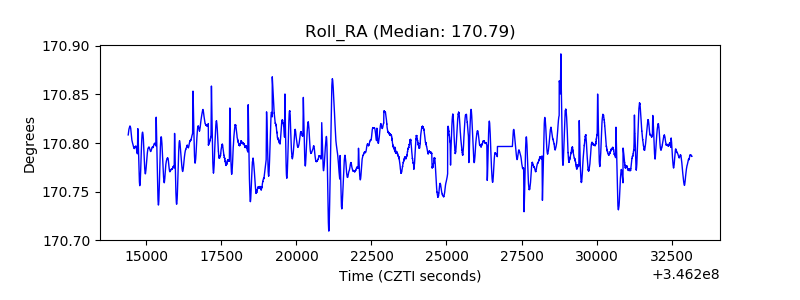 |
| Veto Counter | 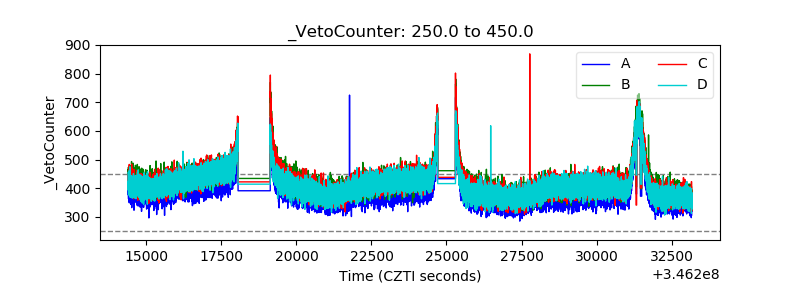 |