| Param | Original file | Final file |
|---|---|---|
| Filename | modeM0/AS1A10_102T06_9000004078_28289cztM0_level2.evt | modeM0/AS1A10_102T06_9000004078_28289cztM0_level2_quad_clean.evt |
| Size (bytes) | 522,123,840 | 107,746,560 |
| Size | 497.9 MB | 102.8 MB |
| Events in quadrant A | 3,256,232 | 703,374 |
| Events in quadrant B | 3,705,397 | 719,102 |
| Events in quadrant C | 3,270,560 | 689,863 |
| Events in quadrant D | 5,097,457 | 655,590 |
| Mode M0 | |||
|---|---|---|---|
| Quadrant | BADHDUFLAG | Total packets | Discarded packets |
| A | 0 | 14590 | 0 |
| B | 0 | 15785 | 0 |
| C | 0 | 14590 | 0 |
| D | 0 | 19867 | 0 |
| Quadrant | Total seconds | Saturated seconds | Saturation percentage |
|---|---|---|---|
| A | 7108 | 247 | 3.474958% |
| B | 7108 | 335 | 4.712999% |
| C | 7108 | 232 | 3.263928% |
| D | 7107 | 506 | 7.119741% |
Noise dominated data is calculated using 1-second bins in cleaned event files. If a bin has >2000 counts, and if more than 50% of those come from <1% of pixels, then it is considered to be noise-dominated and hence unusable.
| Quadrant | # 1 sec bins | Bins with >0 counts | Bins with >2000 counts | High rate bins dominated by noise | Noise dominated (total time) | Noise dominated (detector-on time) | Marked lightcurve |
|---|---|---|---|---|---|---|---|
| A | 7108 | 7108 | 0 | 0 | 0.00% | 0.00% | 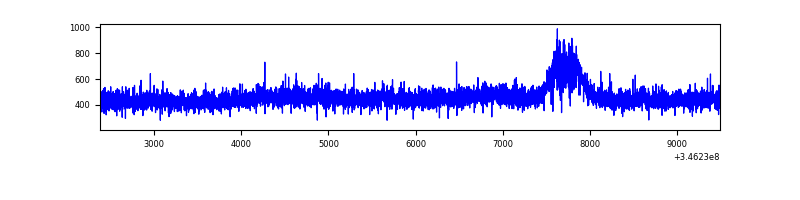 |
| B | 7108 | 7108 | 80 | 80 | 1.13% | 1.13% | 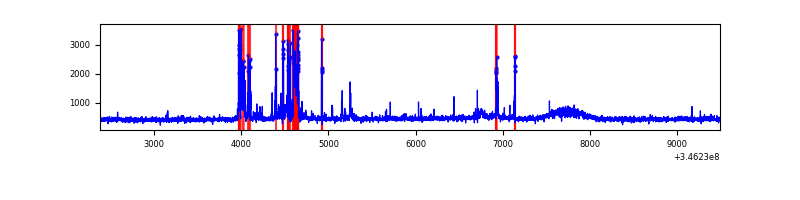 |
| C | 7108 | 7108 | 0 | 0 | 0.00% | 0.00% | 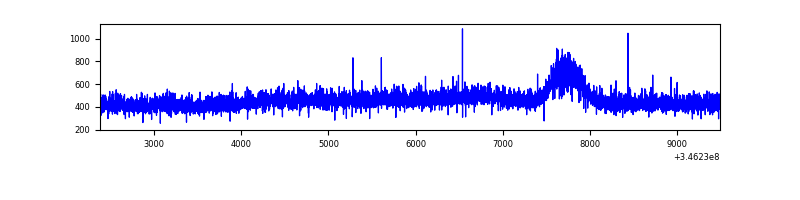 |
| D | 7107 | 7107 | 300 | 300 | 4.22% | 4.22% | 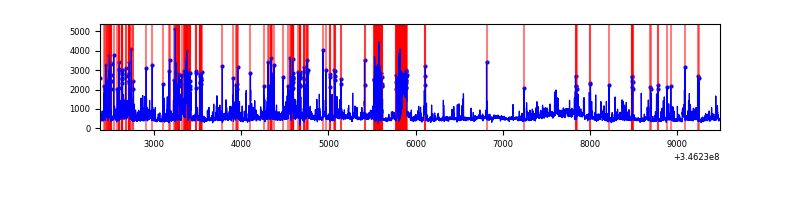 |
Top three noisy pixels from each quadrant. If the there are fewer than three noisy pixels in the level2.evt file, extra rows are filled as -1
| Pixel properties | Quadrant properties | ||||||
|---|---|---|---|---|---|---|---|
| Quadrant | DetID | PixID | Counts | Sigma | Mean | Median | Sigma |
| A | 13 | 254 | 11754 | 63.64 | 843 | 824 | 171.7 |
| A | 3 | 137 | 8426 | 44.26 | 843 | 824 | 171.7 |
| A | 0 | 226 | 7312 | 37.78 | 843 | 824 | 171.7 |
| B | 10 | 245 | 401422 | 2530.22 | 832 | 811 | 158.3 |
| B | 12 | 111 | 20215 | 122.55 | 832 | 811 | 158.3 |
| B | 11 | 111 | 18262 | 110.22 | 832 | 811 | 158.3 |
| C | 14 | 238 | 131598 | 695.38 | 804 | 806 | 188.1 |
| C | 13 | 61 | 5539 | 25.16 | 804 | 806 | 188.1 |
| C | 3 | 233 | 3288 | 13.19 | 804 | 806 | 188.1 |
| D | 1 | 52 | 1657263 | 8631.59 | 800 | 774 | 191.9 |
| D | 8 | 195 | 229843 | 1193.63 | 800 | 774 | 191.9 |
| D | 12 | 250 | 112443 | 581.88 | 800 | 774 | 191.9 |
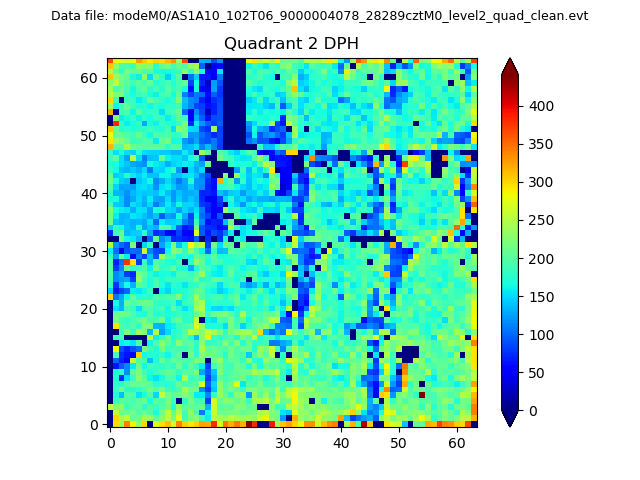
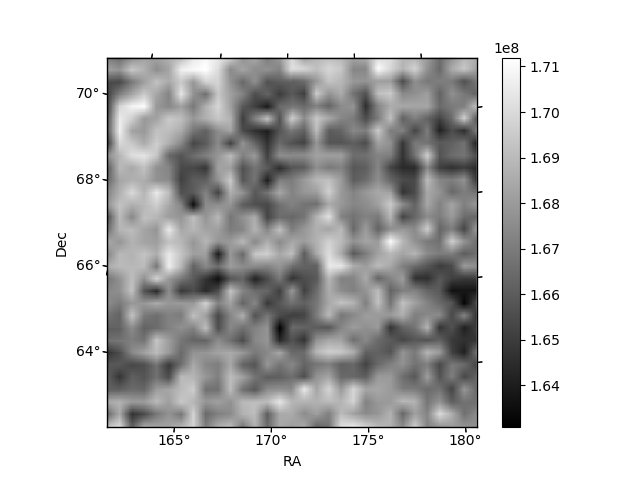
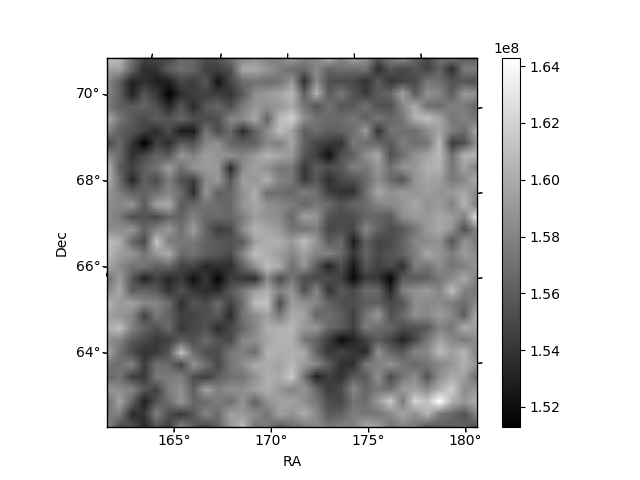
Histogram calculated using DETX and DETY for each event in the final _common_clean file
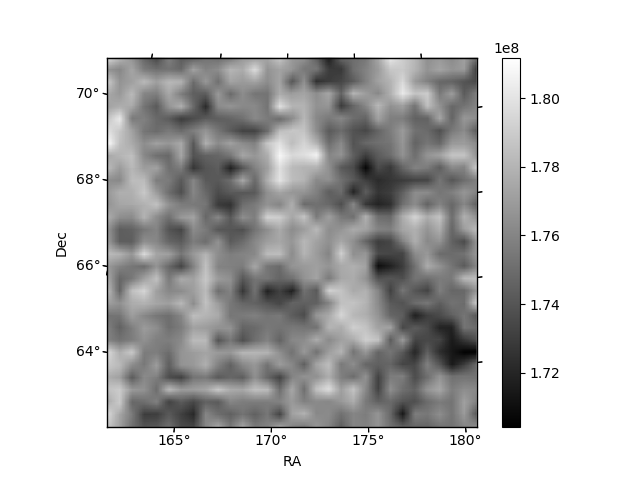
| Quadrant A | 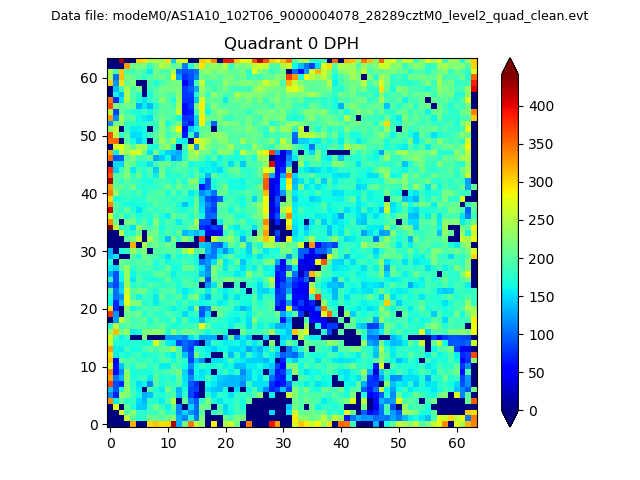 |
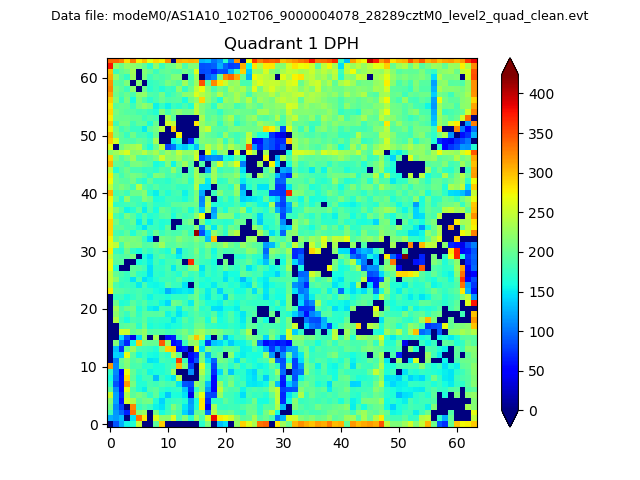 |
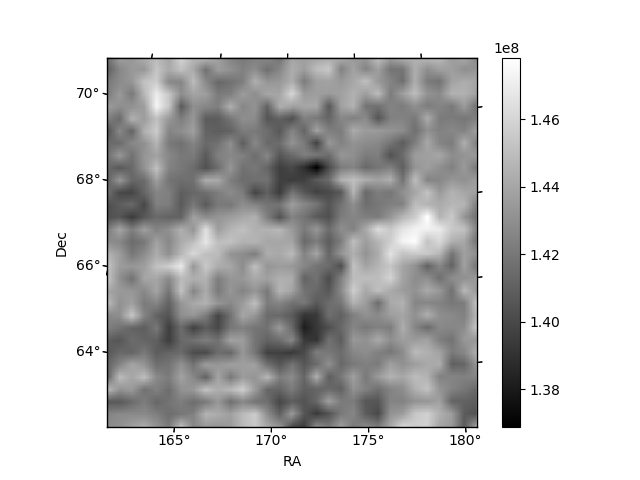
Quadrant B |
|---|---|---|---|
| Quadrant D | 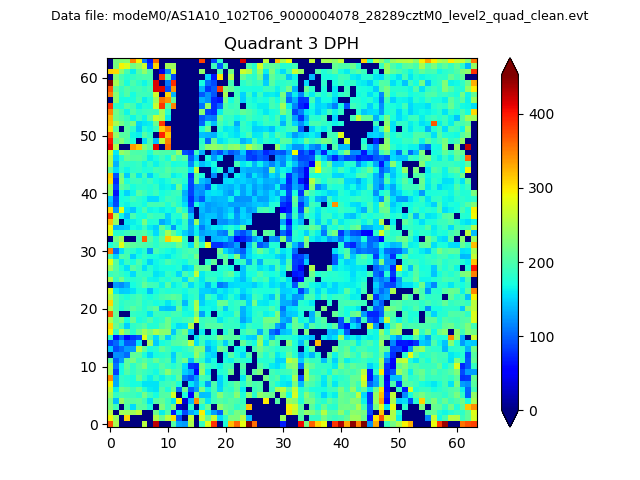 |
 |
Quadrant C |
| Plot type | Count rate plots | Images |
|---|---|---|
| Comparison with Poisson distribution Blue bars denote a histogram of data divided into 1 sec bins. Red curve is a Poisson curve with rate = median count rate of data. |
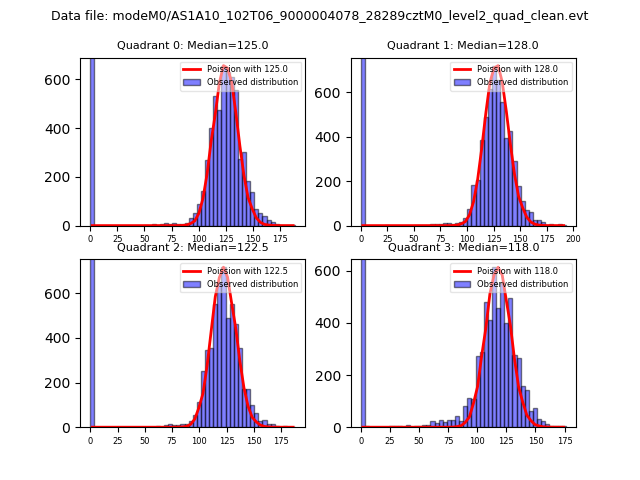 |
 |
| Quadrant-wise count rates Data is divided into 100 sec bins |
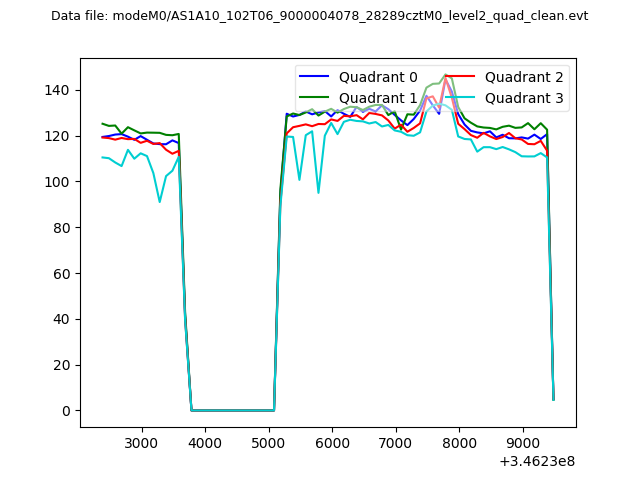 |
|
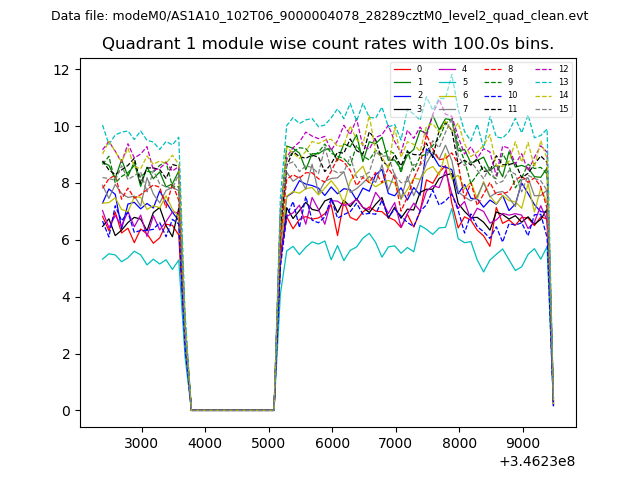
| Module-wise count rates for Quadrant A Data is divided into 100 sec bins |
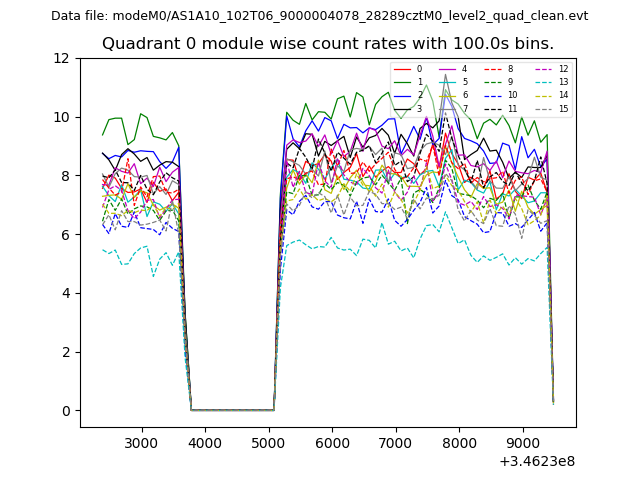 |
 |
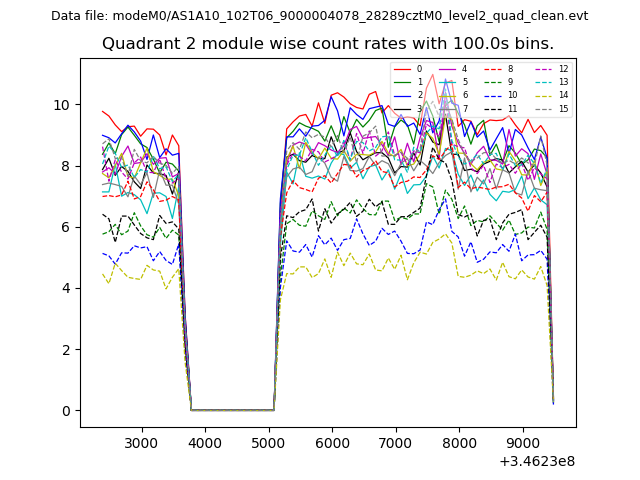
| Module-wise count rates for Quadrant B Data is divided into 100 sec bins |
 |
 |
| Module-wise count rates for Quadrant C Data is divided into 100 sec bins |
 |
 |
| Module-wise count rates for Quadrant D Data is divided into 100 sec bins |
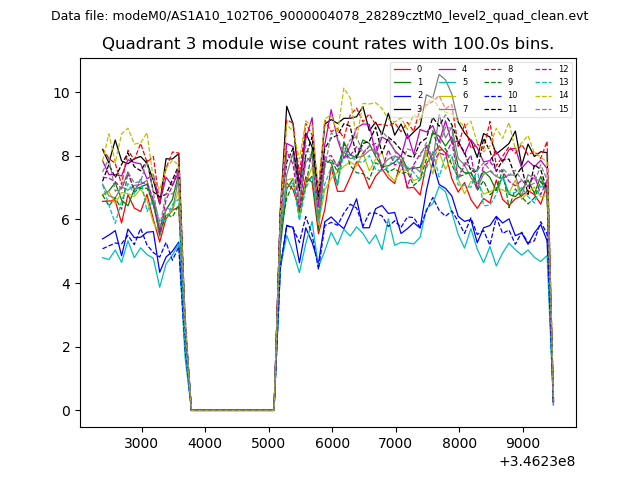 |
 |
| Parameter | Plot |
|---|---|
| CZT HV Monitor | 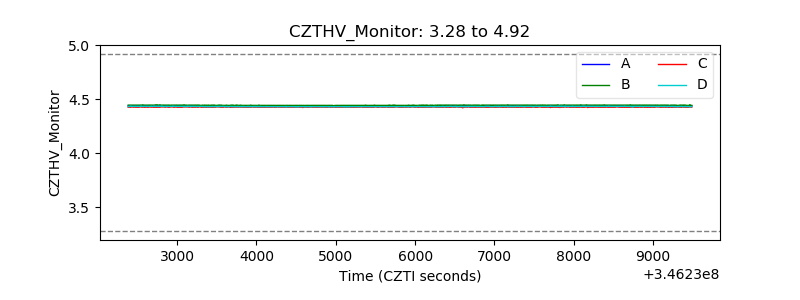 |
| D_VDD | 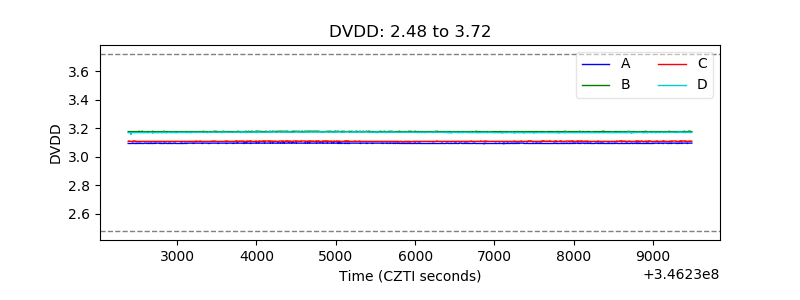 |
| Temperature 1 | 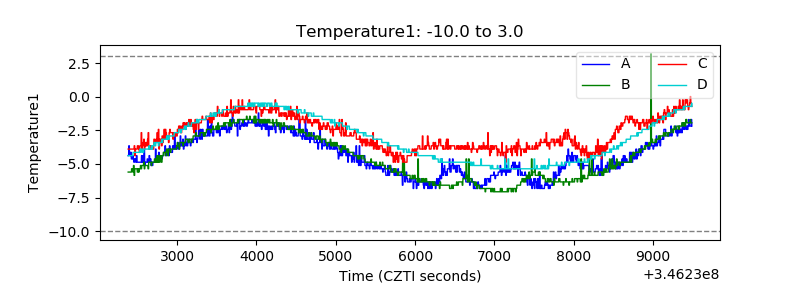 |
| Veto HV Monitor | 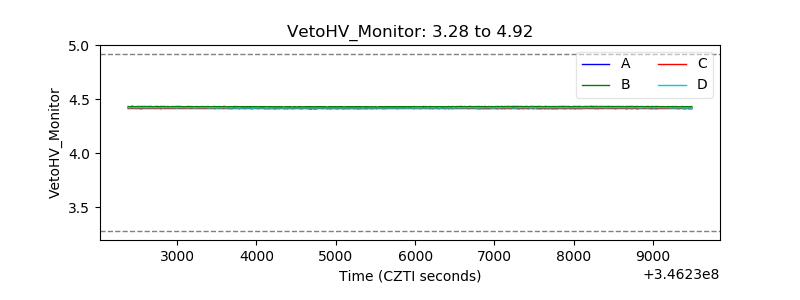 |
| Veto LLD | 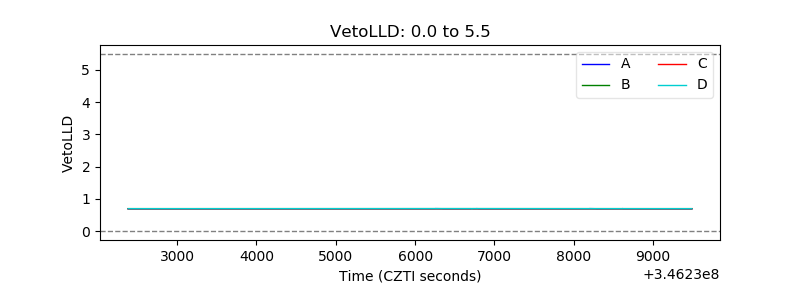 |
| Alpha Counter | 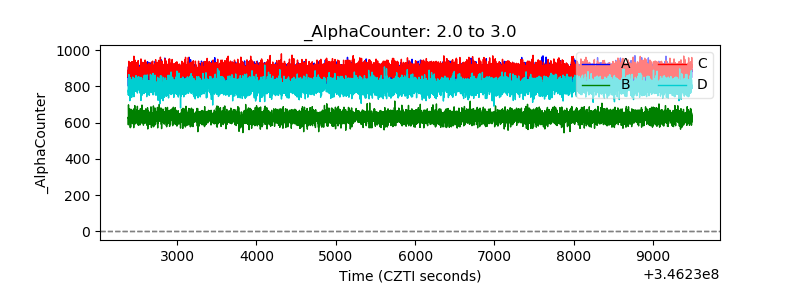 |
| _CPM_Rate | 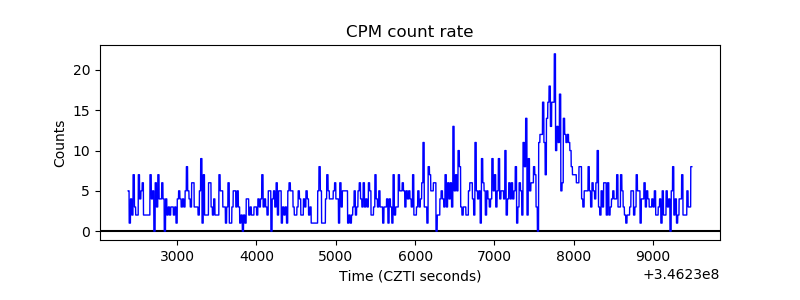 |
| CZT Counter | 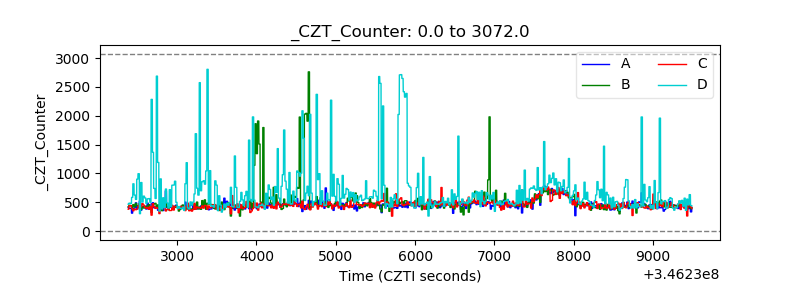 |
| +2.5 Volts monitor |  |
| +5 Volts monitor |  |
| _ROLL_ROT | 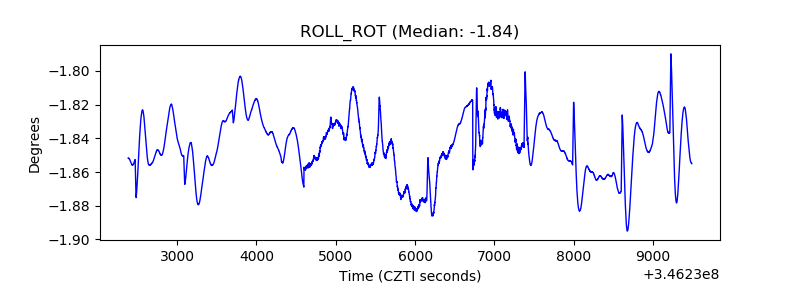 |
| _Roll_DEC | 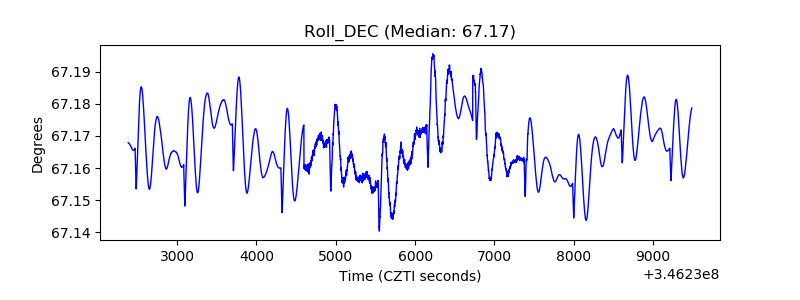 |
| _Roll_RA | 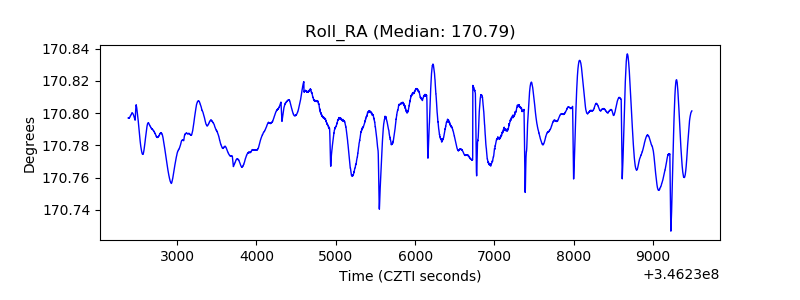 |
| Veto Counter | 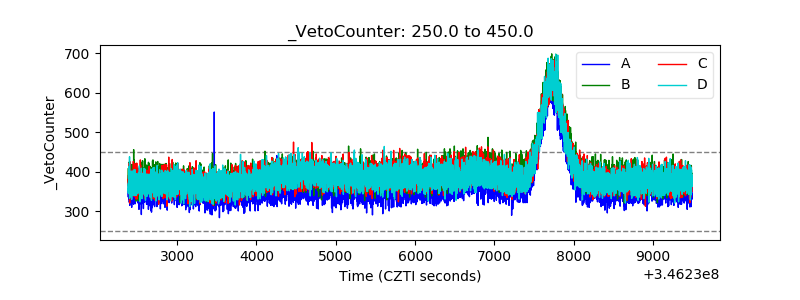 |