| Param | Original file | Final file |
|---|---|---|
| Filename | modeM0/AS1A10_102T06_9000004078_28290cztM0_level2.evt | modeM0/AS1A10_102T06_9000004078_28290cztM0_level2_quad_clean.evt |
| Size (bytes) | 558,889,920 | 90,432,000 |
| Size | 533.0 MB | 86.2 MB |
| Events in quadrant A | 3,107,067 | 590,932 |
| Events in quadrant B | 5,659,468 | 554,313 |
| Events in quadrant C | 3,030,358 | 576,254 |
| Events in quadrant D | 4,678,627 | 553,409 |
| Mode M9 | |||
|---|---|---|---|
| Quadrant | BADHDUFLAG | Total packets | Discarded packets |
| A | 0 | 4 | 0 |
| B | 0 | 4 | 0 |
| C | 0 | 4 | 0 |
| D | 0 | 4 | 0 |
| Mode M0 | |||
|---|---|---|---|
| Quadrant | BADHDUFLAG | Total packets | Discarded packets |
| A | 0 | 13669 | 0 |
| B | 0 | 21339 | 0 |
| C | 0 | 13442 | 0 |
| D | 0 | 18315 | 0 |
| Quadrant | Total seconds | Saturated seconds | Saturation percentage |
|---|---|---|---|
| A | 6644 | 72 | 1.083685% |
| B | 6645 | 948 | 14.266366% |
| C | 6645 | 93 | 1.399549% |
| D | 6645 | 231 | 3.476298% |
Noise dominated data is calculated using 1-second bins in cleaned event files. If a bin has >2000 counts, and if more than 50% of those come from <1% of pixels, then it is considered to be noise-dominated and hence unusable.
| Quadrant | # 1 sec bins | Bins with >0 counts | Bins with >2000 counts | High rate bins dominated by noise | Noise dominated (total time) | Noise dominated (detector-on time) | Marked lightcurve |
|---|---|---|---|---|---|---|---|
| A | 7029 | 6645 | 2 | 2 | 0.03% | 0.03% | 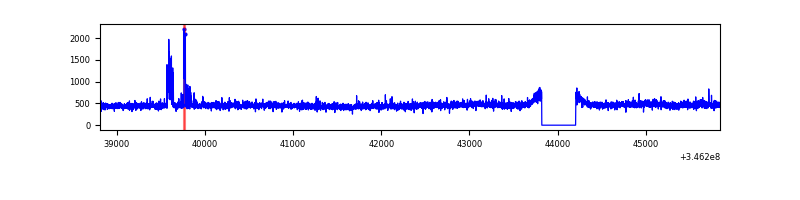 |
| B | 7030 | 6645 | 636 | 636 | 9.05% | 9.57% | 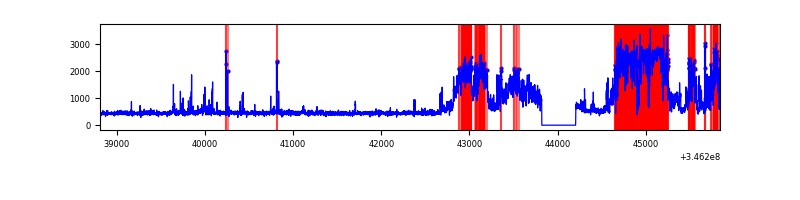 |
| C | 7030 | 6646 | 0 | 0 | 0.00% | 0.00% | 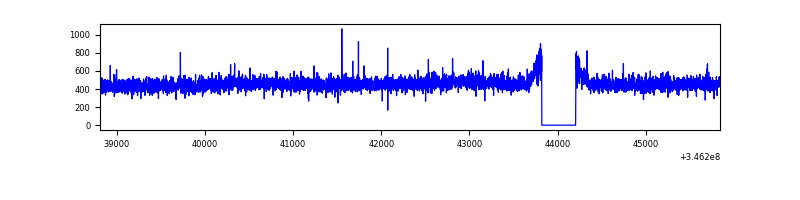 |
| D | 7030 | 6645 | 175 | 175 | 2.49% | 2.63% | 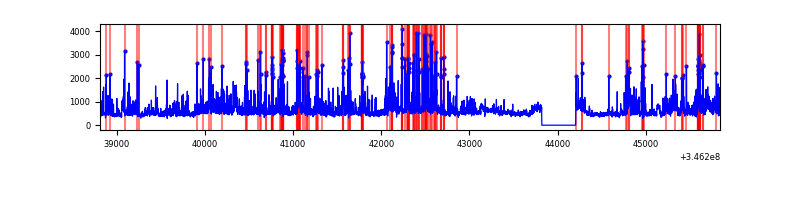 |
Top three noisy pixels from each quadrant. If the there are fewer than three noisy pixels in the level2.evt file, extra rows are filled as -1
| Pixel properties | Quadrant properties | ||||||
|---|---|---|---|---|---|---|---|
| Quadrant | DetID | PixID | Counts | Sigma | Mean | Median | Sigma |
| A | 15 | 174 | 77698 | 485.01 | 781 | 764 | 158.6 |
| A | 7 | 16 | 15485 | 92.8 | 781 | 764 | 158.6 |
| A | 13 | 254 | 11095 | 65.13 | 781 | 764 | 158.6 |
| B | 10 | 245 | 2684016 | 19023.29 | 737 | 720 | 141.1 |
| B | 0 | 156 | 20919 | 143.2 | 737 | 720 | 141.1 |
| B | 12 | 111 | 17573 | 119.48 | 737 | 720 | 141.1 |
| C | 14 | 238 | 120682 | 688.65 | 743 | 748 | 174.2 |
| C | 3 | 233 | 9534 | 50.45 | 743 | 748 | 174.2 |
| C | 13 | 61 | 5252 | 25.86 | 743 | 748 | 174.2 |
| D | 1 | 52 | 1282185 | 7246.92 | 744 | 723 | 176.8 |
| D | 8 | 195 | 273489 | 1542.55 | 744 | 723 | 176.8 |
| D | 2 | 250 | 103099 | 578.96 | 744 | 723 | 176.8 |
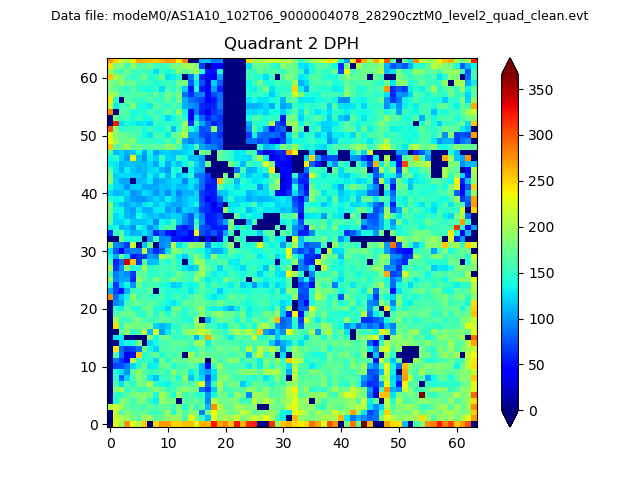
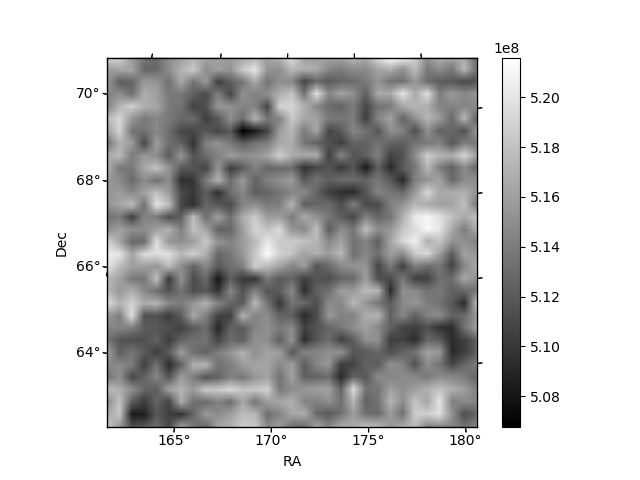
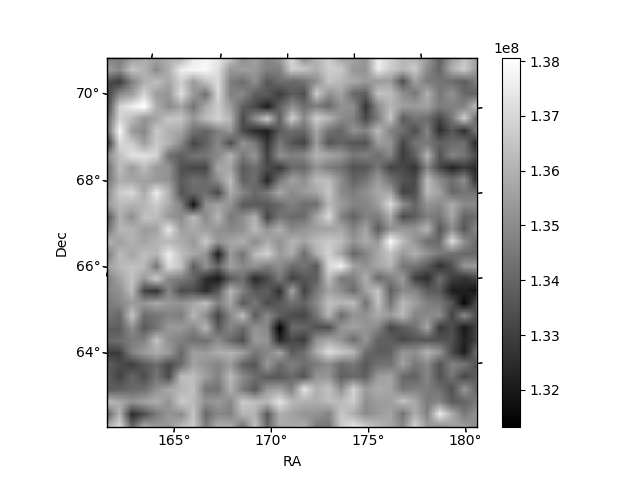
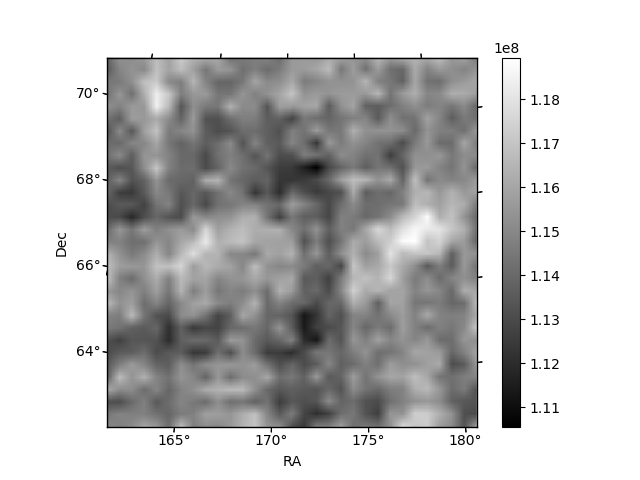
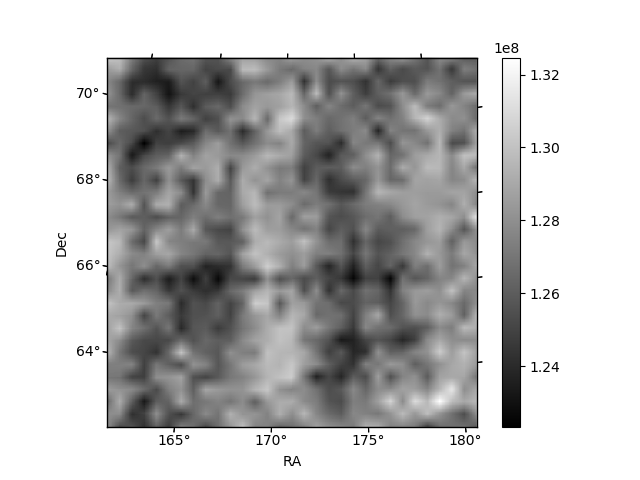
Histogram calculated using DETX and DETY for each event in the final _common_clean file
| Quadrant A | 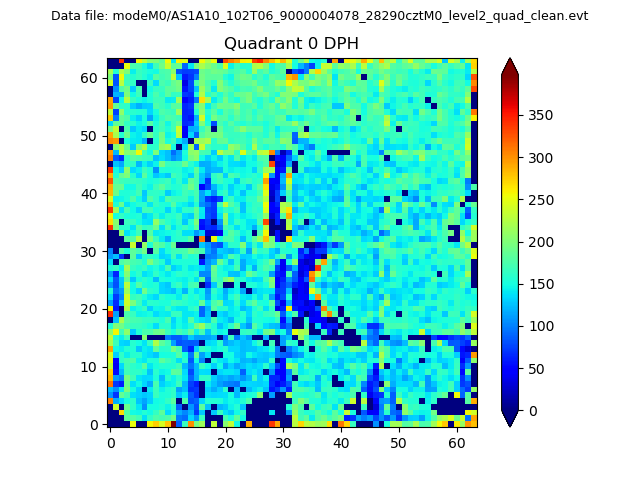 |
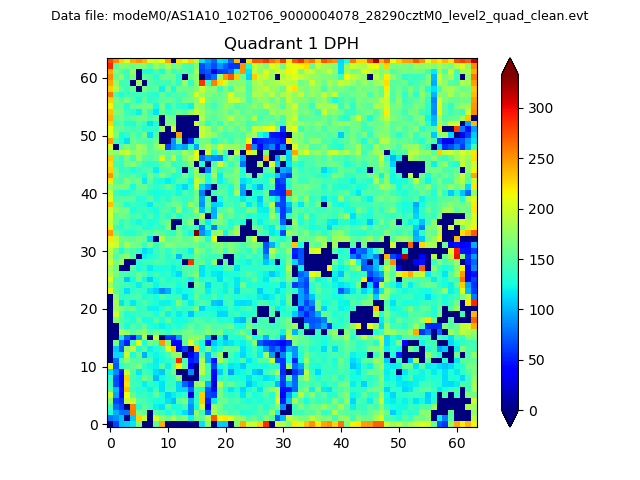 |
Quadrant B |
|---|---|---|---|
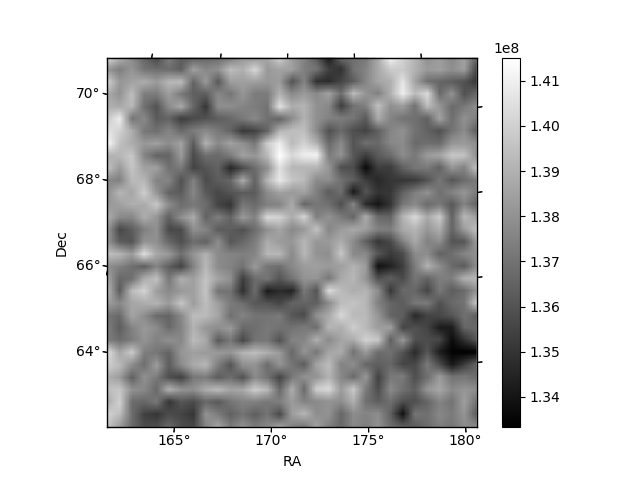
| Quadrant D | 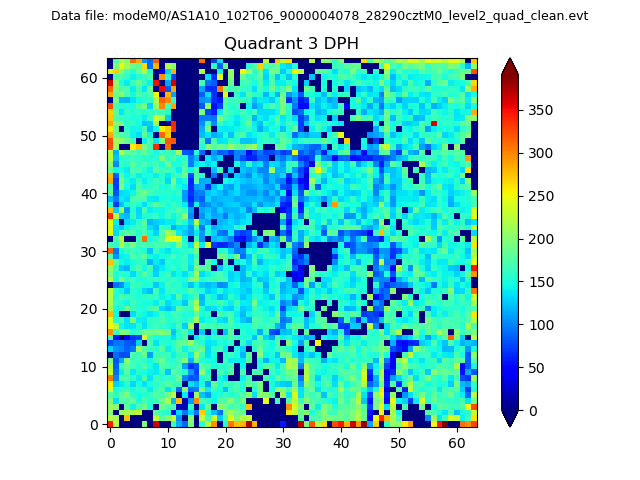 |
 |
Quadrant C |
| Plot type | Count rate plots | Images |
|---|---|---|
| Comparison with Poisson distribution Blue bars denote a histogram of data divided into 1 sec bins. Red curve is a Poisson curve with rate = median count rate of data. |
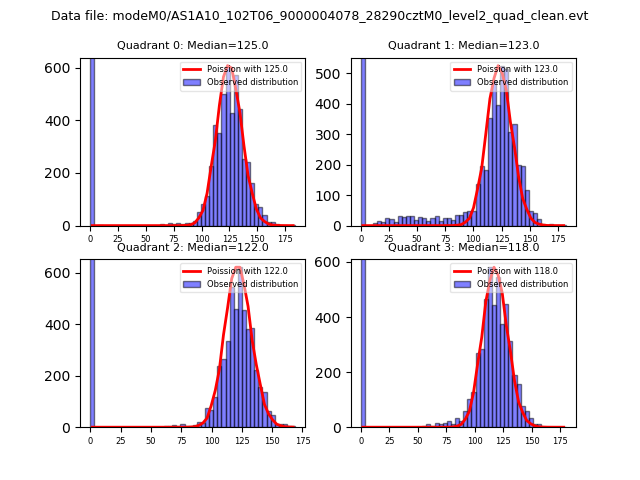 |
 |
| Quadrant-wise count rates Data is divided into 100 sec bins |
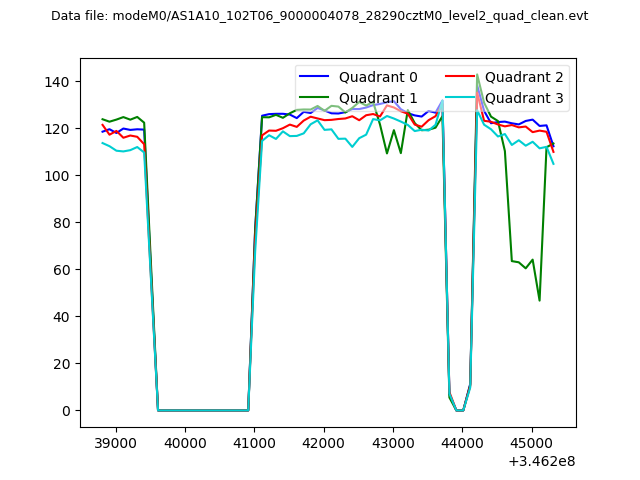 |
|
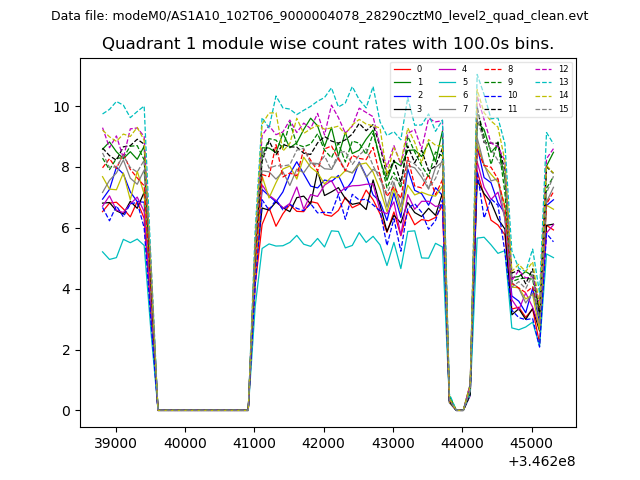
| Module-wise count rates for Quadrant A Data is divided into 100 sec bins |
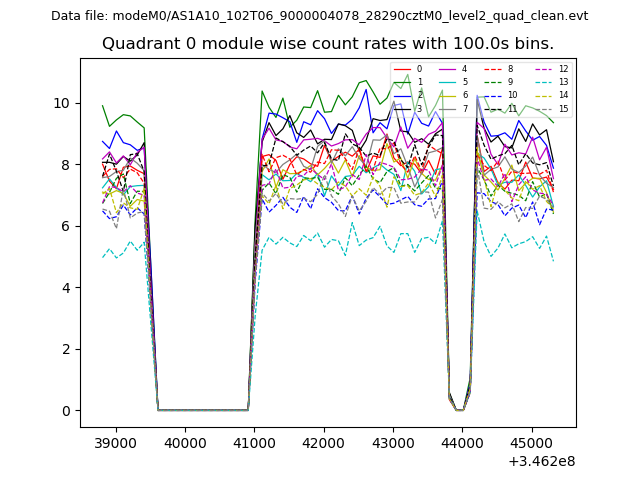 |
 |
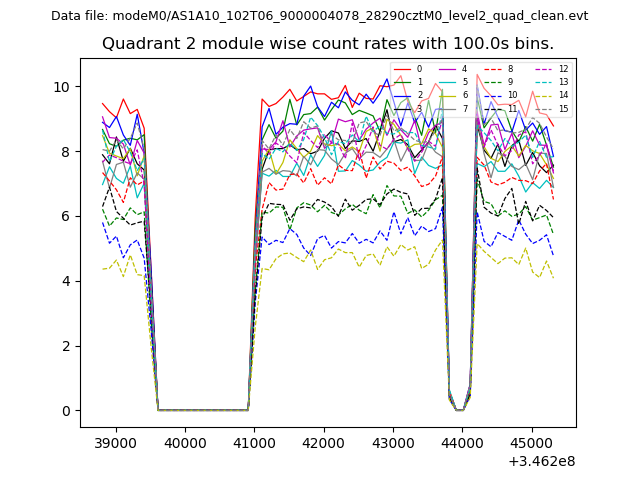
| Module-wise count rates for Quadrant B Data is divided into 100 sec bins |
 |
 |
| Module-wise count rates for Quadrant C Data is divided into 100 sec bins |
 |
 |
| Module-wise count rates for Quadrant D Data is divided into 100 sec bins |
 |
 |
| Parameter | Plot |
|---|---|
| CZT HV Monitor | 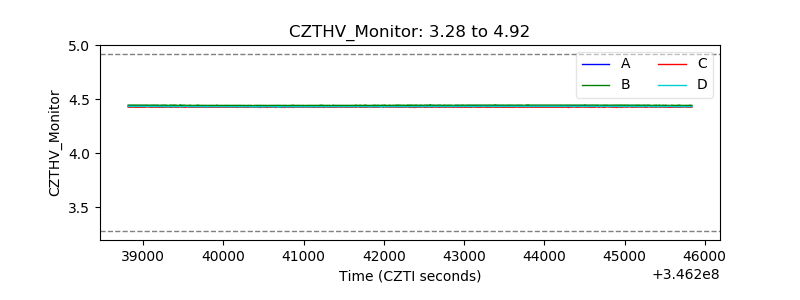 |
| D_VDD | 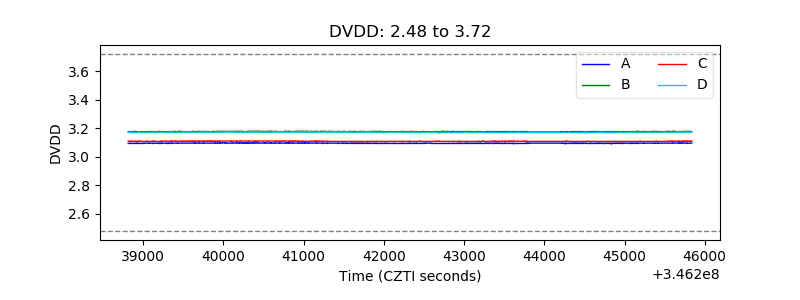 |
| Temperature 1 | 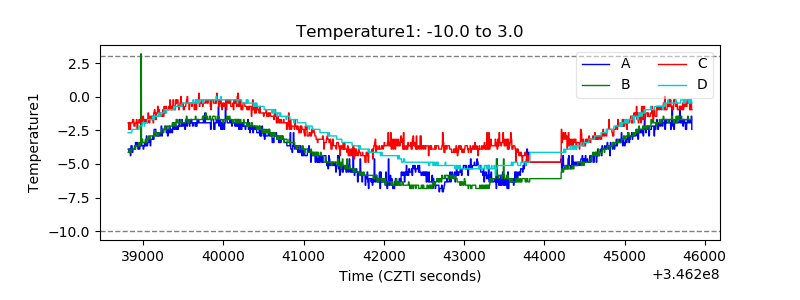 |
| Veto HV Monitor | 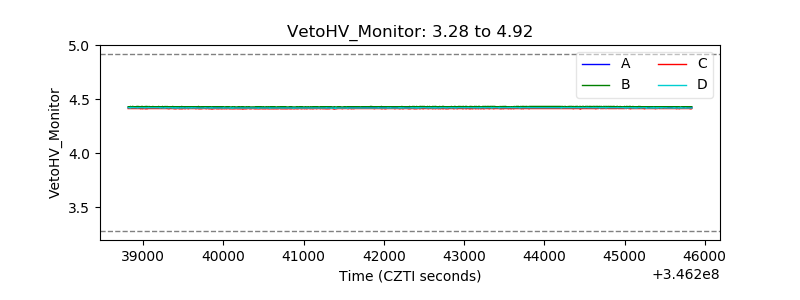 |
| Veto LLD | 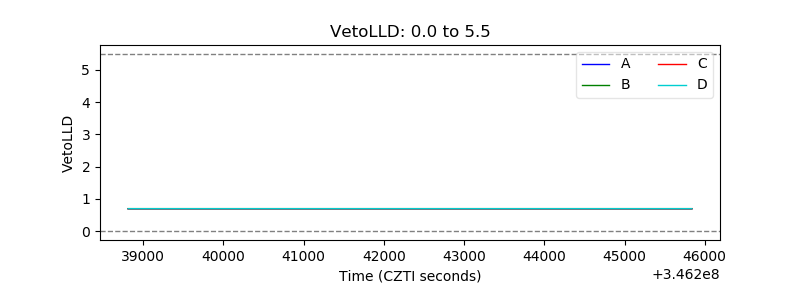 |
| Alpha Counter | 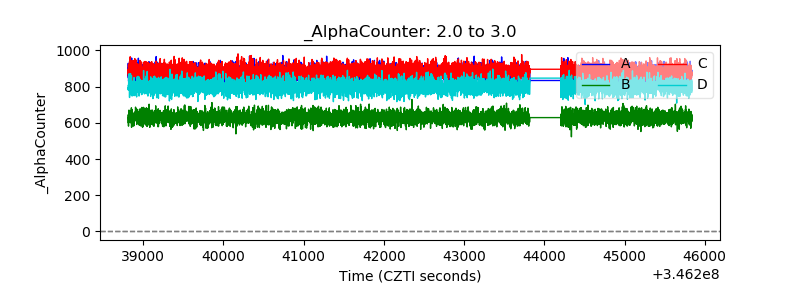 |
| _CPM_Rate | 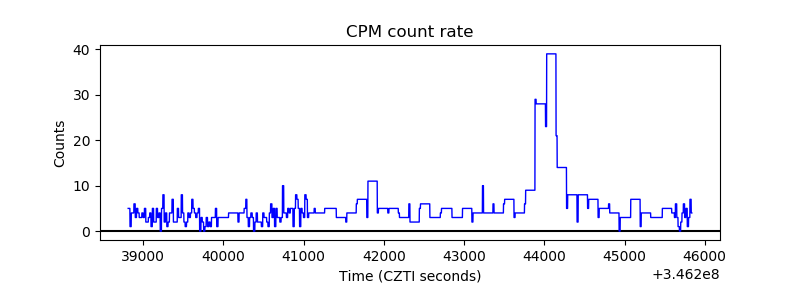 |
| CZT Counter | 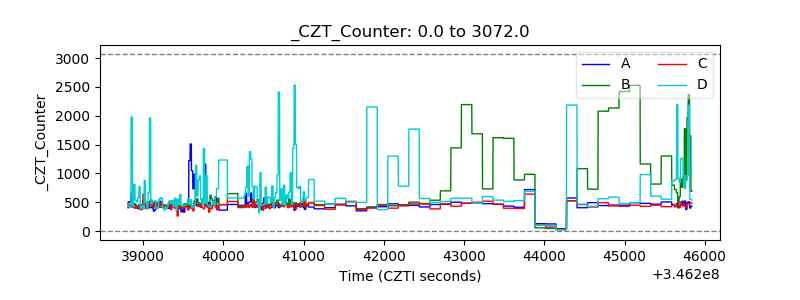 |
| +2.5 Volts monitor | 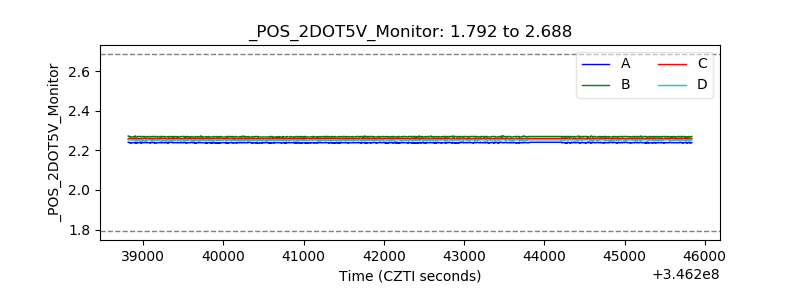 |
| +5 Volts monitor | 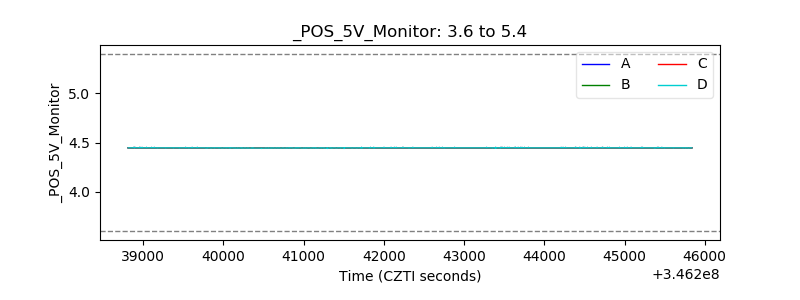 |
| _ROLL_ROT | 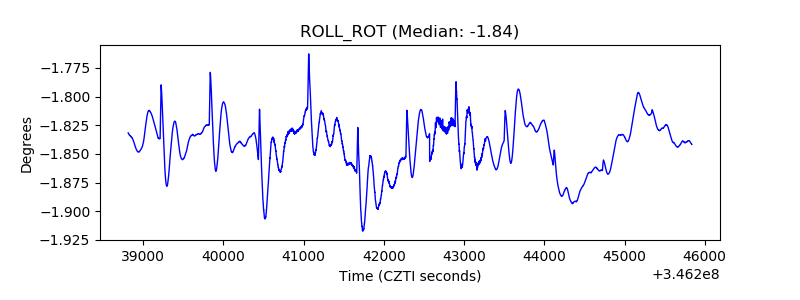 |
| _Roll_DEC |  |
| _Roll_RA | 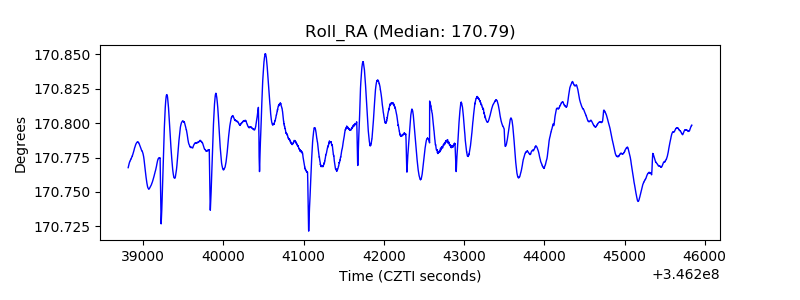 |
| Veto Counter | 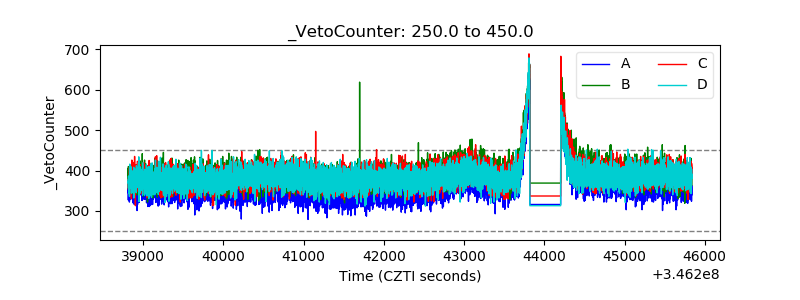 |