| Param | Original file | Final file |
|---|---|---|
| Filename | modeM0/AS1A10_102T06_9000004078_28292cztM0_level2.evt | modeM0/AS1A10_102T06_9000004078_28292cztM0_level2_quad_clean.evt |
| Size (bytes) | 1,088,933,760 | 151,611,840 |
| Size | 1.0 GB | 144.6 MB |
| Events in quadrant A | 5,855,464 | 989,155 |
| Events in quadrant B | 11,206,220 | 878,238 |
| Events in quadrant C | 5,614,124 | 960,340 |
| Events in quadrant D | 9,483,084 | 923,801 |
| Mode M9 | |||
|---|---|---|---|
| Quadrant | BADHDUFLAG | Total packets | Discarded packets |
| A | 0 | 13 | 0 |
| B | 0 | 13 | 0 |
| C | 0 | 13 | 0 |
| D | 0 | 13 | 0 |
| Mode M0 | |||
|---|---|---|---|
| Quadrant | BADHDUFLAG | Total packets | Discarded packets |
| A | 0 | 25312 | 0 |
| B | 0 | 41179 | 0 |
| C | 0 | 24578 | 0 |
| D | 0 | 36577 | 0 |
| Quadrant | Total seconds | Saturated seconds | Saturation percentage |
|---|---|---|---|
| A | 12128 | 107 | 0.882256% |
| B | 12129 | 2376 | 19.589414% |
| C | 12129 | 143 | 1.178992% |
| D | 12129 | 674 | 5.556930% |
Noise dominated data is calculated using 1-second bins in cleaned event files. If a bin has >2000 counts, and if more than 50% of those come from <1% of pixels, then it is considered to be noise-dominated and hence unusable.
| Quadrant | # 1 sec bins | Bins with >0 counts | Bins with >2000 counts | High rate bins dominated by noise | Noise dominated (total time) | Noise dominated (detector-on time) | Marked lightcurve |
|---|---|---|---|---|---|---|---|
| A | 13493 | 12128 | 27 | 27 | 0.20% | 0.22% | 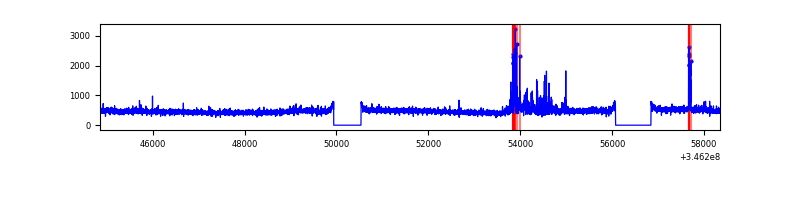 |
| B | 13494 | 12130 | 2099 | 2099 | 15.56% | 17.30% | 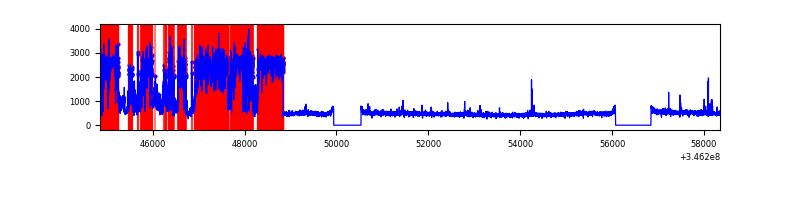 |
| C | 13494 | 12129 | 0 | 0 | 0.00% | 0.00% | 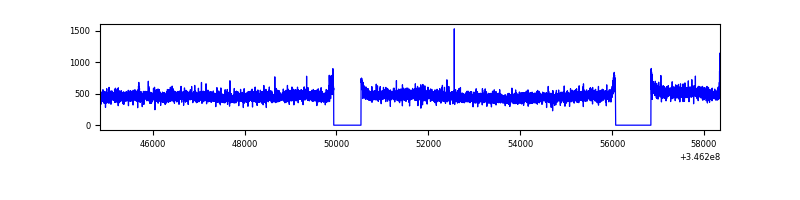 |
| D | 13494 | 12130 | 516 | 516 | 3.82% | 4.25% | 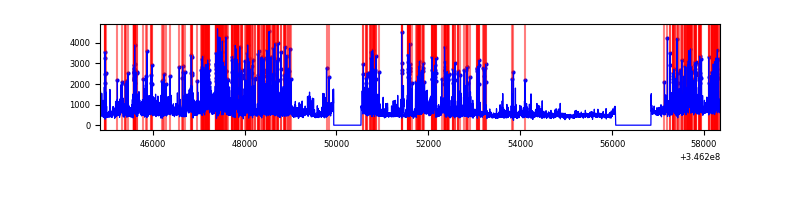 |
Top three noisy pixels from each quadrant. If the there are fewer than three noisy pixels in the level2.evt file, extra rows are filled as -1
| Pixel properties | Quadrant properties | ||||||
|---|---|---|---|---|---|---|---|
| Quadrant | DetID | PixID | Counts | Sigma | Mean | Median | Sigma |
| A | 15 | 174 | 294755 | 1018.67 | 1436 | 1403 | 288.0 |
| A | 7 | 16 | 21803 | 70.84 | 1436 | 1403 | 288.0 |
| A | 13 | 254 | 20519 | 66.38 | 1436 | 1403 | 288.0 |
| B | 10 | 245 | 5949985 | 23776.76 | 1319 | 1284 | 250.2 |
| B | 4 | 200 | 43920 | 170.41 | 1319 | 1284 | 250.2 |
| B | 12 | 111 | 31155 | 119.39 | 1319 | 1284 | 250.2 |
| C | 14 | 238 | 222804 | 686.41 | 1373 | 1376 | 322.6 |
| C | 3 | 233 | 31801 | 94.32 | 1373 | 1376 | 322.6 |
| C | 13 | 61 | 9623 | 25.57 | 1373 | 1376 | 322.6 |
| D | 1 | 52 | 2502240 | 7678.51 | 1364 | 1324 | 325.7 |
| D | 8 | 195 | 911489 | 2794.46 | 1364 | 1324 | 325.7 |
| D | 12 | 250 | 395709 | 1210.87 | 1364 | 1324 | 325.7 |
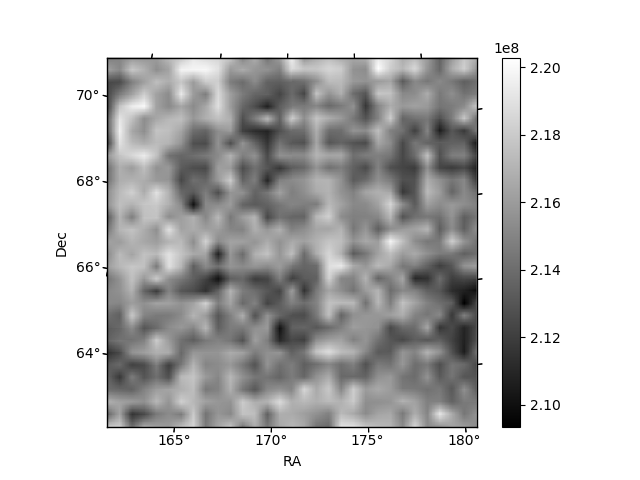
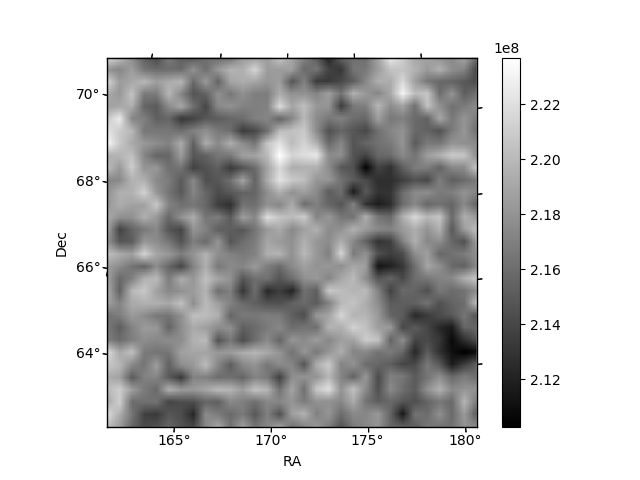
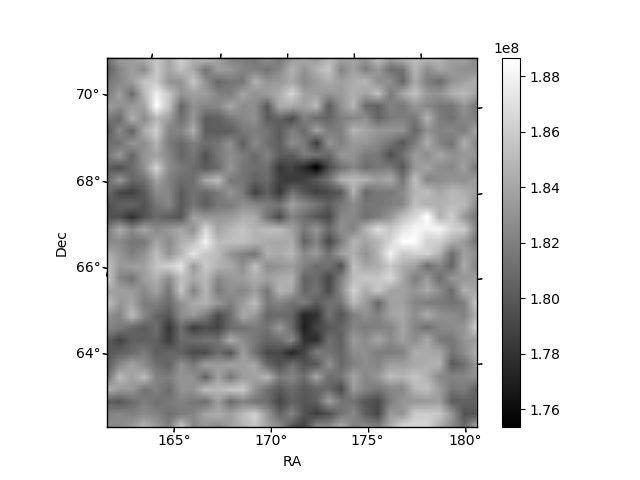
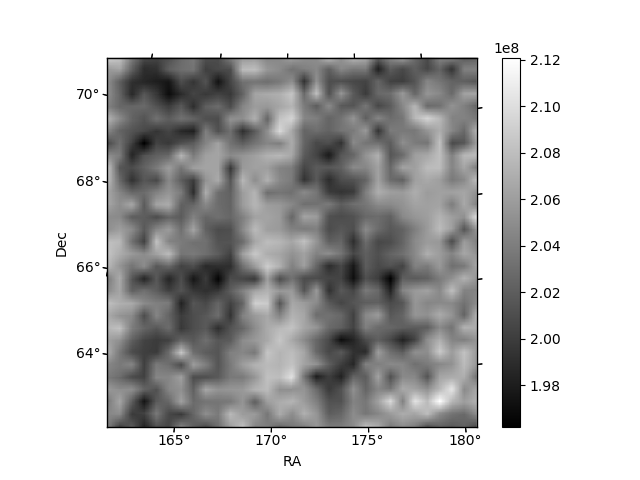
Histogram calculated using DETX and DETY for each event in the final _common_clean file
| Quadrant A | 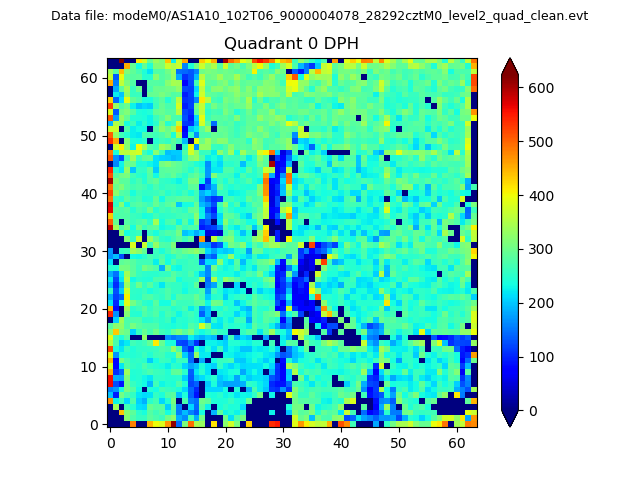 |
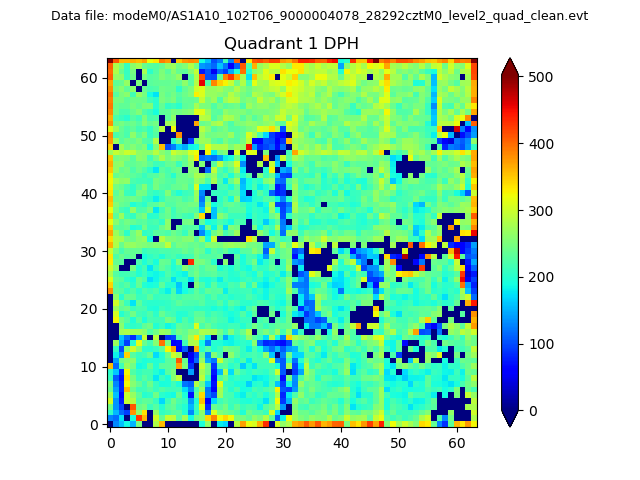 |
Quadrant B |
|---|---|---|---|
| Quadrant D |  |
 |
Quadrant C |
| Plot type | Count rate plots | Images |
|---|---|---|
| Comparison with Poisson distribution Blue bars denote a histogram of data divided into 1 sec bins. Red curve is a Poisson curve with rate = median count rate of data. |
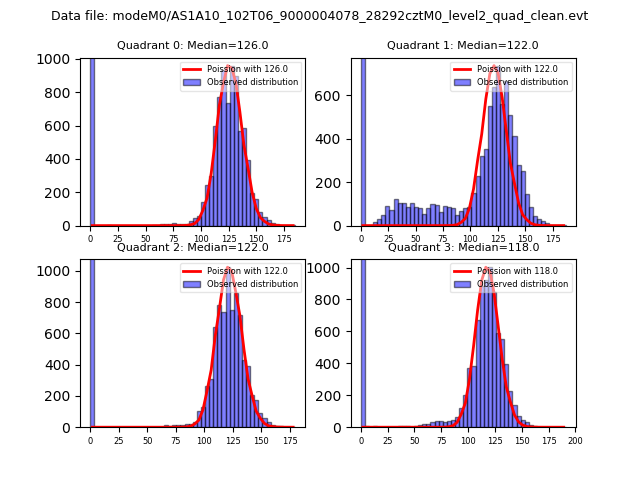 |
 |
| Quadrant-wise count rates Data is divided into 100 sec bins |
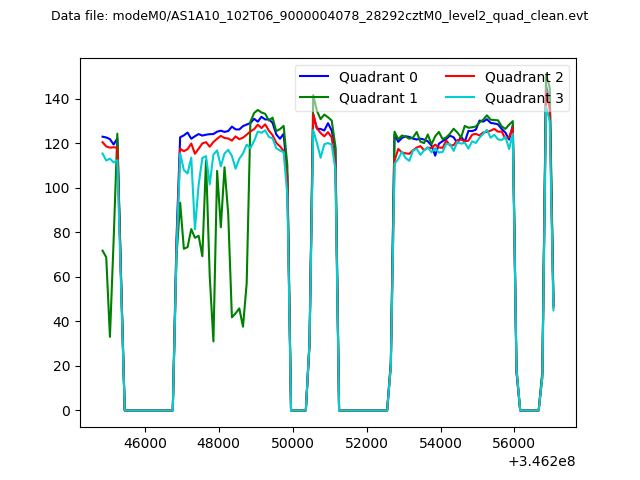 |
|
| Module-wise count rates for Quadrant A Data is divided into 100 sec bins |
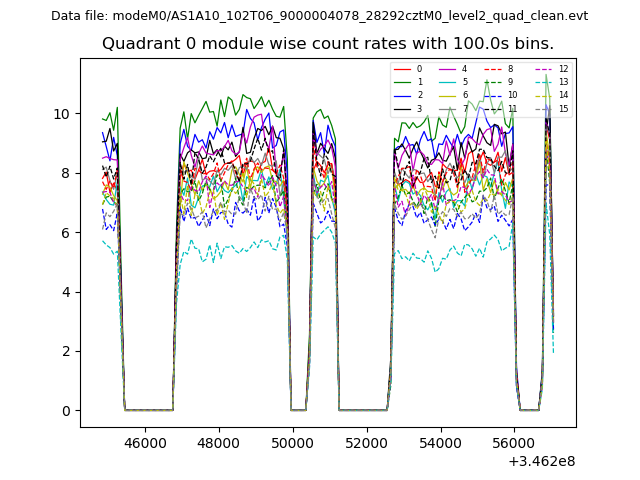 |
 |
| Module-wise count rates for Quadrant B Data is divided into 100 sec bins |
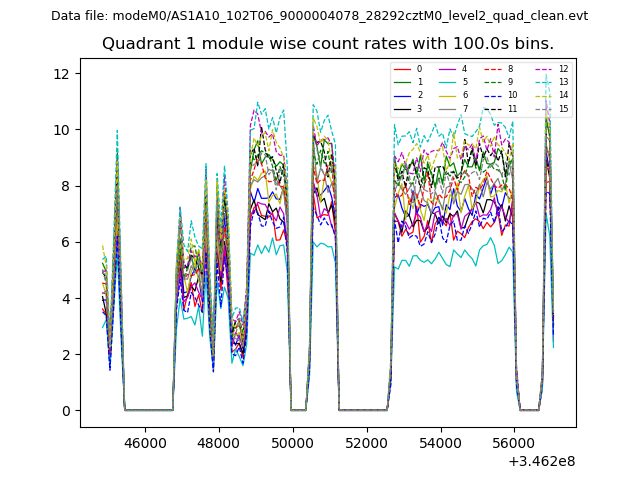 |
 |
| Module-wise count rates for Quadrant C Data is divided into 100 sec bins |
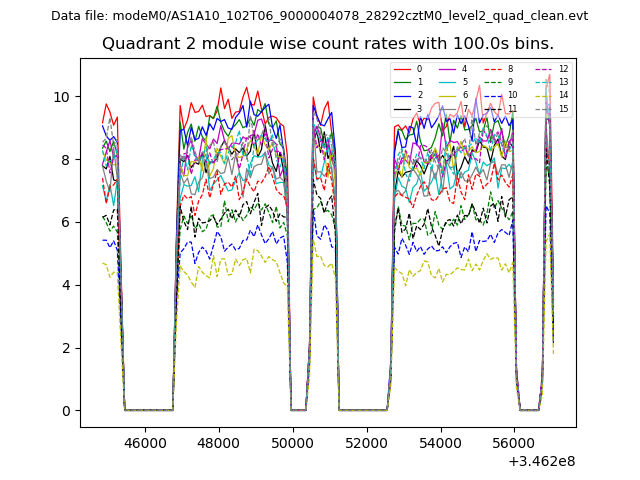 |
 |
| Module-wise count rates for Quadrant D Data is divided into 100 sec bins |
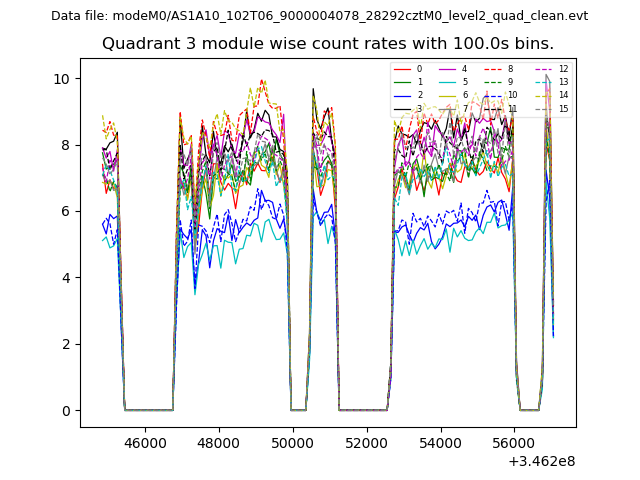 |
 |
| Parameter | Plot |
|---|---|
| CZT HV Monitor | 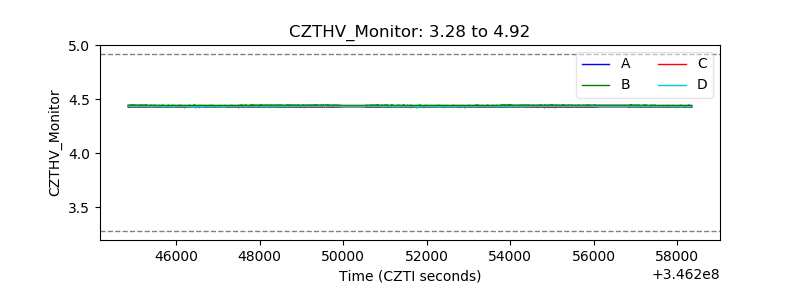 |
| D_VDD | 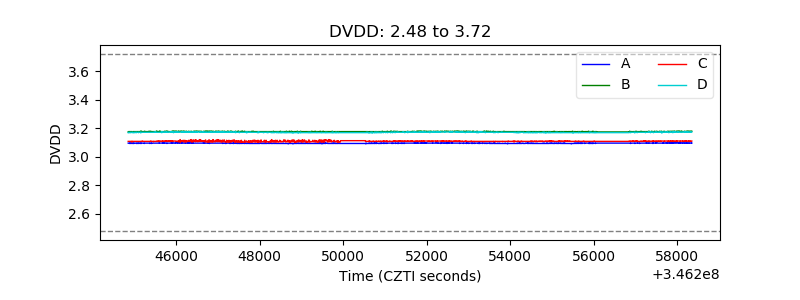 |
| Temperature 1 | 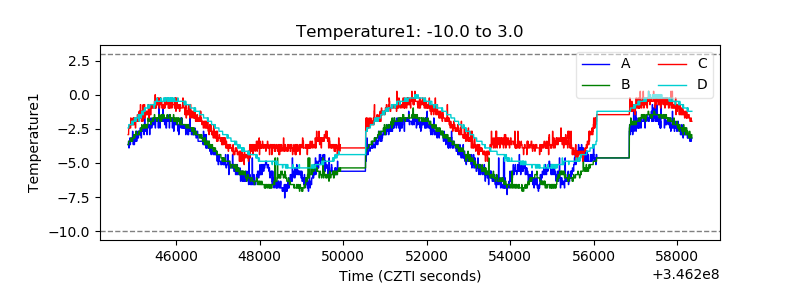 |
| Veto HV Monitor | 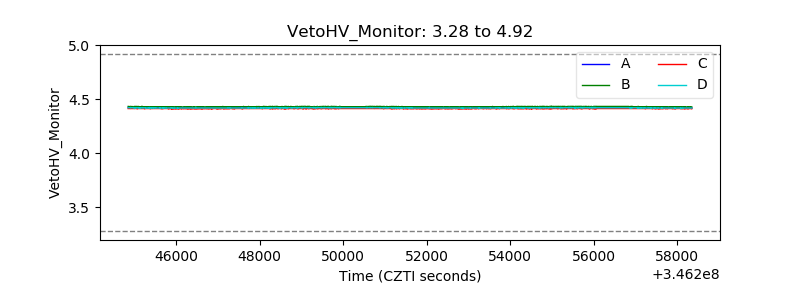 |
| Veto LLD | 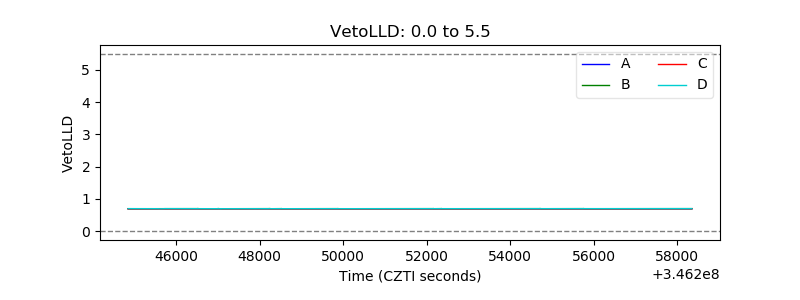 |
| Alpha Counter | 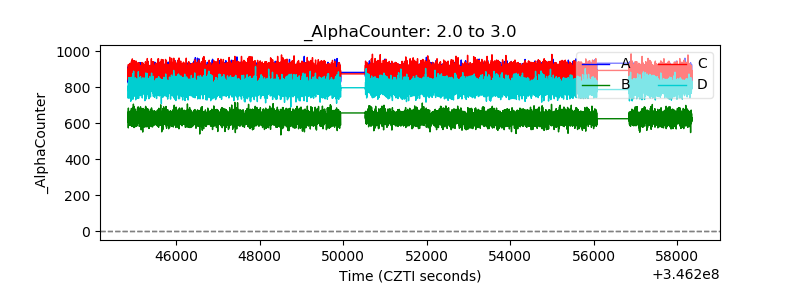 |
| _CPM_Rate | 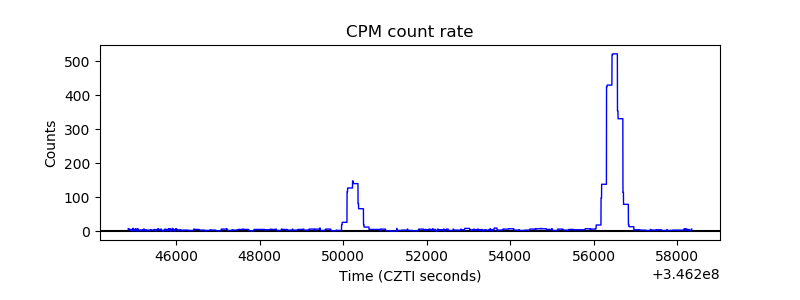 |
| CZT Counter |  |
| +2.5 Volts monitor |  |
| +5 Volts monitor | 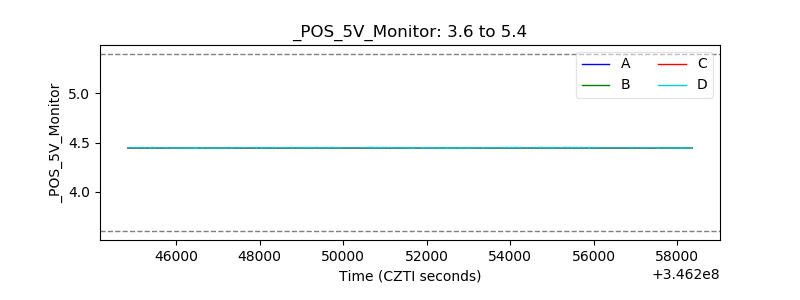 |
| _ROLL_ROT | 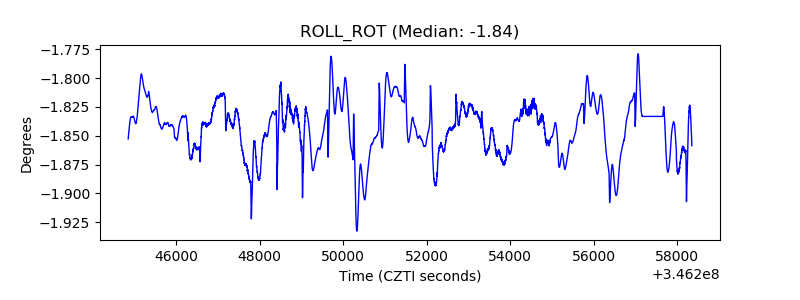 |
| _Roll_DEC | 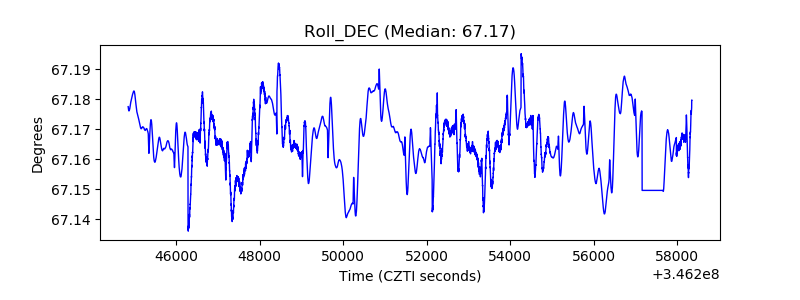 |
| _Roll_RA |  |
| Veto Counter | 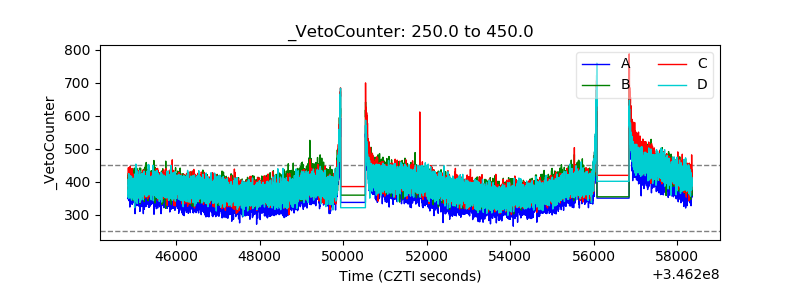 |